| Param | Original file | Final file |
|---|---|---|
| Filename | modeM0/AS1A11_034T02_9000004856cztM0_level2.fits | modeM0/AS1A11_034T02_9000004856cztM0_level2_quad_clean.evt |
| Size (bytes) | 112,060,800 | 90,469,440 |
| Size | 106.9 MB | 86.3 MB |
| Events in quadrant A | 686,036 | 508,465 |
| Events in quadrant B | 651,060 | 501,224 |
| Events in quadrant C | 664,108 | 474,619 |
| Events in quadrant D | 557,256 | 419,421 |
| Mode M9 | |||
|---|---|---|---|
| Quadrant | BADHDUFLAG | Total packets | Discarded packets |
| A | 0 | 41 | 0 |
| B | 0 | 41 | 0 |
| C | 0 | 41 | 0 |
| D | 0 | 41 | 0 |
| Mode SS | |||
|---|---|---|---|
| Quadrant | BADHDUFLAG | Total packets | Discarded packets |
| A | 0 | 248 | 0 |
| B | 0 | 248 | 0 |
| C | 0 | 248 | 0 |
| D | 0 | 248 | 0 |
| Mode M0 | |||
|---|---|---|---|
| Quadrant | BADHDUFLAG | Total packets | Discarded packets |
| A | 0 | 26847 | 0 |
| B | 0 | 28414 | 0 |
| C | 0 | 27092 | 0 |
| D | 0 | 40990 | 0 |
| Quadrant | Total seconds | Saturated seconds | Saturation percentage |
|---|---|---|---|
| A | 12073 | 93 | 0.770314% |
| B | 12073 | 276 | 2.286093% |
| C | 12073 | 115 | 0.952539% |
| D | 12073 | 823 | 6.816864% |
Noise dominated data is calculated using 1-second bins in cleaned event files. If a bin has >2000 counts, and if more than 50% of those come from <1% of pixels, then it is considered to be noise-dominated and hence unusable.
| Quadrant | # 1 sec bins | Bins with >0 counts | Bins with >2000 counts | High rate bins dominated by noise | Noise dominated (total time) | Noise dominated (detector-on time) | Marked lightcurve |
|---|---|---|---|---|---|---|---|
| A | 16162 | 12073 | 0 | 0 | 0.00% | 0.00% |  |
| B | 16162 | 12073 | 0 | 0 | 0.00% | 0.00% |  |
| C | 16162 | 12071 | 0 | 0 | 0.00% | 0.00% |  |
| D | 16162 | 12056 | 0 | 0 | 0.00% | 0.00% |  |
Top three noisy pixels from each quadrant. If the there are fewer than three noisy pixels in the level2.evt file, extra rows are filled as -1
| Pixel properties | Quadrant properties | ||||||
|---|---|---|---|---|---|---|---|
| Quadrant | DetID | PixID | Counts | Sigma | Mean | Median | Sigma |
| A | 0 | 29 | 562 | 8.54 | 179 | 168 | 46.2 |
| A | 9 | 19 | 551 | 8.3 | 179 | 168 | 46.2 |
| A | 7 | 110 | 529 | 7.82 | 179 | 168 | 46.2 |
| B | 2 | 9 | 570 | 11.24 | 172 | 164 | 36.1 |
| B | 3 | 80 | 542 | 10.46 | 172 | 164 | 36.1 |
| B | 2 | 8 | 480 | 8.75 | 172 | 164 | 36.1 |
| C | 3 | 187 | 471 | 6.61 | 176 | 165 | 46.3 |
| C | 7 | 233 | 434 | 5.81 | 176 | 165 | 46.3 |
| C | 1 | 65 | 431 | 5.75 | 176 | 165 | 46.3 |
| D | 10 | 189 | 421 | 6.32 | 159 | 145 | 43.7 |
| D | 4 | 160 | 413 | 6.14 | 159 | 145 | 43.7 |
| D | 6 | 231 | 408 | 6.02 | 159 | 145 | 43.7 |
Histogram calculated using DETX and DETY for each event in the final _common_clean file
| Quadrant A |  |
 |
Quadrant B |
|---|---|---|---|
| Quadrant D | 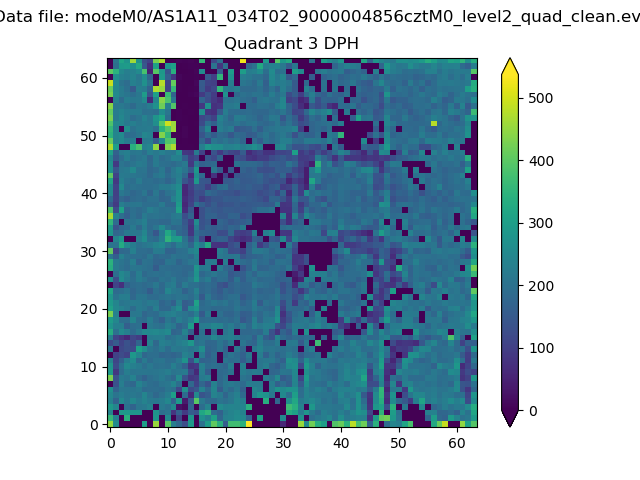 |
 |
Quadrant C |
| Plot type | Count rate plots | Images |
|---|---|---|
| Comparison with Poisson distribution Blue bars denote a histogram of data divided into 1 sec bins. Red curve is a Poisson curve with rate = median count rate of data. |
 |
 |
| Quadrant-wise count rates Data is divided into 100 sec bins |
 |
|
| Module-wise count rates for Quadrant A Data is divided into 100 sec bins |
 |
 |
| Module-wise count rates for Quadrant B Data is divided into 100 sec bins |
 |
 |
| Module-wise count rates for Quadrant C Data is divided into 100 sec bins |
 |
 |
| Module-wise count rates for Quadrant D Data is divided into 100 sec bins |
 |
 |
| Parameter | Plot |
|---|---|
| CZT HV Monitor |  |
| D_VDD |  |
| Temperature 1 |  |
| Veto HV Monitor |  |
| Veto LLD |  |
| Alpha Counter |  |
| _CPM_Rate |  |
| CZT Counter |  |
| +2.5 Volts monitor |  |
| +5 Volts monitor |  |
| _ROLL_ROT |  |
| _Roll_DEC |  |
| _Roll_RA |  |
| Veto Counter |  |