| Param | Original file | Final file |
|---|---|---|
| Filename | modeM0/AS1A11_034T02_9000004856_33963cztM0_level2.evt | modeM0/AS1A11_034T02_9000004856_33963cztM0_level2_quad_clean.evt |
| Size (bytes) | 267,073,920 | 27,463,680 |
| Size | 254.7 MB | 26.2 MB |
| Events in quadrant A | 1,903,923 | 160,945 |
| Events in quadrant B | 1,944,030 | 160,976 |
| Events in quadrant C | 1,580,750 | 160,190 |
| Events in quadrant D | 2,468,715 | 149,192 |
| Mode M9 | |||
|---|---|---|---|
| Quadrant | BADHDUFLAG | Total packets | Discarded packets |
| A | 0 | 14 | 0 |
| B | 0 | 14 | 0 |
| C | 0 | 14 | 0 |
| D | 0 | 14 | 0 |
| Mode SS | |||
|---|---|---|---|
| Quadrant | BADHDUFLAG | Total packets | Discarded packets |
| A | 0 | 60 | 0 |
| B | 0 | 60 | 0 |
| C | 0 | 60 | 0 |
| D | 0 | 60 | 0 |
| Mode M0 | |||
|---|---|---|---|
| Quadrant | BADHDUFLAG | Total packets | Discarded packets |
| A | 0 | 7471 | 2 |
| B | 0 | 7571 | 1 |
| C | 0 | 6228 | 1 |
| D | 0 | 9226 | 1 |
| Quadrant | Total seconds | Saturated seconds | Saturation percentage |
|---|---|---|---|
| A | 2786 | 60 | 2.153625% |
| B | 2786 | 141 | 5.061019% |
| C | 2786 | 45 | 1.615219% |
| D | 2786 | 228 | 8.183776% |
Noise dominated data is calculated using 1-second bins in cleaned event files. If a bin has >2000 counts, and if more than 50% of those come from <1% of pixels, then it is considered to be noise-dominated and hence unusable.
| Quadrant | # 1 sec bins | Bins with >0 counts | Bins with >2000 counts | High rate bins dominated by noise | Noise dominated (total time) | Noise dominated (detector-on time) | Marked lightcurve |
|---|---|---|---|---|---|---|---|
| A | 4249 | 2787 | 20 | 20 | 0.47% | 0.72% | 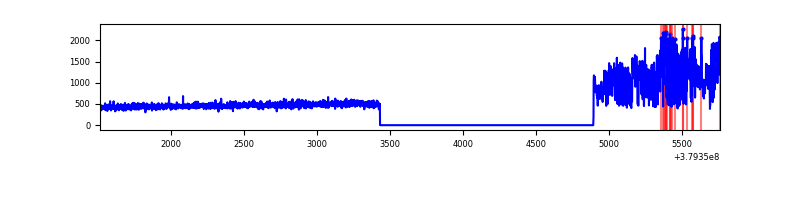 |
| B | 4249 | 2787 | 75 | 75 | 1.77% | 2.69% | 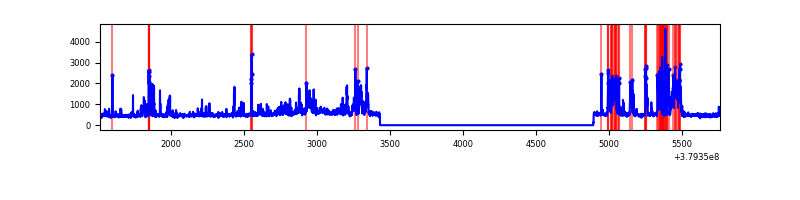 |
| C | 4249 | 2787 | 35 | 35 | 0.82% | 1.26% | 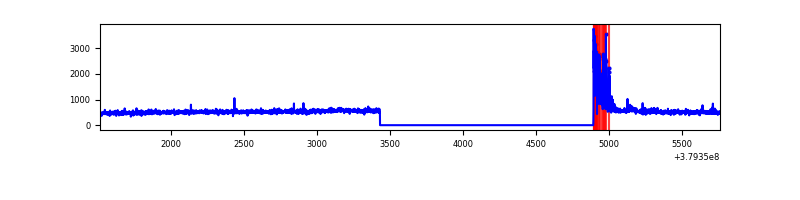 |
| D | 4249 | 2787 | 168 | 168 | 3.95% | 6.03% | 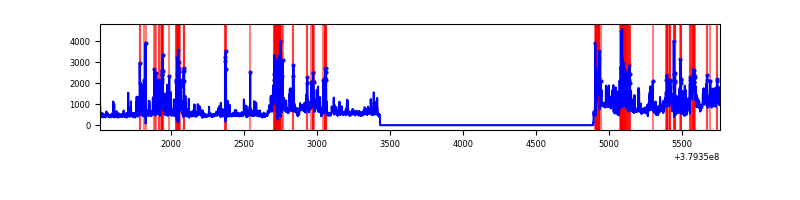 |
Top three noisy pixels from each quadrant. If the there are fewer than three noisy pixels in the level2.evt file, extra rows are filled as -1
| Pixel properties | Quadrant properties | ||||||
|---|---|---|---|---|---|---|---|
| Quadrant | DetID | PixID | Counts | Sigma | Mean | Median | Sigma |
| A | 15 | 169 | 596661 | 8730.28 | 334 | 327 | 68.3 |
| A | 13 | 6 | 9984 | 141.38 | 334 | 327 | 68.3 |
| A | 10 | 83 | 7752 | 108.7 | 334 | 327 | 68.3 |
| B | 5 | 172 | 421905 | 6422.07 | 331 | 324 | 65.6 |
| B | 4 | 251 | 178157 | 2708.98 | 331 | 324 | 65.6 |
| B | 3 | 112 | 15855 | 236.59 | 331 | 324 | 65.6 |
| C | 0 | 10 | 141975 | 1854.77 | 326 | 329 | 76.4 |
| C | 15 | 214 | 120567 | 1574.45 | 326 | 329 | 76.4 |
| C | 3 | 233 | 30860 | 399.79 | 326 | 329 | 76.4 |
| D | 13 | 249 | 285540 | 3570.94 | 315 | 306 | 79.9 |
| D | 2 | 250 | 256895 | 3212.33 | 315 | 306 | 79.9 |
| D | 8 | 195 | 252859 | 3161.8 | 315 | 306 | 79.9 |
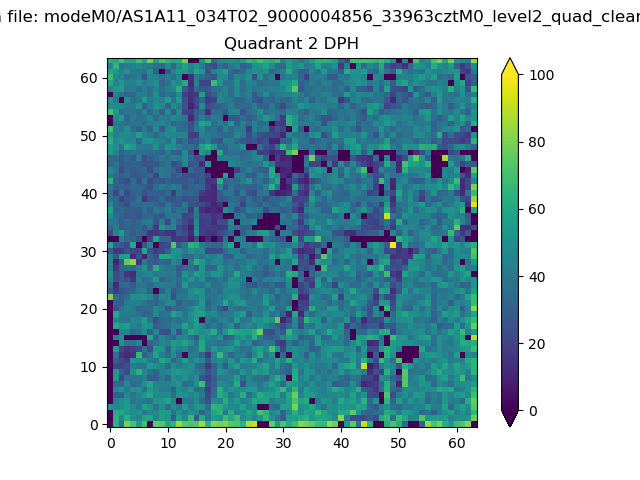
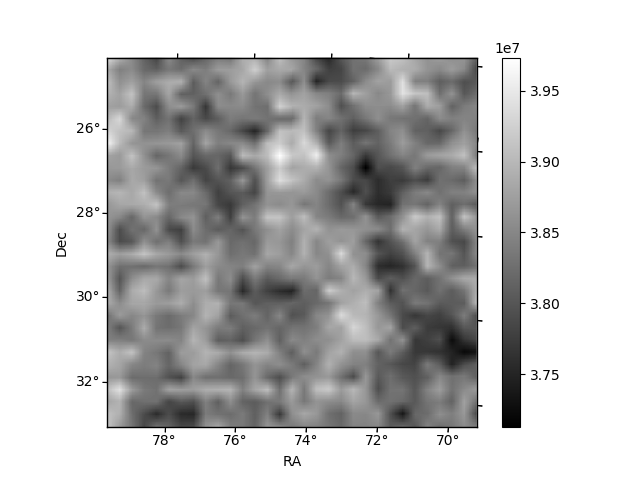
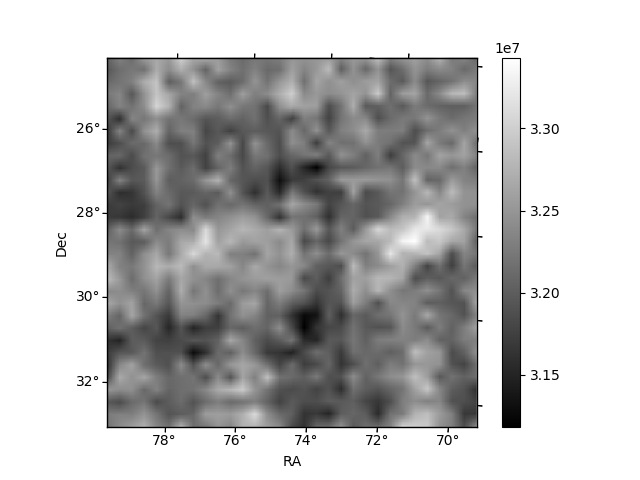
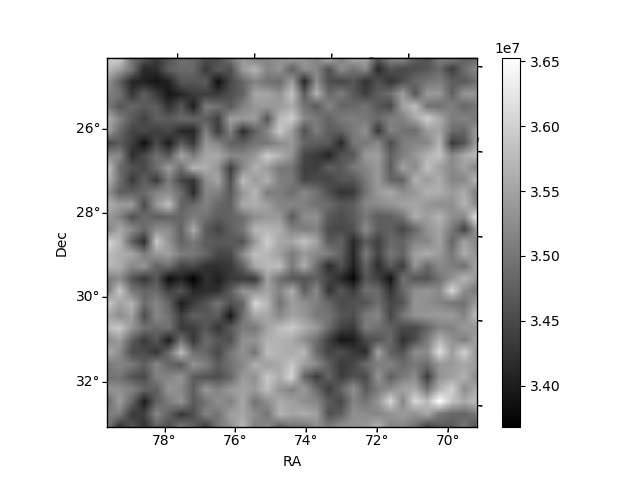
Histogram calculated using DETX and DETY for each event in the final _common_clean file
| Quadrant A | 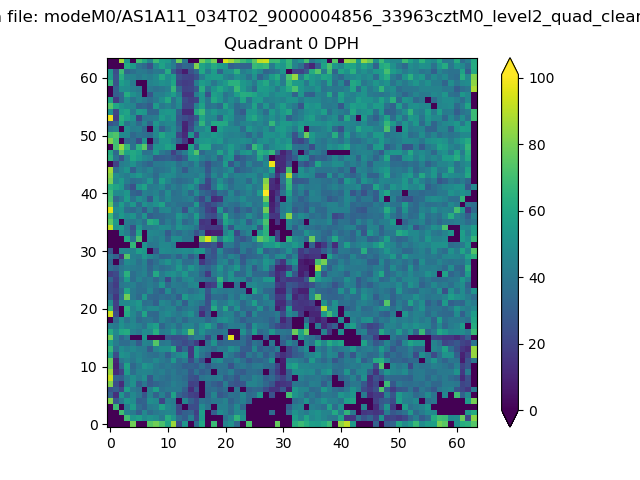 |
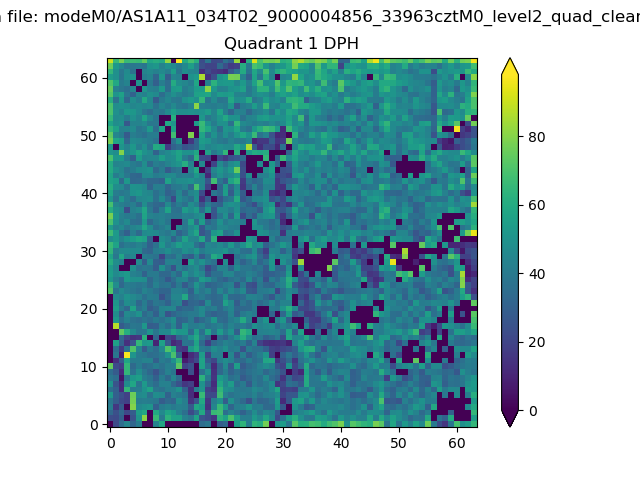 |
Quadrant B |
|---|---|---|---|
| Quadrant D | 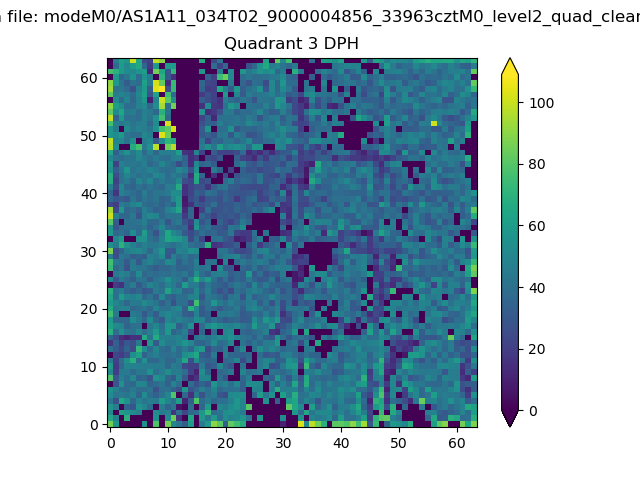 |
 |
Quadrant C |
| Plot type | Count rate plots | Images |
|---|---|---|
| Comparison with Poisson distribution Blue bars denote a histogram of data divided into 1 sec bins. Red curve is a Poisson curve with rate = median count rate of data. |
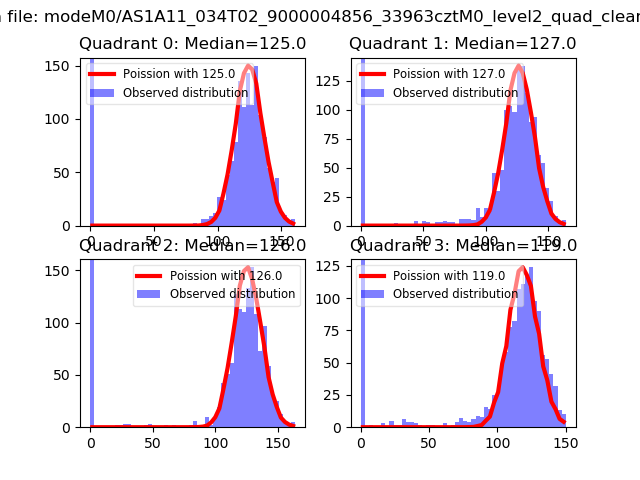 |
 |
| Quadrant-wise count rates Data is divided into 100 sec bins |
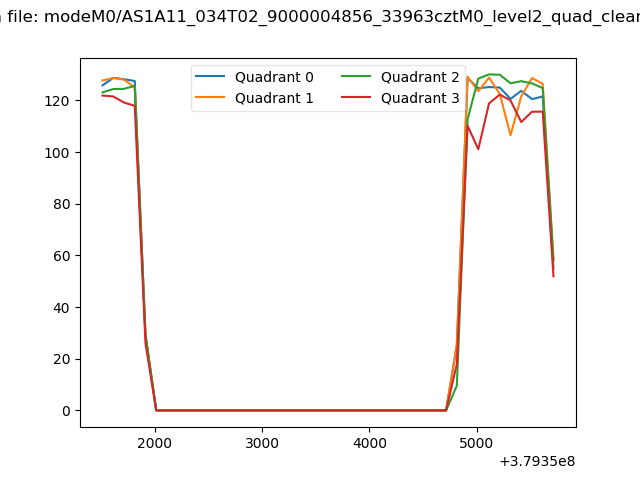 |
|
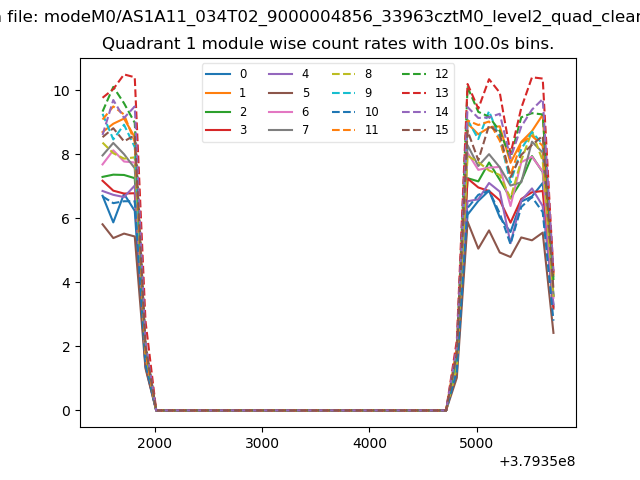
| Module-wise count rates for Quadrant A Data is divided into 100 sec bins |
 |
 |
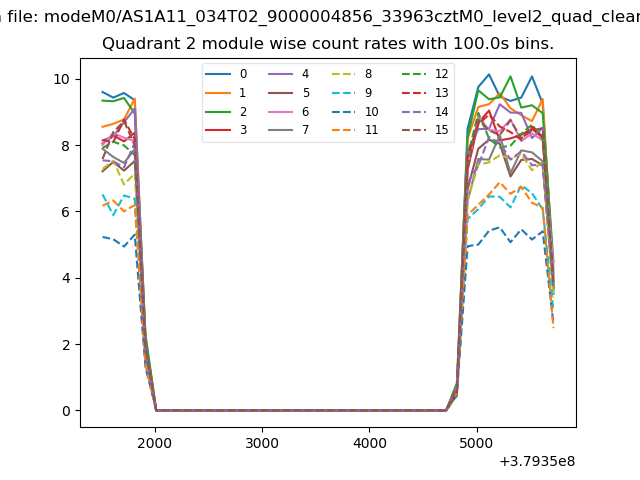
| Module-wise count rates for Quadrant B Data is divided into 100 sec bins |
 |
 |
| Module-wise count rates for Quadrant C Data is divided into 100 sec bins |
 |
 |
| Module-wise count rates for Quadrant D Data is divided into 100 sec bins |
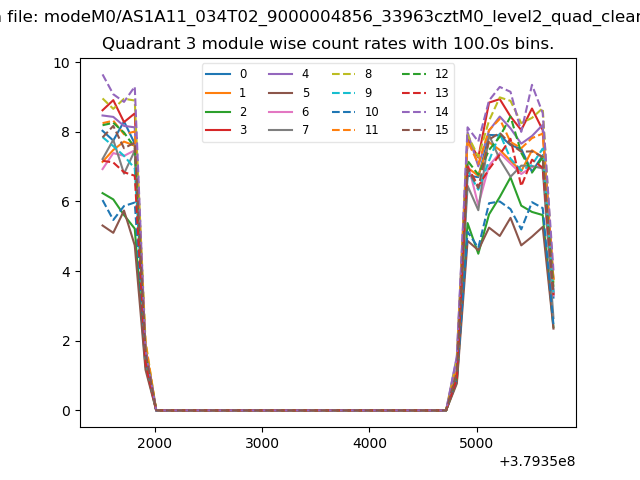 |
 |
| Parameter | Plot |
|---|---|
| CZT HV Monitor | 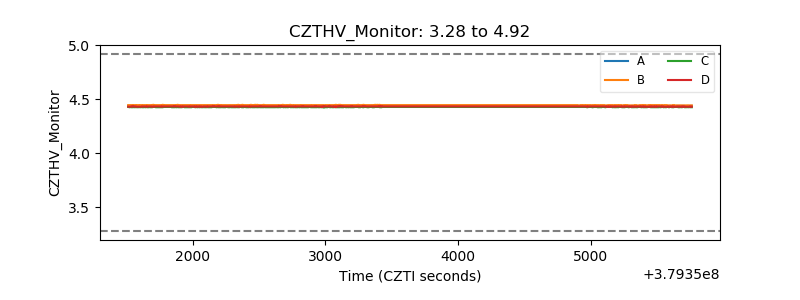 |
| D_VDD | 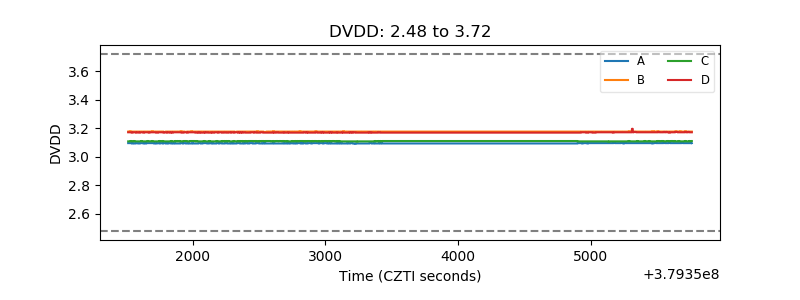 |
| Temperature 1 |  |
| Veto HV Monitor | 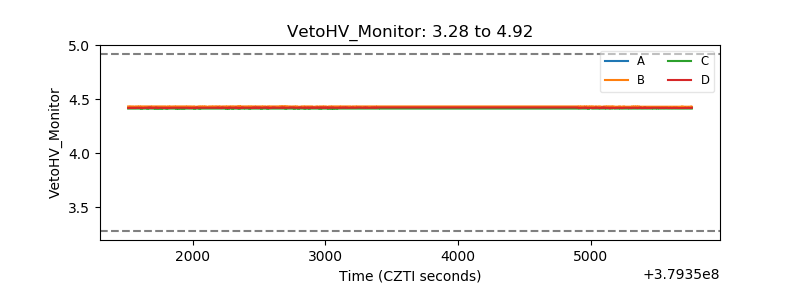 |
| Veto LLD | 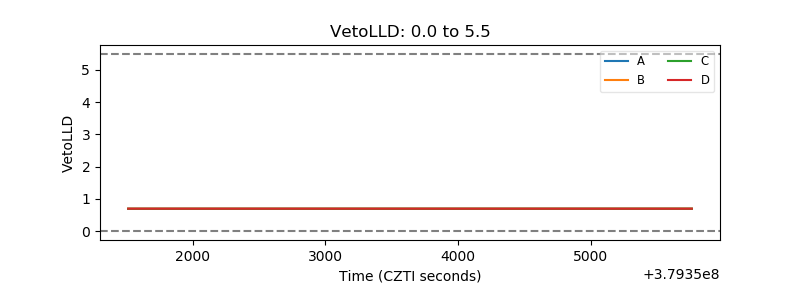 |
| Alpha Counter | 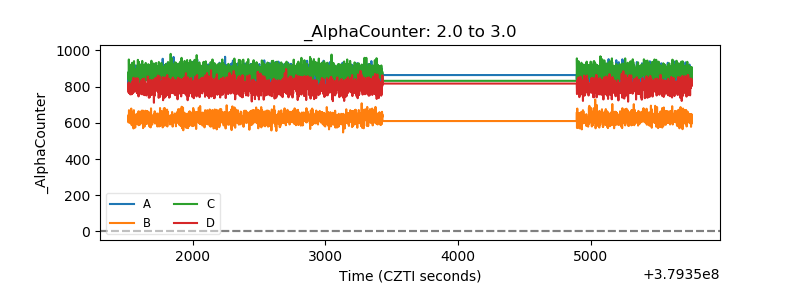 |
| _CPM_Rate | 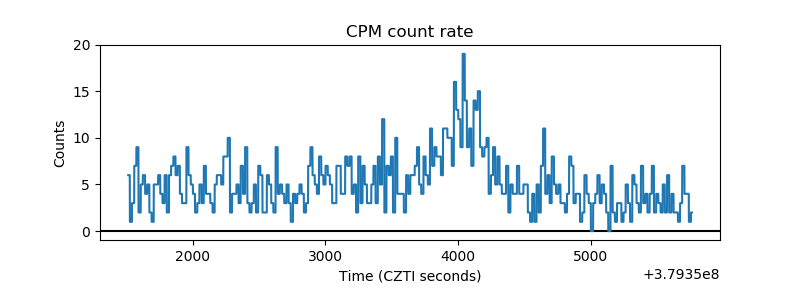 |
| CZT Counter | 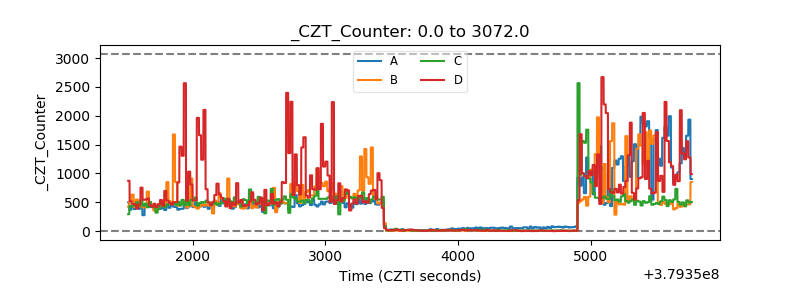 |
| +2.5 Volts monitor |  |
| +5 Volts monitor |  |
| _ROLL_ROT |  |
| _Roll_DEC |  |
| _Roll_RA | 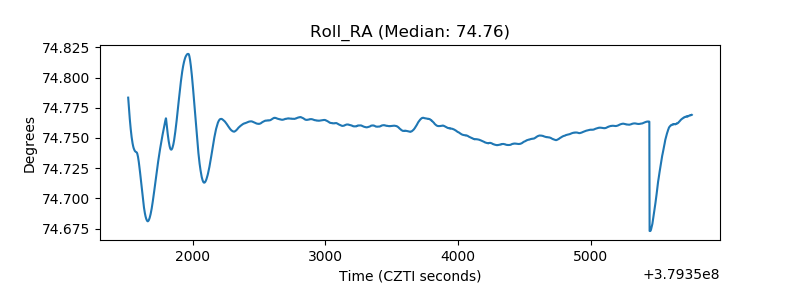 |
| Veto Counter |  |