| Param | Original file | Final file |
|---|---|---|
| Filename | modeM0/AS1A11_034T02_9000004856_33964cztM0_level2.evt | modeM0/AS1A11_034T02_9000004856_33964cztM0_level2_quad_clean.evt |
| Size (bytes) | 542,626,560 | 75,631,680 |
| Size | 517.5 MB | 72.1 MB |
| Events in quadrant A | 3,533,921 | 478,539 |
| Events in quadrant B | 3,417,178 | 480,485 |
| Events in quadrant C | 3,404,839 | 470,425 |
| Events in quadrant D | 5,666,582 | 436,787 |
| Mode M9 | |||
|---|---|---|---|
| Quadrant | BADHDUFLAG | Total packets | Discarded packets |
| A | 0 | 27 | 0 |
| B | 0 | 27 | 0 |
| C | 0 | 27 | 0 |
| D | 0 | 27 | 0 |
| Mode SS | |||
|---|---|---|---|
| Quadrant | BADHDUFLAG | Total packets | Discarded packets |
| A | 0 | 128 | 0 |
| B | 0 | 128 | 0 |
| C | 0 | 128 | 0 |
| D | 0 | 128 | 0 |
| Mode M0 | |||
|---|---|---|---|
| Quadrant | BADHDUFLAG | Total packets | Discarded packets |
| A | 0 | 14565 | 3 |
| B | 0 | 13912 | 2 |
| C | 0 | 13833 | 2 |
| D | 0 | 21087 | 2 |
| Quadrant | Total seconds | Saturated seconds | Saturation percentage |
|---|---|---|---|
| A | 6060 | 83 | 1.369637% |
| B | 6060 | 134 | 2.211221% |
| C | 6060 | 73 | 1.204620% |
| D | 6060 | 447 | 7.376238% |
Noise dominated data is calculated using 1-second bins in cleaned event files. If a bin has >2000 counts, and if more than 50% of those come from <1% of pixels, then it is considered to be noise-dominated and hence unusable.
| Quadrant | # 1 sec bins | Bins with >0 counts | Bins with >2000 counts | High rate bins dominated by noise | Noise dominated (total time) | Noise dominated (detector-on time) | Marked lightcurve |
|---|---|---|---|---|---|---|---|
| A | 8836 | 6062 | 29 | 29 | 0.33% | 0.48% | 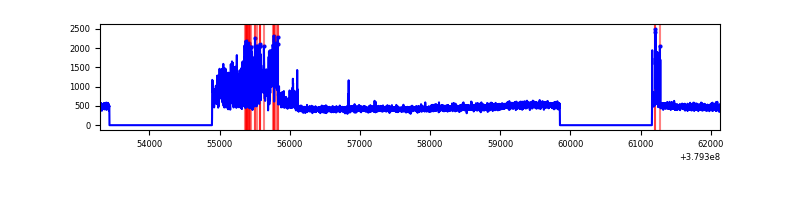 |
| B | 8836 | 6062 | 70 | 70 | 0.79% | 1.15% | 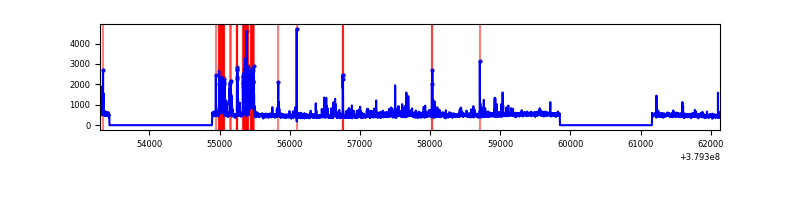 |
| C | 8836 | 6062 | 61 | 61 | 0.69% | 1.01% | 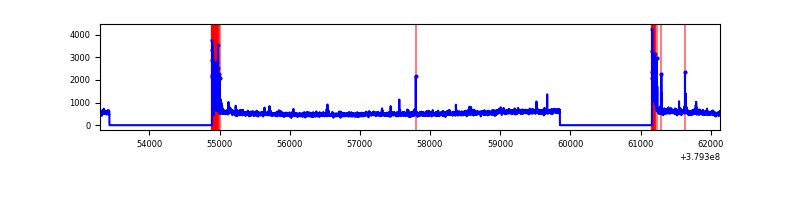 |
| D | 8836 | 6062 | 351 | 351 | 3.97% | 5.79% | 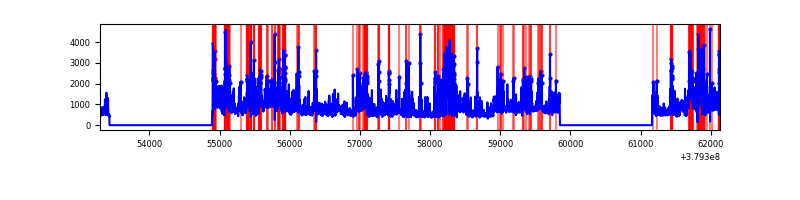 |
Top three noisy pixels from each quadrant. If the there are fewer than three noisy pixels in the level2.evt file, extra rows are filled as -1
| Pixel properties | Quadrant properties | ||||||
|---|---|---|---|---|---|---|---|
| Quadrant | DetID | PixID | Counts | Sigma | Mean | Median | Sigma |
| A | 15 | 169 | 770174 | 5398.42 | 706 | 692 | 142.5 |
| A | 13 | 6 | 20431 | 138.48 | 706 | 692 | 142.5 |
| A | 10 | 83 | 16036 | 107.65 | 706 | 692 | 142.5 |
| B | 5 | 172 | 427087 | 3170.77 | 702 | 683 | 134.5 |
| B | 0 | 190 | 66756 | 491.32 | 702 | 683 | 134.5 |
| B | 0 | 229 | 36175 | 263.92 | 702 | 683 | 134.5 |
| C | 15 | 214 | 263286 | 1656.87 | 686 | 694 | 158.5 |
| C | 0 | 10 | 226716 | 1426.13 | 686 | 694 | 158.5 |
| C | 3 | 233 | 186524 | 1172.53 | 686 | 694 | 158.5 |
| D | 8 | 195 | 831146 | 4983.57 | 672 | 653 | 166.6 |
| D | 12 | 233 | 545989 | 3272.42 | 672 | 653 | 166.6 |
| D | 13 | 249 | 521330 | 3124.45 | 672 | 653 | 166.6 |
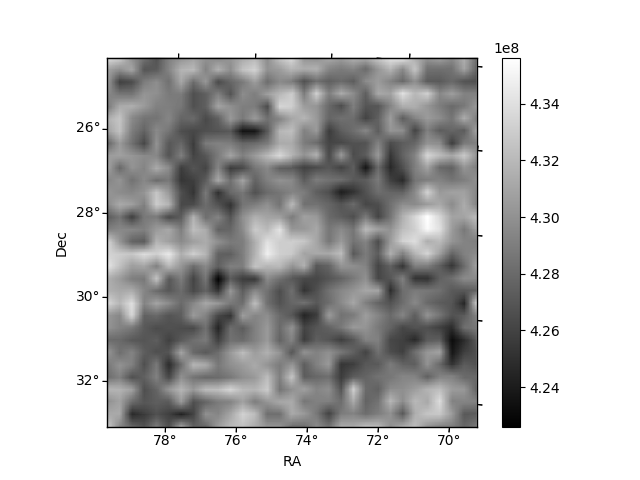
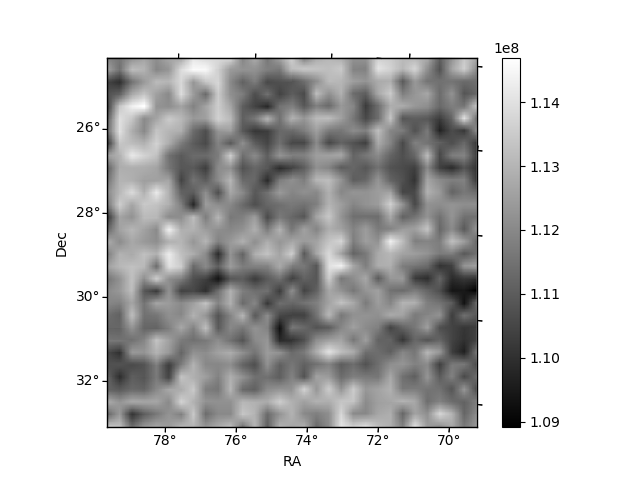
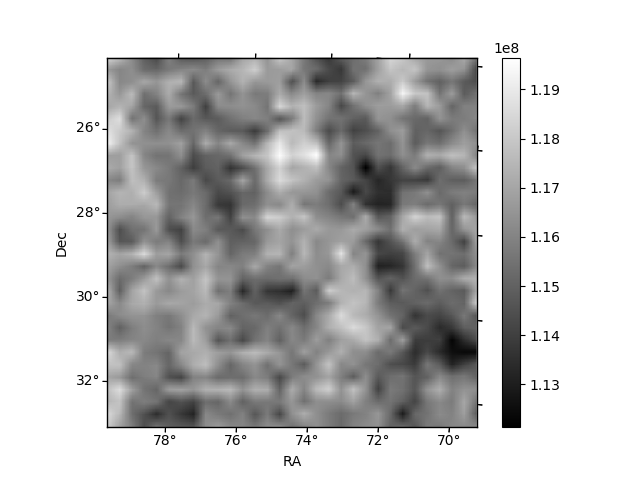
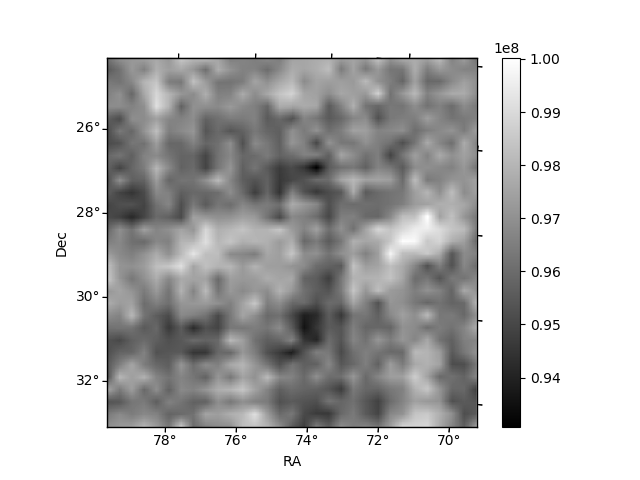
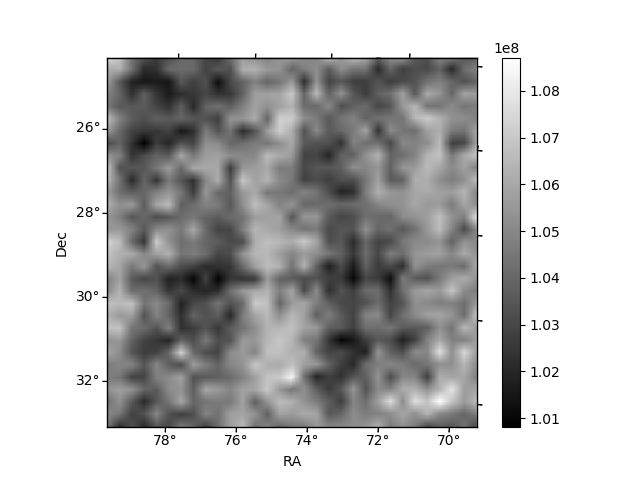
Histogram calculated using DETX and DETY for each event in the final _common_clean file
| Quadrant A | 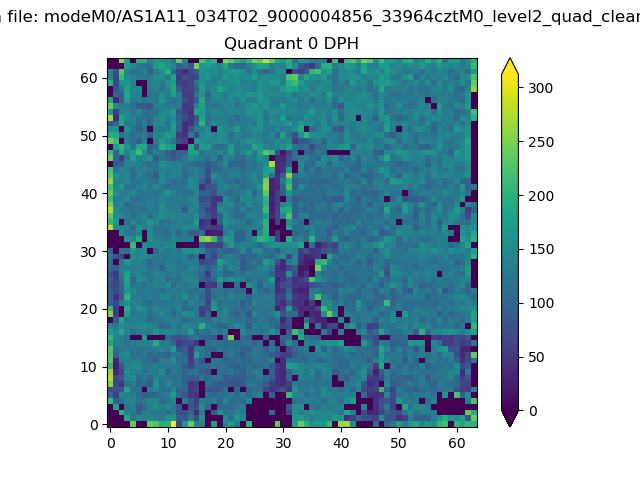 |
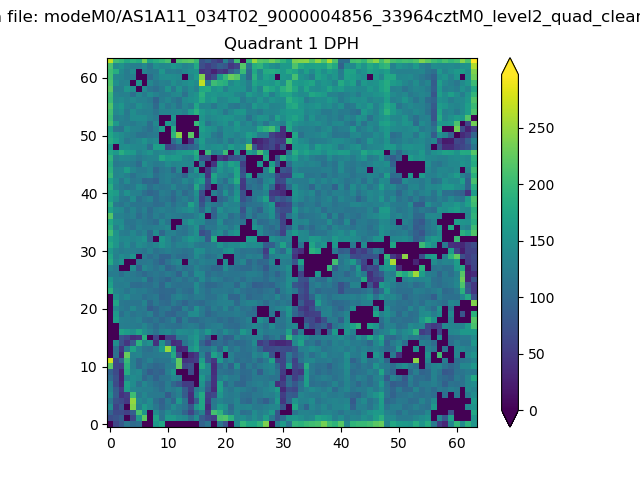 |
Quadrant B |
|---|---|---|---|
| Quadrant D | 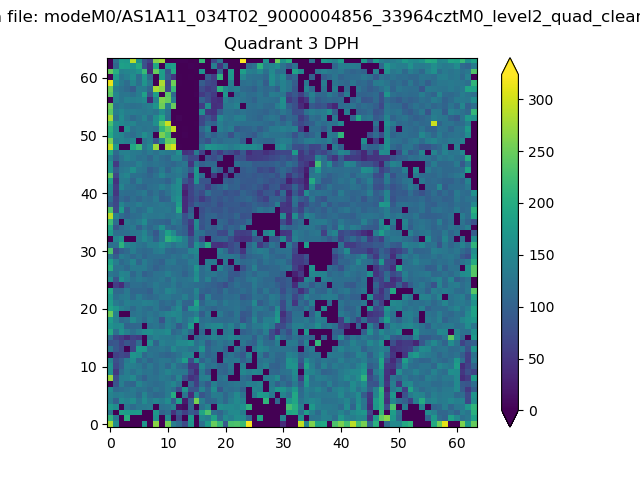 |
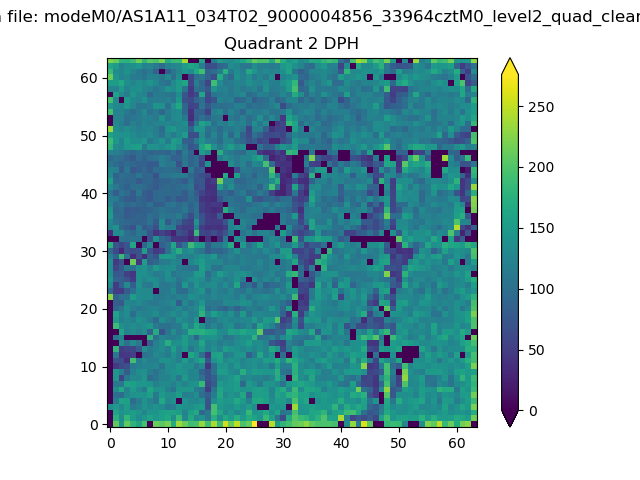 |
Quadrant C |
| Plot type | Count rate plots | Images |
|---|---|---|
| Comparison with Poisson distribution Blue bars denote a histogram of data divided into 1 sec bins. Red curve is a Poisson curve with rate = median count rate of data. |
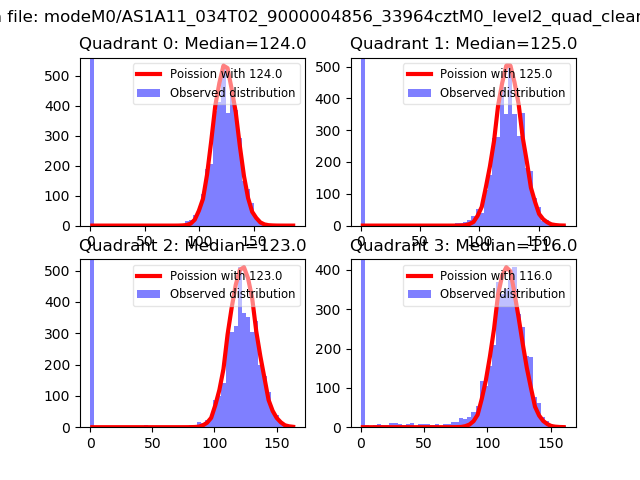 |
 |
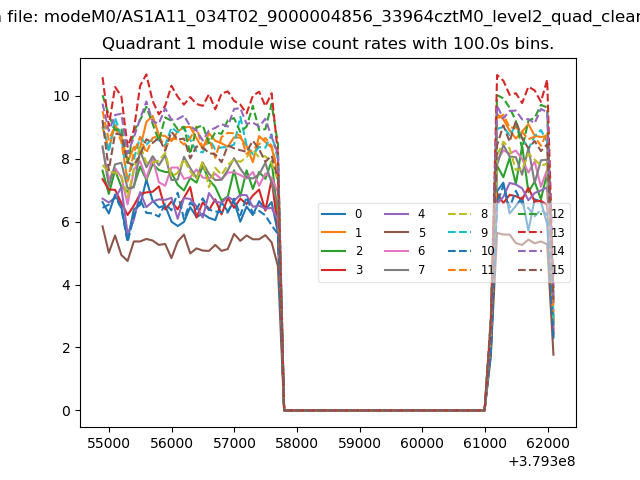
| Quadrant-wise count rates Data is divided into 100 sec bins |
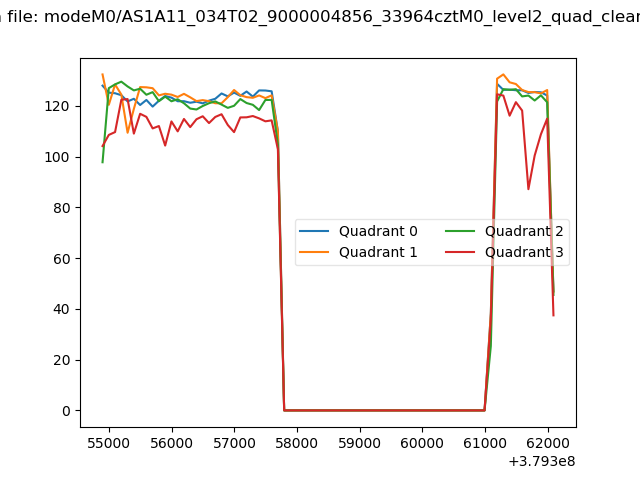 |
|
| Module-wise count rates for Quadrant A Data is divided into 100 sec bins |
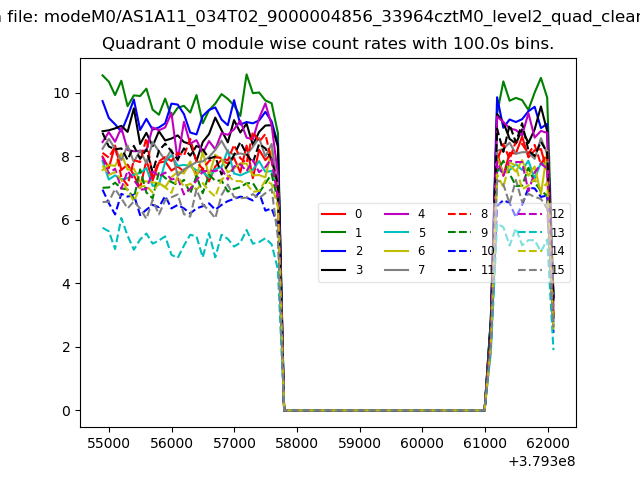 |
 |
| Module-wise count rates for Quadrant B Data is divided into 100 sec bins |
 |
 |
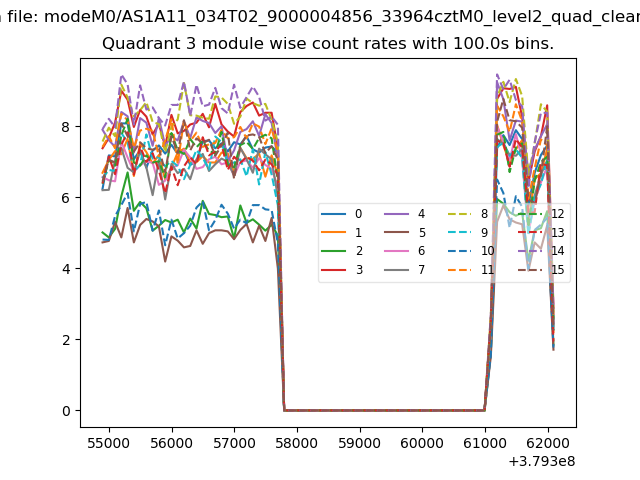
| Module-wise count rates for Quadrant C Data is divided into 100 sec bins |
 |
 |
| Module-wise count rates for Quadrant D Data is divided into 100 sec bins |
 |
 |
| Parameter | Plot |
|---|---|
| CZT HV Monitor | 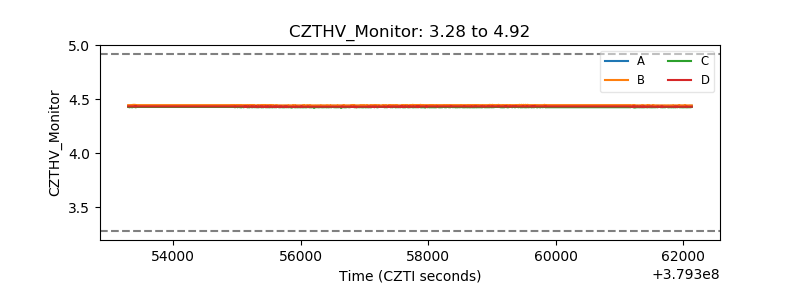 |
| D_VDD | 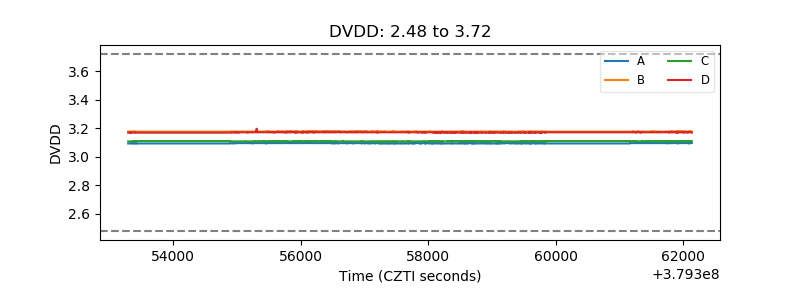 |
| Temperature 1 | 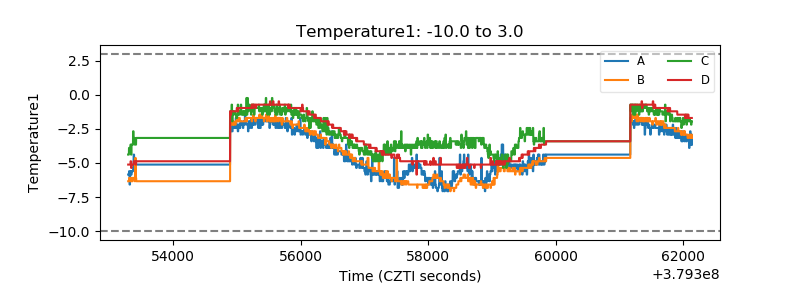 |
| Veto HV Monitor | 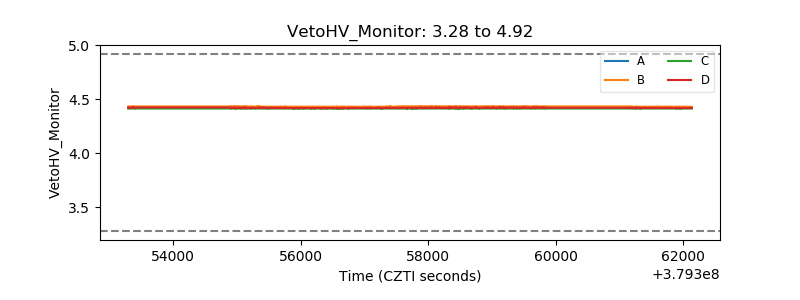 |
| Veto LLD | 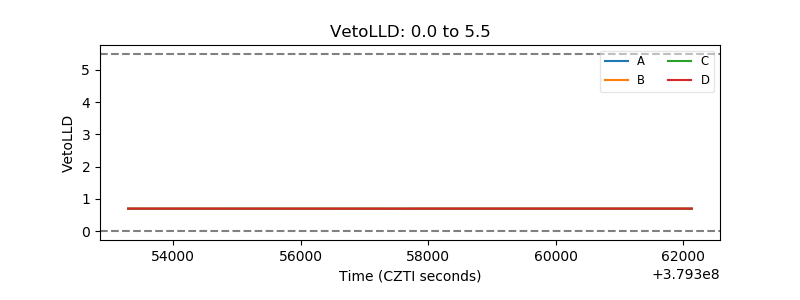 |
| Alpha Counter | 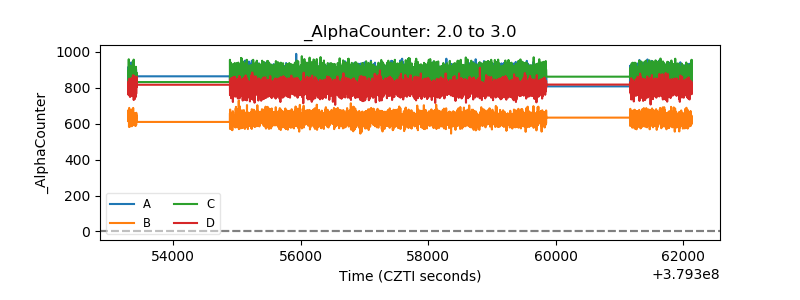 |
| _CPM_Rate | 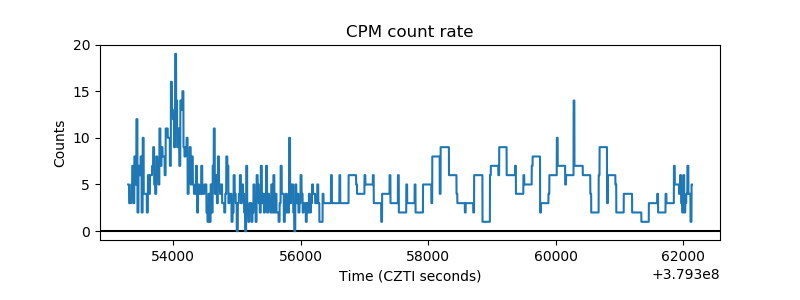 |
| CZT Counter | 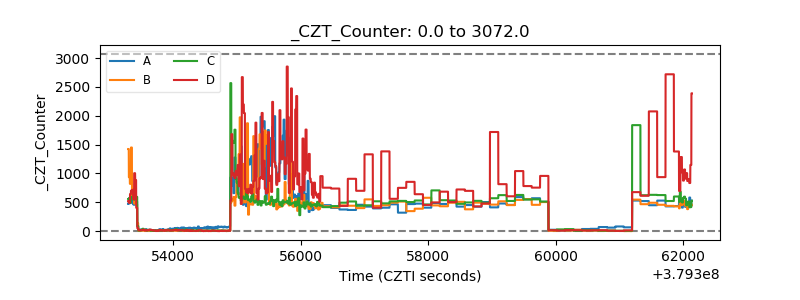 |
| +2.5 Volts monitor |  |
| +5 Volts monitor |  |
| _ROLL_ROT | 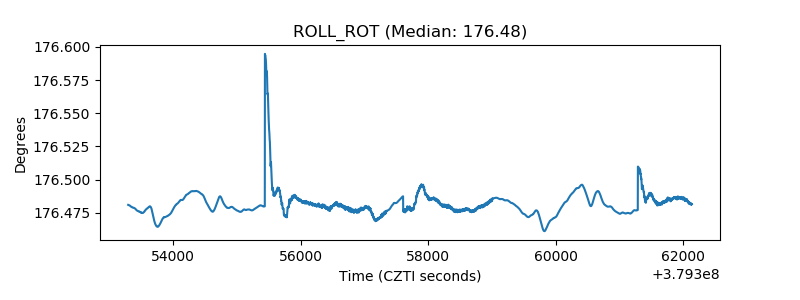 |
| _Roll_DEC | 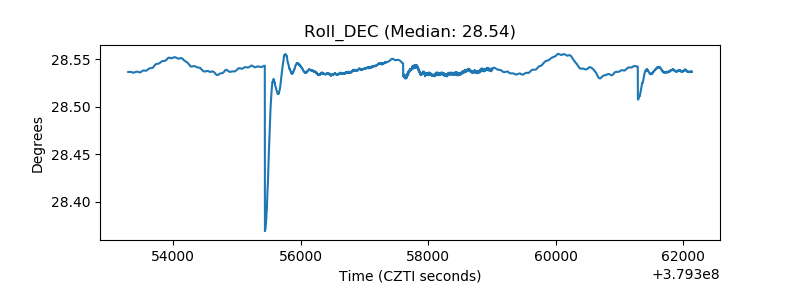 |
| _Roll_RA | 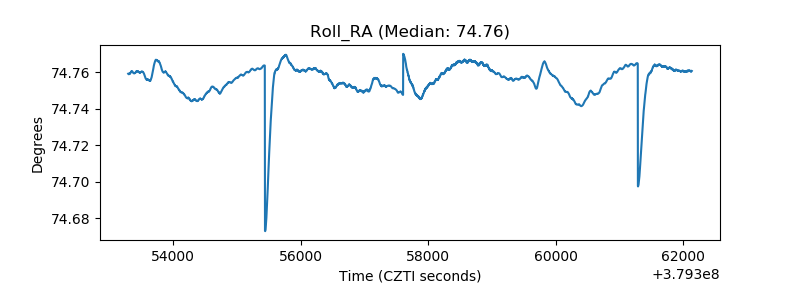 |
| Veto Counter | 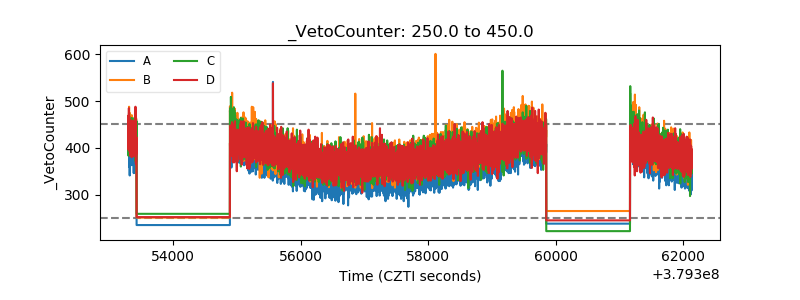 |