| Param | Original file | Final file |
|---|---|---|
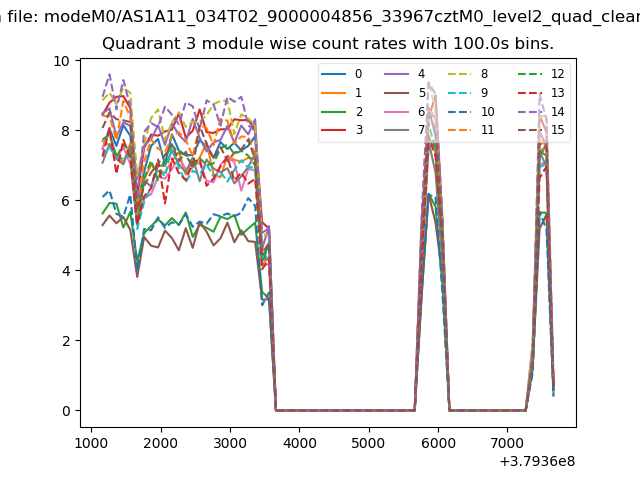
| Filename | modeM0/AS1A11_034T02_9000004856_33967cztM0_level2.evt | modeM0/AS1A11_034T02_9000004856_33967cztM0_level2_quad_clean.evt |
| Size (bytes) | 452,036,160 | 60,166,080 |
| Size | 431.1 MB | 57.4 MB |
| Events in quadrant A | 2,473,156 | 376,222 |
| Events in quadrant B | 2,931,094 | 376,292 |
| Events in quadrant C | 3,019,251 | 365,973 |
| Events in quadrant D | 4,914,176 | 339,361 |
| Mode M9 | |||
|---|---|---|---|
| Quadrant | BADHDUFLAG | Total packets | Discarded packets |
| A | 0 | 24 | 0 |
| B | 0 | 24 | 0 |
| C | 0 | 24 | 0 |
| D | 0 | 25 | 0 |
| Mode SS | |||
|---|---|---|---|
| Quadrant | BADHDUFLAG | Total packets | Discarded packets |
| A | 0 | 104 | 0 |
| B | 0 | 104 | 0 |
| C | 0 | 104 | 0 |
| D | 0 | 104 | 0 |
| Mode M0 | |||
|---|---|---|---|
| Quadrant | BADHDUFLAG | Total packets | Discarded packets |
| A | 0 | 10808 | 2 |
| B | 0 | 12033 | 2 |
| C | 0 | 12115 | 2 |
| D | 0 | 18292 | 2 |
| Quadrant | Total seconds | Saturated seconds | Saturation percentage |
|---|---|---|---|
| A | 5197 | 20 | 0.384837% |
| B | 5197 | 112 | 2.155089% |
| C | 5197 | 68 | 1.308447% |
| D | 5197 | 364 | 7.004041% |
Noise dominated data is calculated using 1-second bins in cleaned event files. If a bin has >2000 counts, and if more than 50% of those come from <1% of pixels, then it is considered to be noise-dominated and hence unusable.
| Quadrant | # 1 sec bins | Bins with >0 counts | Bins with >2000 counts | High rate bins dominated by noise | Noise dominated (total time) | Noise dominated (detector-on time) | Marked lightcurve |
|---|---|---|---|---|---|---|---|
| A | 6510 | 5198 | 3 | 3 | 0.05% | 0.06% | 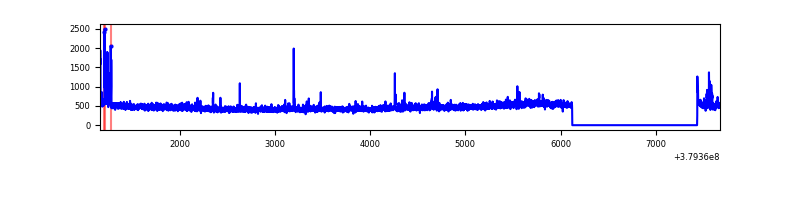 |
| B | 6510 | 5198 | 59 | 59 | 0.91% | 1.14% | 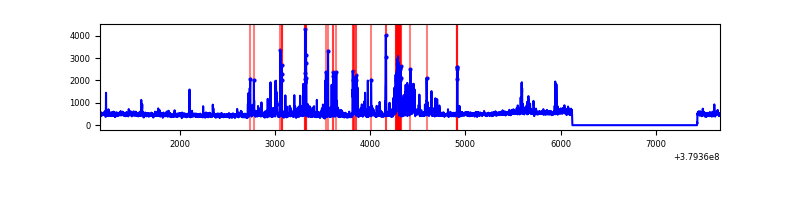 |
| C | 6510 | 5198 | 56 | 56 | 0.86% | 1.08% | 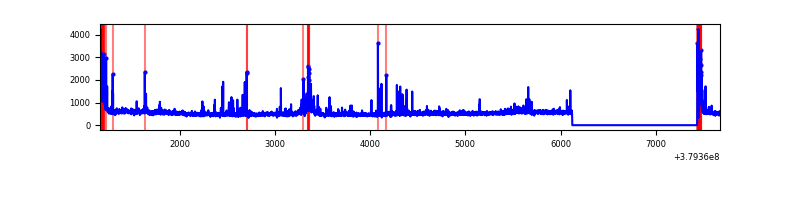 |
| D | 6510 | 5198 | 277 | 277 | 4.25% | 5.33% | 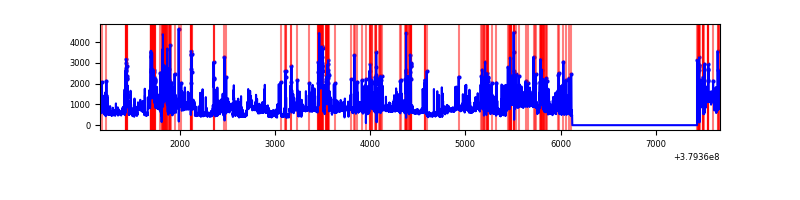 |
Top three noisy pixels from each quadrant. If the there are fewer than three noisy pixels in the level2.evt file, extra rows are filled as -1
| Pixel properties | Quadrant properties | ||||||
|---|---|---|---|---|---|---|---|
| Quadrant | DetID | PixID | Counts | Sigma | Mean | Median | Sigma |
| A | 15 | 169 | 70879 | 571.82 | 605 | 592 | 122.9 |
| A | 14 | 238 | 28947 | 230.68 | 605 | 592 | 122.9 |
| A | 13 | 6 | 16783 | 131.72 | 605 | 592 | 122.9 |
| B | 5 | 172 | 419335 | 3596.37 | 599 | 584 | 116.4 |
| B | 0 | 190 | 39228 | 331.89 | 599 | 584 | 116.4 |
| B | 4 | 251 | 38328 | 324.16 | 599 | 584 | 116.4 |
| C | 0 | 10 | 283503 | 2076.41 | 586 | 590 | 136.3 |
| C | 15 | 214 | 228005 | 1669.09 | 586 | 590 | 136.3 |
| C | 3 | 233 | 121951 | 890.72 | 586 | 590 | 136.3 |
| D | 8 | 195 | 989553 | 6886.27 | 572 | 554 | 143.6 |
| D | 2 | 250 | 466917 | 3247.22 | 572 | 554 | 143.6 |
| D | 7 | 238 | 413625 | 2876.16 | 572 | 554 | 143.6 |
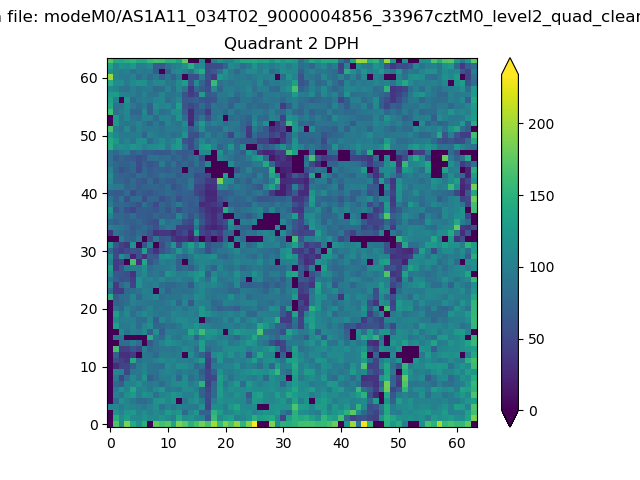
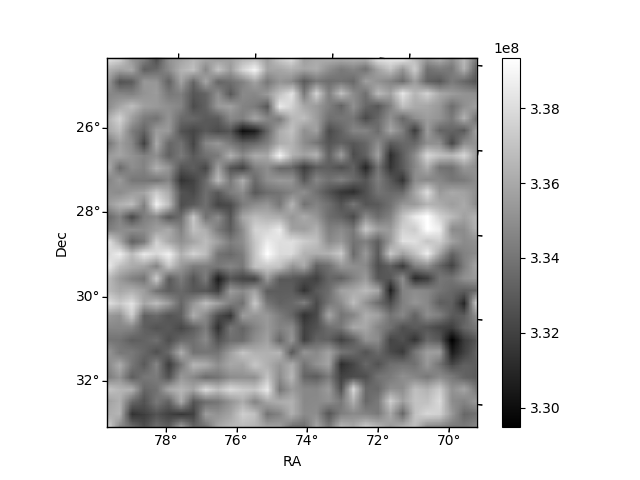
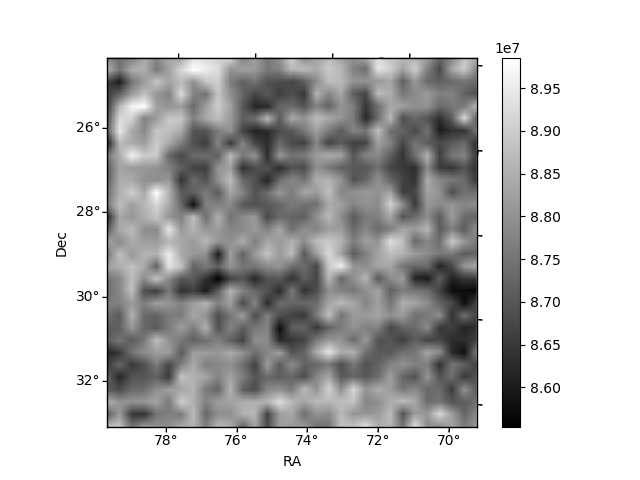
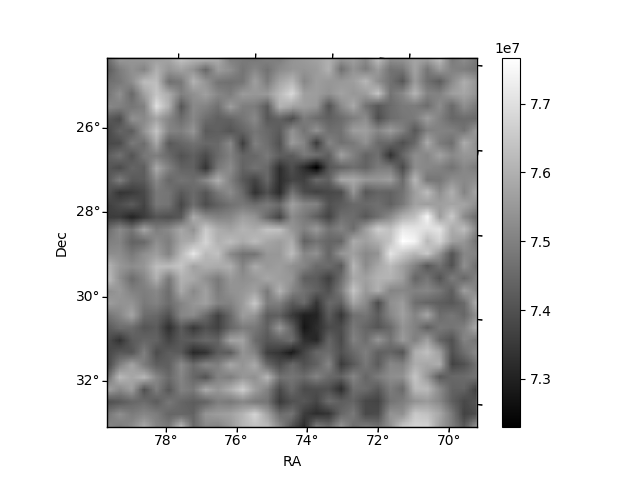
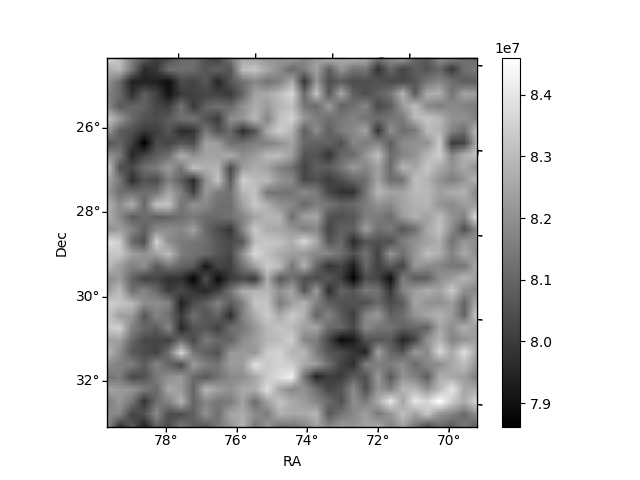
Histogram calculated using DETX and DETY for each event in the final _common_clean file
| Quadrant A | 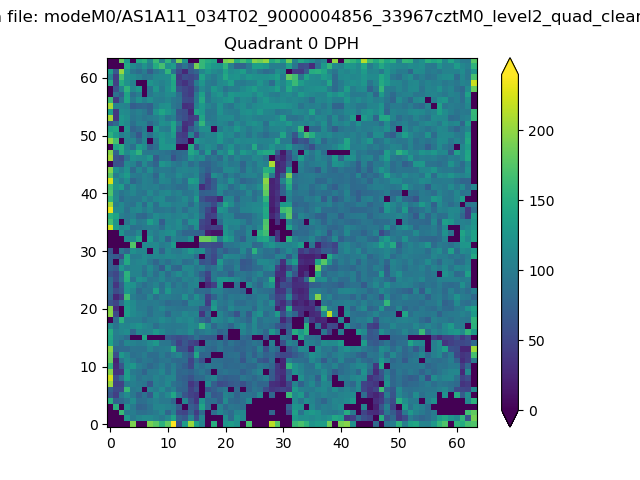 |
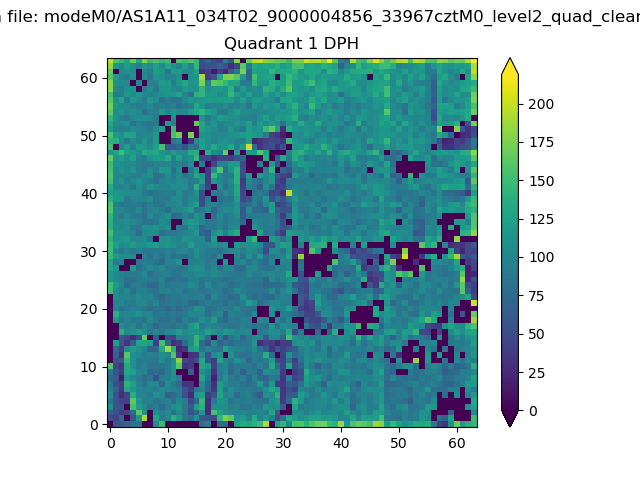 |
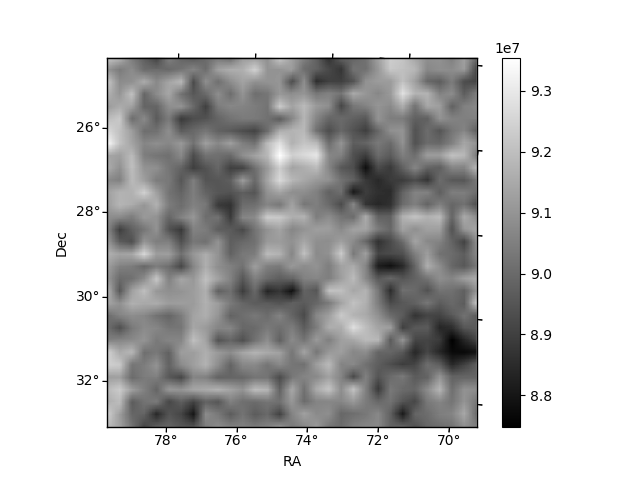
Quadrant B |
|---|---|---|---|
| Quadrant D | 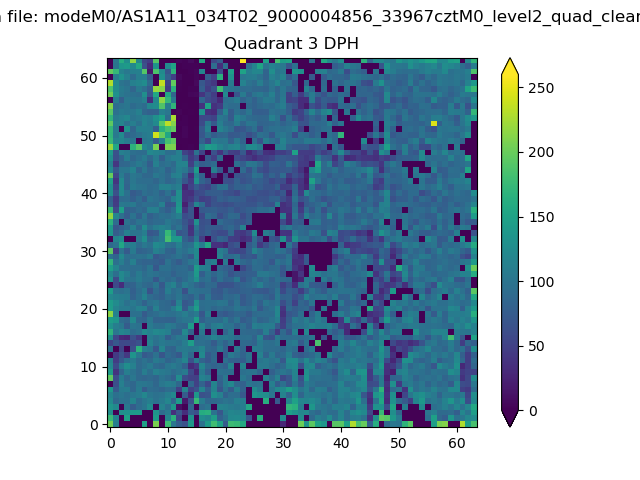 |
 |
Quadrant C |
| Plot type | Count rate plots | Images |
|---|---|---|
| Comparison with Poisson distribution Blue bars denote a histogram of data divided into 1 sec bins. Red curve is a Poisson curve with rate = median count rate of data. |
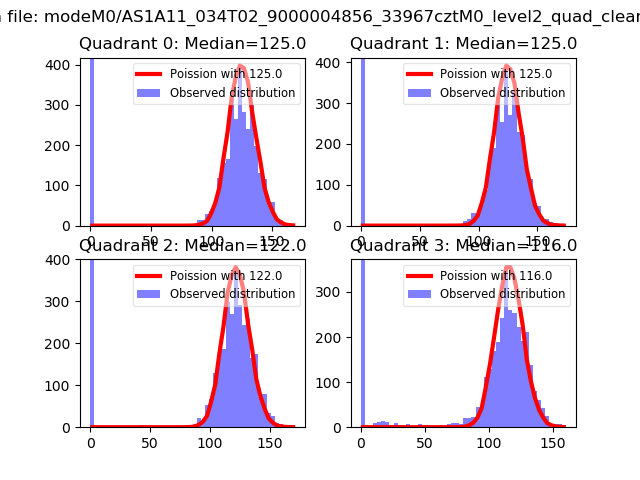 |
 |
| Quadrant-wise count rates Data is divided into 100 sec bins |
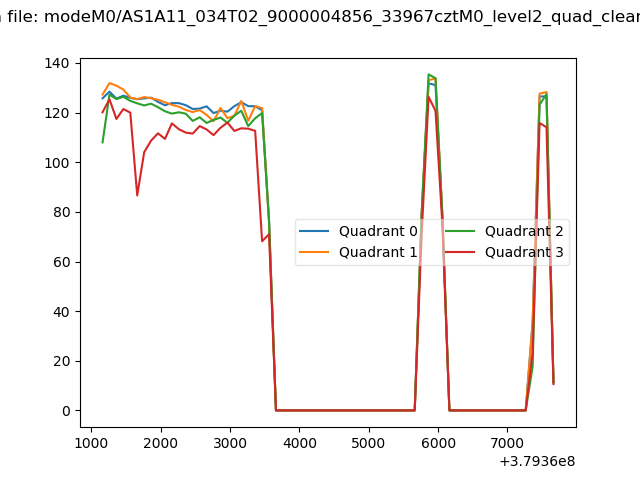 |
|
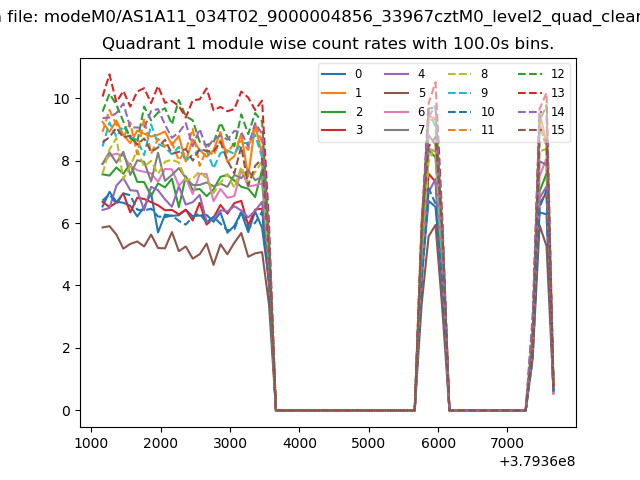
| Module-wise count rates for Quadrant A Data is divided into 100 sec bins |
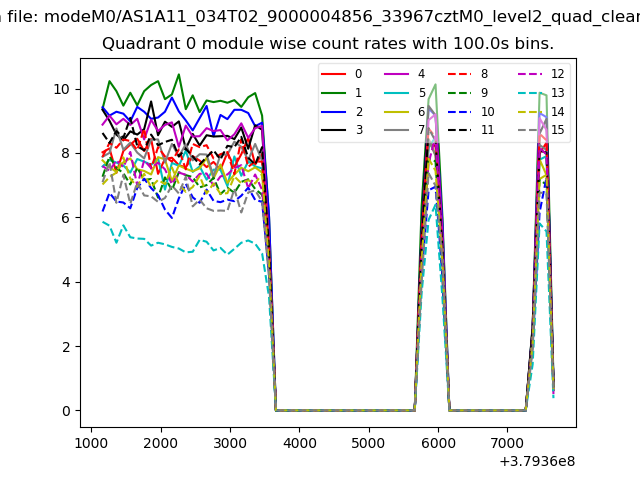 |
 |
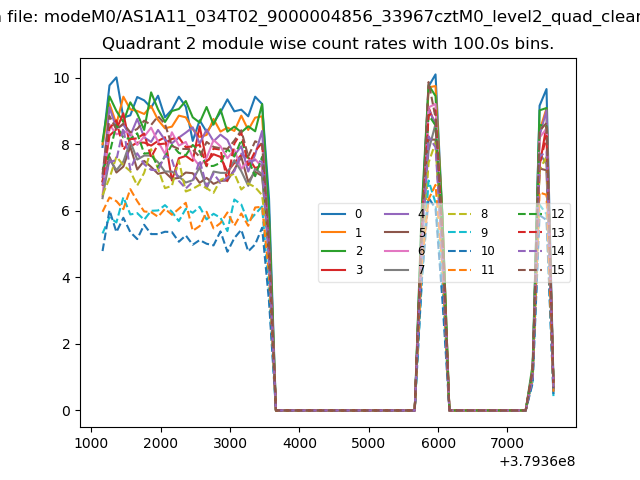
| Module-wise count rates for Quadrant B Data is divided into 100 sec bins |
 |
 |
| Module-wise count rates for Quadrant C Data is divided into 100 sec bins |
 |
 |
| Module-wise count rates for Quadrant D Data is divided into 100 sec bins |
 |
 |
| Parameter | Plot |
|---|---|
| CZT HV Monitor | 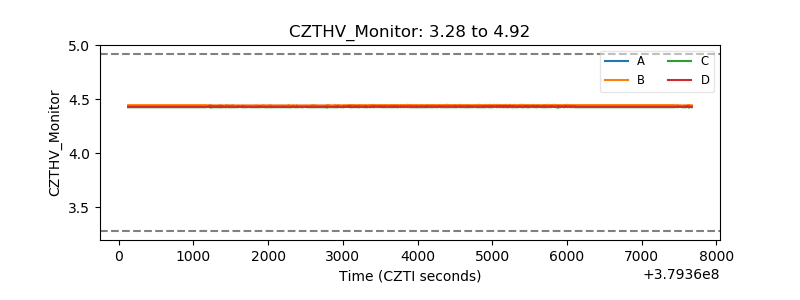 |
| D_VDD | 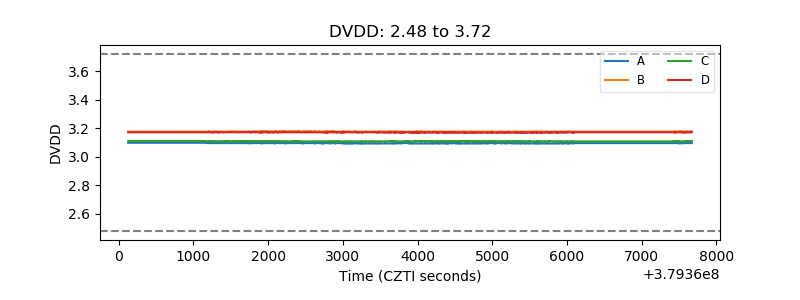 |
| Temperature 1 | 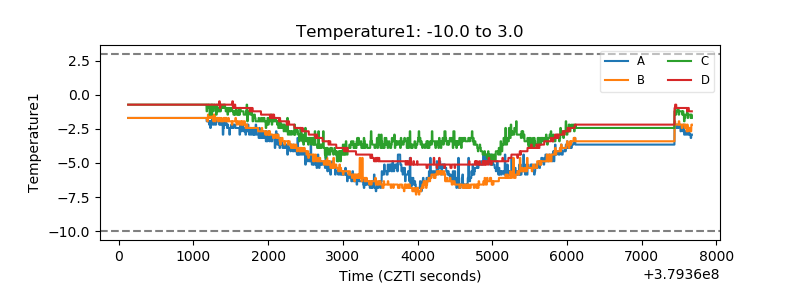 |
| Veto HV Monitor |  |
| Veto LLD | 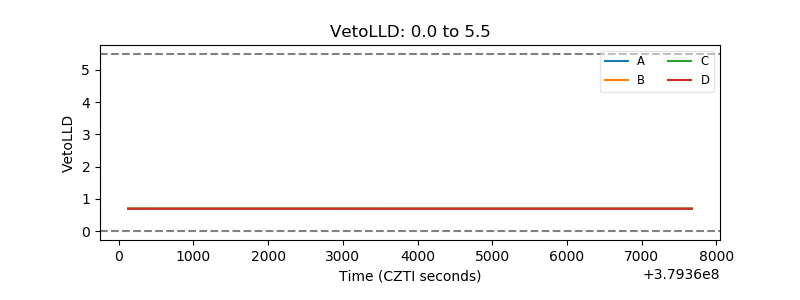 |
| Alpha Counter | 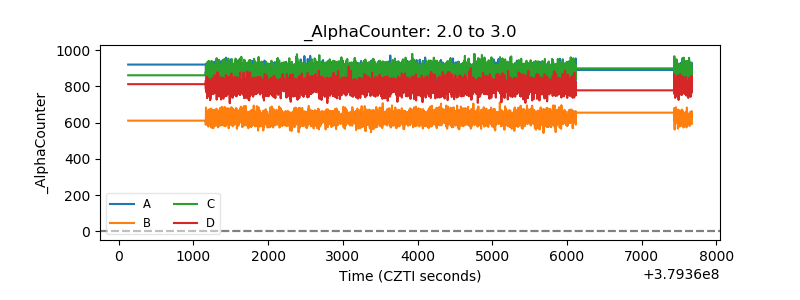 |
| _CPM_Rate | 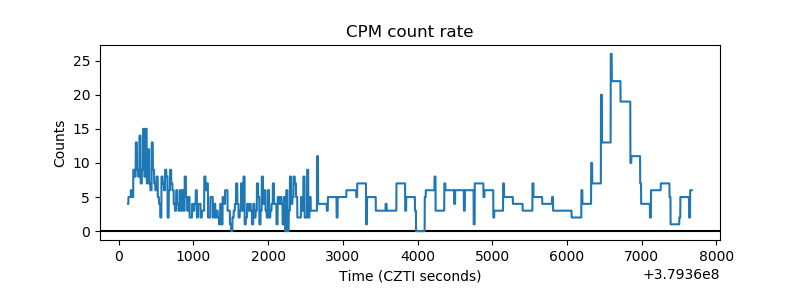 |
| CZT Counter | 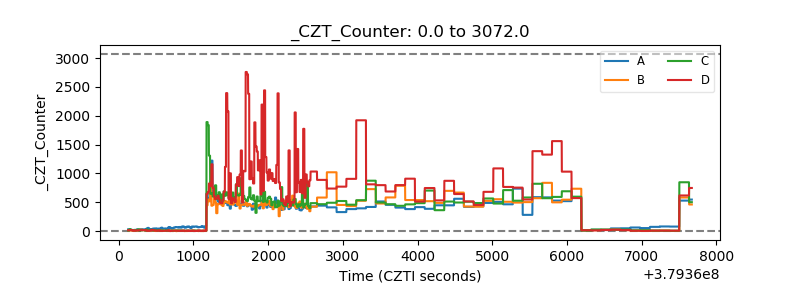 |
| +2.5 Volts monitor |  |
| +5 Volts monitor | 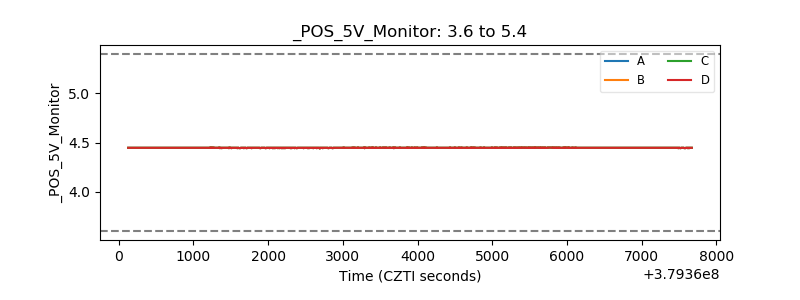 |
| _ROLL_ROT | 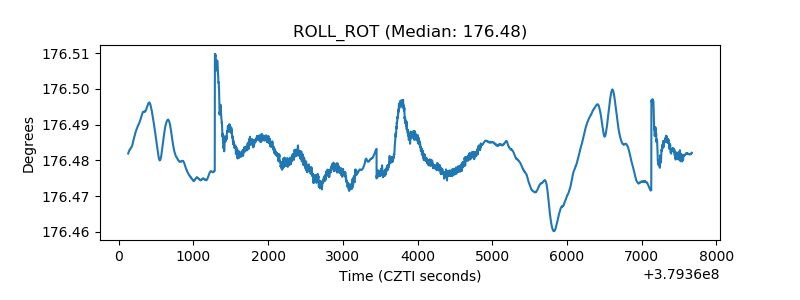 |
| _Roll_DEC | 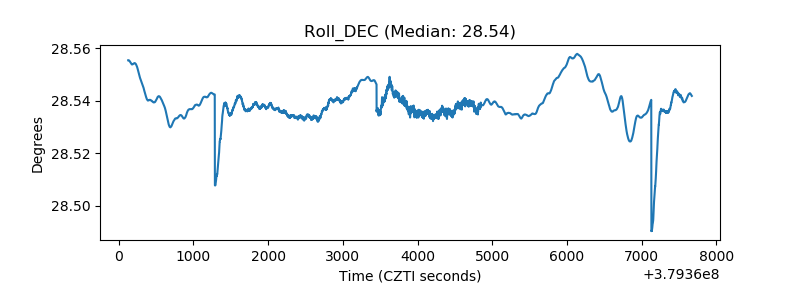 |
| _Roll_RA | 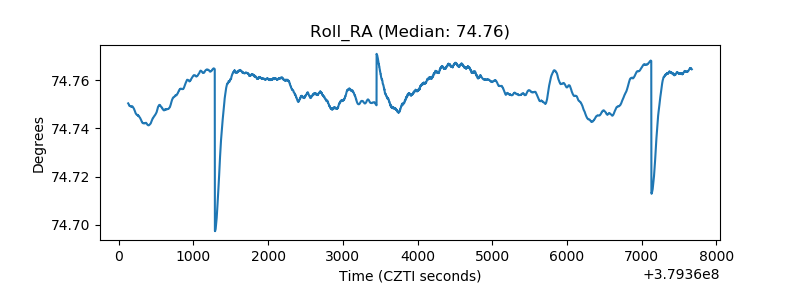 |
| Veto Counter | 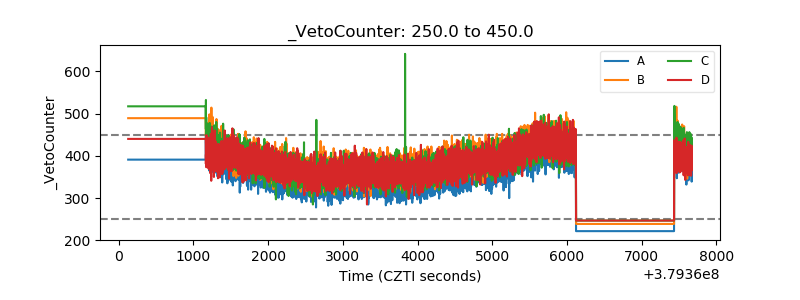 |