| Param | Original file | Final file |
|---|---|---|
| Filename | modeM0/AS1A11_037T01_9000004858cztM0_level2.fits | modeM0/AS1A11_037T01_9000004858cztM0_level2_quad_clean.evt |
| Size (bytes) | 304,833,600 | 224,403,840 |
| Size | 290.7 MB | 214.0 MB |
| Events in quadrant A | 1,451,582 | 1,140,137 |
| Events in quadrant B | 1,963,506 | 1,321,116 |
| Events in quadrant C | 2,052,208 | 1,269,393 |
| Events in quadrant D | 1,454,886 | 764,232 |
| Mode M0 | |||
|---|---|---|---|
| Quadrant | BADHDUFLAG | Total packets | Discarded packets |
| A | 0 | 117468 | 0 |
| B | 0 | 85553 | 0 |
| C | 0 | 78159 | 0 |
| D | 0 | 173866 | 0 |
| Mode SS | |||
|---|---|---|---|
| Quadrant | BADHDUFLAG | Total packets | Discarded packets |
| A | 0 | 686 | 0 |
| B | 0 | 686 | 0 |
| C | 0 | 682 | 0 |
| D | 0 | 686 | 0 |
| Mode M9 | |||
|---|---|---|---|
| Quadrant | BADHDUFLAG | Total packets | Discarded packets |
| A | 0 | 113 | 0 |
| B | 0 | 110 | 0 |
| C | 0 | 110 | 0 |
| D | 0 | 113 | 0 |
| Quadrant | Total seconds | Saturated seconds | Saturation percentage |
|---|---|---|---|
| A | 33426 | 11147 | 33.348292% |
| B | 33466 | 1136 | 3.394490% |
| C | 33457 | 436 | 1.303165% |
| D | 33456 | 11546 | 34.511000% |
Noise dominated data is calculated using 1-second bins in cleaned event files. If a bin has >2000 counts, and if more than 50% of those come from <1% of pixels, then it is considered to be noise-dominated and hence unusable.
| Quadrant | # 1 sec bins | Bins with >0 counts | Bins with >2000 counts | High rate bins dominated by noise | Noise dominated (total time) | Noise dominated (detector-on time) | Marked lightcurve |
|---|---|---|---|---|---|---|---|
| A | 45827 | 29894 | 0 | 0 | 0.00% | 0.00% |  |
| B | 45827 | 33440 | 0 | 0 | 0.00% | 0.00% |  |
| C | 45827 | 33479 | 0 | 0 | 0.00% | 0.00% |  |
| D | 45827 | 33293 | 0 | 0 | 0.00% | 0.00% |  |
Top three noisy pixels from each quadrant. If the there are fewer than three noisy pixels in the level2.evt file, extra rows are filled as -1
| Pixel properties | Quadrant properties | ||||||
|---|---|---|---|---|---|---|---|
| Quadrant | DetID | PixID | Counts | Sigma | Mean | Median | Sigma |
| A | 7 | 110 | 1173 | 8.59 | 378 | 356 | 95.1 |
| A | 0 | 29 | 1169 | 8.55 | 378 | 356 | 95.1 |
| A | 9 | 19 | 1157 | 8.42 | 378 | 356 | 95.1 |
| B | 2 | 9 | 1701 | 11.71 | 521 | 500 | 102.6 |
| B | 3 | 80 | 1539 | 10.13 | 521 | 500 | 102.6 |
| B | 2 | 8 | 1374 | 8.52 | 521 | 500 | 102.6 |
| C | 3 | 202 | 1622 | 8.03 | 543 | 515 | 137.9 |
| C | 3 | 203 | 1600 | 7.87 | 543 | 515 | 137.9 |
| C | 3 | 187 | 1389 | 6.34 | 543 | 515 | 137.9 |
| D | 7 | 3 | 1051 | 6.02 | 417 | 382 | 111.2 |
| D | 4 | 160 | 1041 | 5.93 | 417 | 382 | 111.2 |
| D | 10 | 189 | 1040 | 5.92 | 417 | 382 | 111.2 |
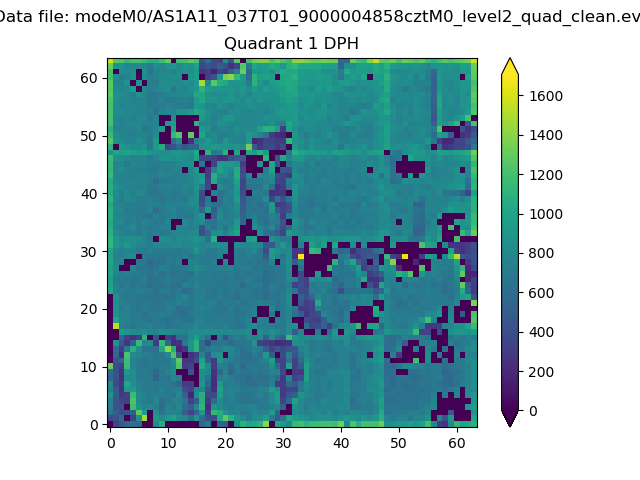
Histogram calculated using DETX and DETY for each event in the final _common_clean file
| Quadrant A |  |
 |
Quadrant B |
|---|---|---|---|
| Quadrant D |  |
 |
Quadrant C |
| Plot type | Count rate plots | Images |
|---|---|---|
| Comparison with Poisson distribution Blue bars denote a histogram of data divided into 1 sec bins. Red curve is a Poisson curve with rate = median count rate of data. |
 |
 |
| Quadrant-wise count rates Data is divided into 100 sec bins |
 |
|
| Module-wise count rates for Quadrant A Data is divided into 100 sec bins |
 |
 |
| Module-wise count rates for Quadrant B Data is divided into 100 sec bins |
 |
 |
| Module-wise count rates for Quadrant C Data is divided into 100 sec bins |
 |
 |
| Module-wise count rates for Quadrant D Data is divided into 100 sec bins |
 |
 |
| Parameter | Plot |
|---|---|
| CZT HV Monitor |  |
| D_VDD |  |
| Temperature 1 |  |
| Veto HV Monitor |  |
| Veto LLD |  |
| Alpha Counter |  |
| _CPM_Rate |  |
| CZT Counter |  |
| +2.5 Volts monitor |  |
| +5 Volts monitor |  |
| _ROLL_ROT |  |
| _Roll_DEC |  |
| _Roll_RA |  |
| Veto Counter |  |