| Param | Original file | Final file |
|---|---|---|
| Filename | modeM0/AS1A11_037T01_9000004858_33968cztM0_level2.evt | modeM0/AS1A11_037T01_9000004858_33968cztM0_level2_quad_clean.evt |
| Size (bytes) | 689,523,840 | 79,315,200 |
| Size | 657.6 MB | 75.6 MB |
| Events in quadrant A | 3,428,439 | 534,054 |
| Events in quadrant B | 4,160,948 | 526,712 |
| Events in quadrant C | 3,264,018 | 521,383 |
| Events in quadrant D | 9,640,115 | 416,831 |
| Mode M0 | |||
|---|---|---|---|
| Quadrant | BADHDUFLAG | Total packets | Discarded packets |
| A | 0 | 14161 | 3 |
| B | 0 | 16148 | 2 |
| C | 0 | 12898 | 2 |
| D | 0 | 32578 | 2 |
| Mode SS | |||
|---|---|---|---|
| Quadrant | BADHDUFLAG | Total packets | Discarded packets |
| A | 0 | 120 | 0 |
| B | 0 | 120 | 0 |
| C | 0 | 120 | 0 |
| D | 0 | 120 | 0 |
| Mode M9 | |||
|---|---|---|---|
| Quadrant | BADHDUFLAG | Total packets | Discarded packets |
| A | 0 | 31 | 0 |
| B | 0 | 31 | 0 |
| C | 0 | 31 | 0 |
| D | 0 | 31 | 0 |
| Quadrant | Total seconds | Saturated seconds | Saturation percentage |
|---|---|---|---|
| A | 5747 | 140 | 2.436054% |
| B | 5747 | 494 | 8.595789% |
| C | 5747 | 73 | 1.270228% |
| D | 5747 | 2342 | 40.751697% |
Noise dominated data is calculated using 1-second bins in cleaned event files. If a bin has >2000 counts, and if more than 50% of those come from <1% of pixels, then it is considered to be noise-dominated and hence unusable.
| Quadrant | # 1 sec bins | Bins with >0 counts | Bins with >2000 counts | High rate bins dominated by noise | Noise dominated (total time) | Noise dominated (detector-on time) | Marked lightcurve |
|---|---|---|---|---|---|---|---|
| A | 8852 | 5749 | 120 | 120 | 1.36% | 2.09% | 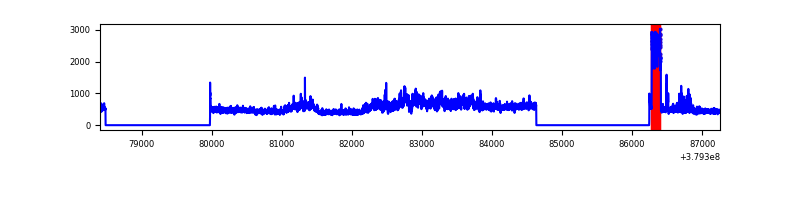 |
| B | 8852 | 5749 | 317 | 317 | 3.58% | 5.51% | 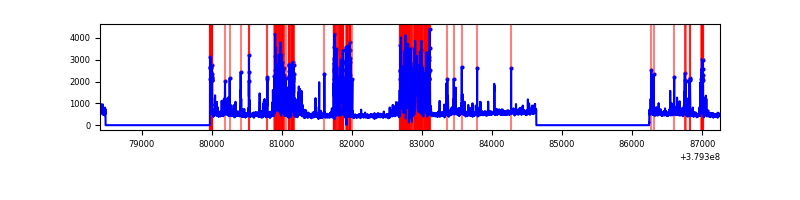 |
| C | 8852 | 5749 | 56 | 56 | 0.63% | 0.97% | 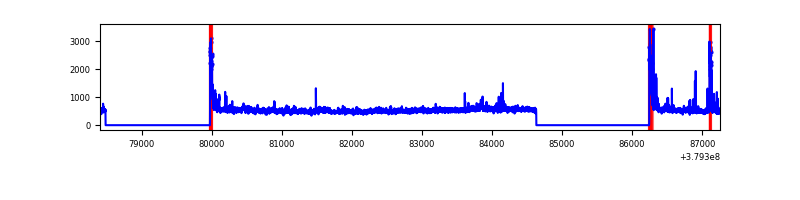 |
| D | 8852 | 5749 | 2235 | 2235 | 25.25% | 38.88% | 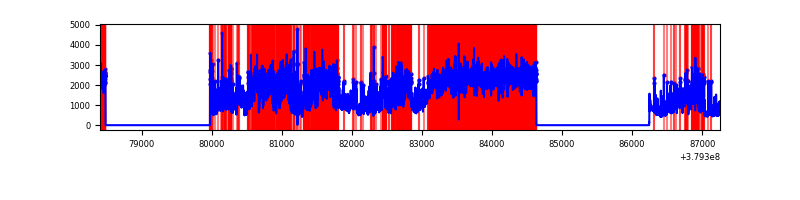 |
Top three noisy pixels from each quadrant. If the there are fewer than three noisy pixels in the level2.evt file, extra rows are filled as -1
| Pixel properties | Quadrant properties | ||||||
|---|---|---|---|---|---|---|---|
| Quadrant | DetID | PixID | Counts | Sigma | Mean | Median | Sigma |
| A | 15 | 169 | 813919 | 6051.82 | 669 | 657 | 134.4 |
| A | 13 | 6 | 14179 | 100.62 | 669 | 657 | 134.4 |
| A | 10 | 83 | 14140 | 100.33 | 669 | 657 | 134.4 |
| B | 5 | 172 | 1440588 | 11564.62 | 647 | 631 | 124.5 |
| B | 0 | 190 | 62476 | 496.69 | 647 | 631 | 124.5 |
| B | 4 | 232 | 25135 | 196.8 | 647 | 631 | 124.5 |
| C | 15 | 214 | 249616 | 1627.04 | 659 | 665 | 153.0 |
| C | 3 | 233 | 239226 | 1559.13 | 659 | 665 | 153.0 |
| C | 0 | 10 | 159437 | 1037.67 | 659 | 665 | 153.0 |
| D | 12 | 33 | 5284367 | 38312.77 | 545 | 529 | 137.9 |
| D | 8 | 195 | 727778 | 5273.24 | 545 | 529 | 137.9 |
| D | 12 | 6 | 550384 | 3986.96 | 545 | 529 | 137.9 |
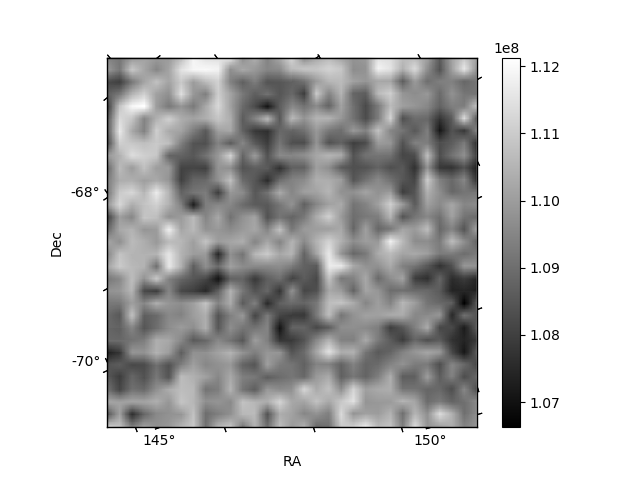
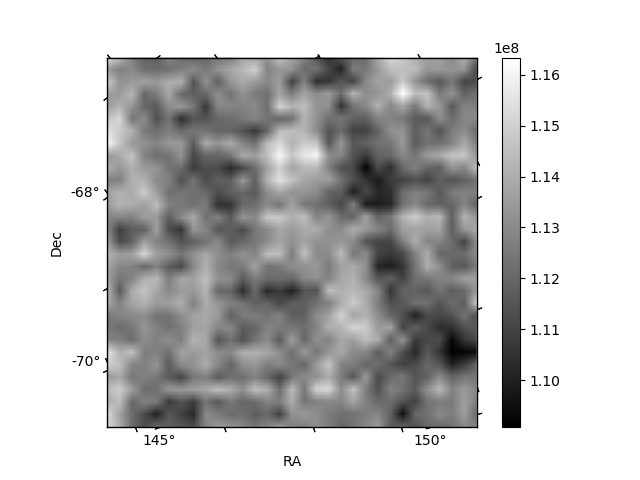
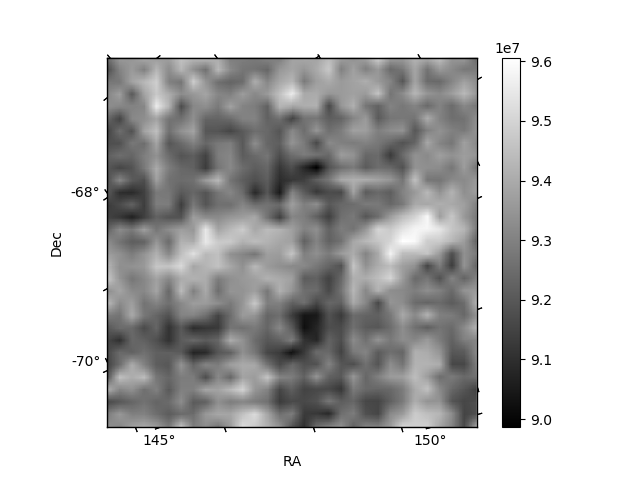
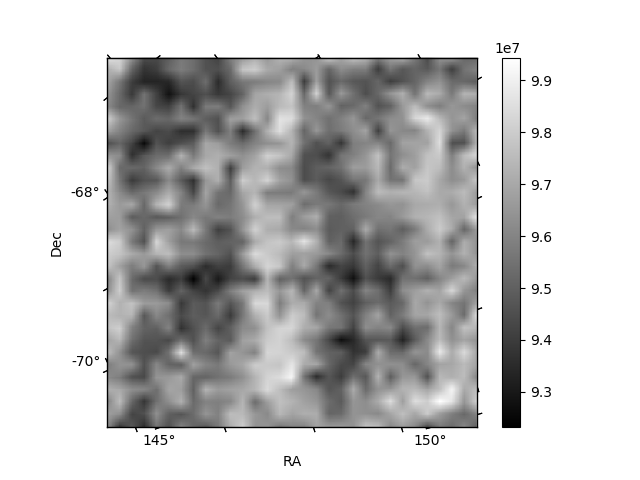
Histogram calculated using DETX and DETY for each event in the final _common_clean file
| Quadrant A | 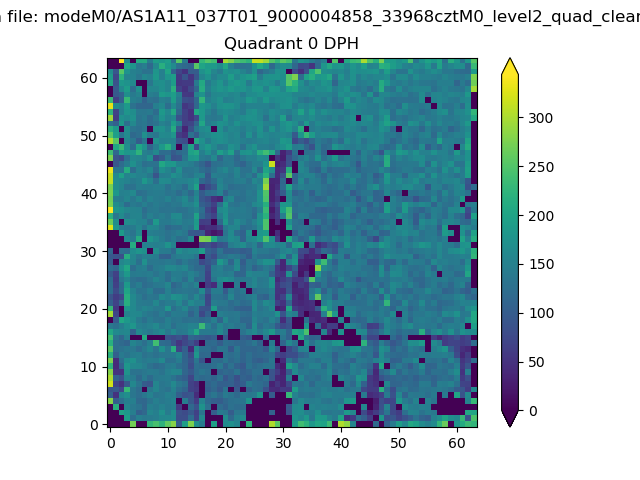 |
 |
Quadrant B |
|---|---|---|---|
| Quadrant D | 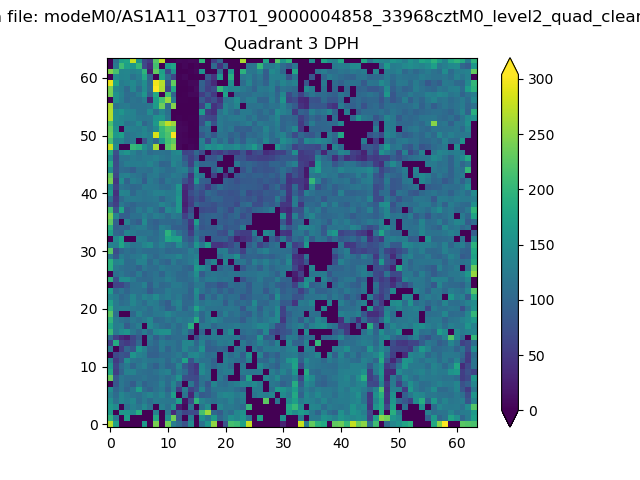 |
 |
Quadrant C |
| Plot type | Count rate plots | Images |
|---|---|---|
| Comparison with Poisson distribution Blue bars denote a histogram of data divided into 1 sec bins. Red curve is a Poisson curve with rate = median count rate of data. |
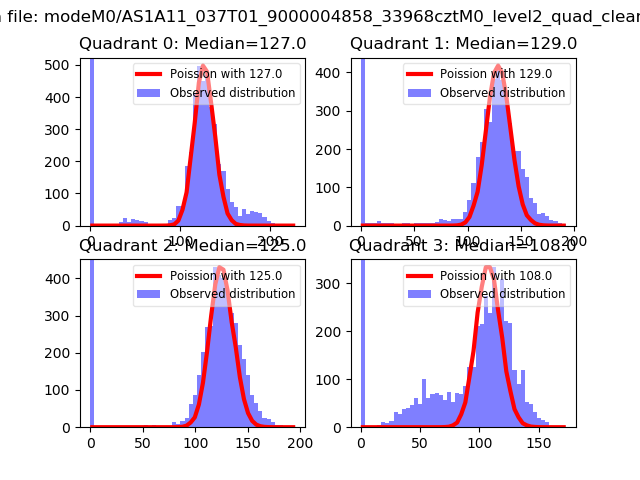 |
 |
| Quadrant-wise count rates Data is divided into 100 sec bins |
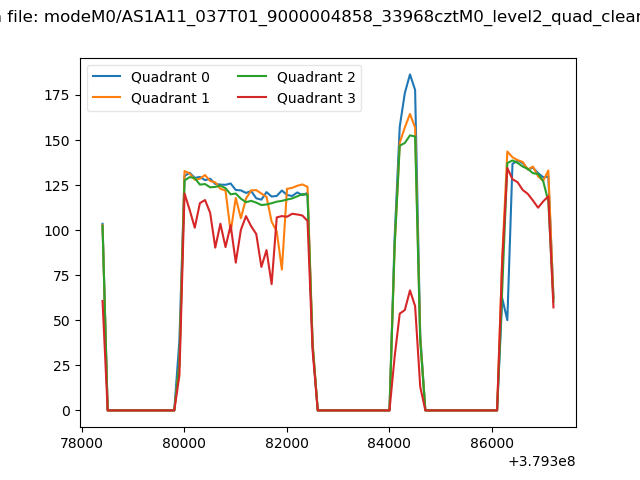 |
|
| Module-wise count rates for Quadrant A Data is divided into 100 sec bins |
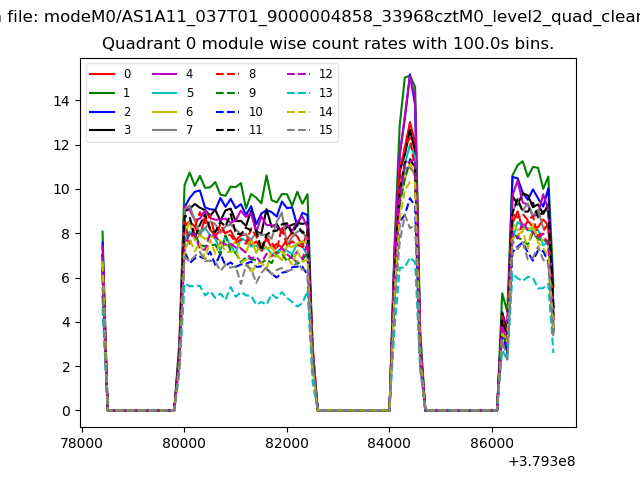 |
 |
| Module-wise count rates for Quadrant B Data is divided into 100 sec bins |
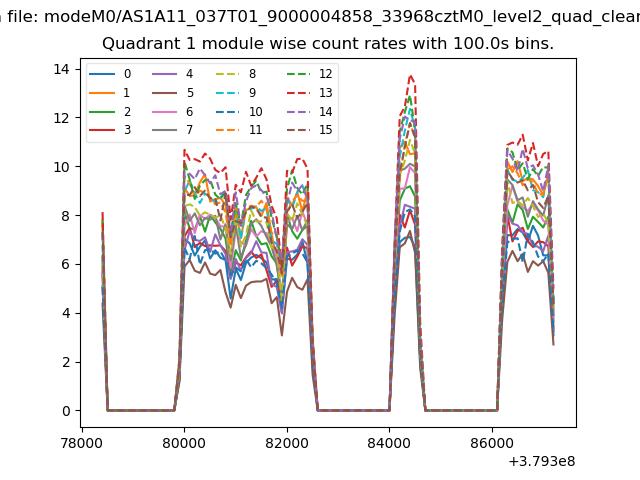 |
 |
| Module-wise count rates for Quadrant C Data is divided into 100 sec bins |
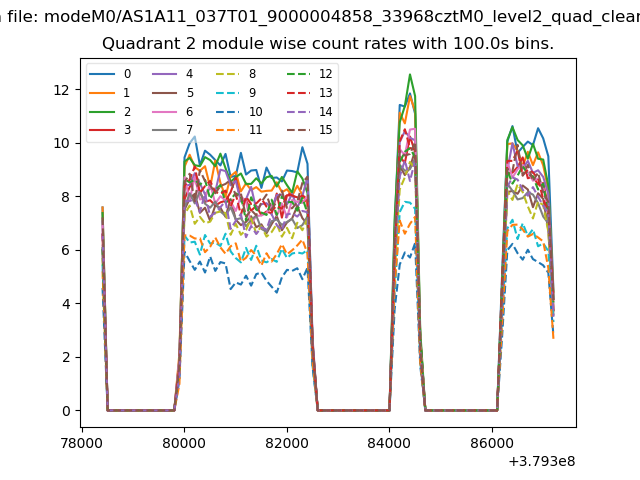 |
 |
| Module-wise count rates for Quadrant D Data is divided into 100 sec bins |
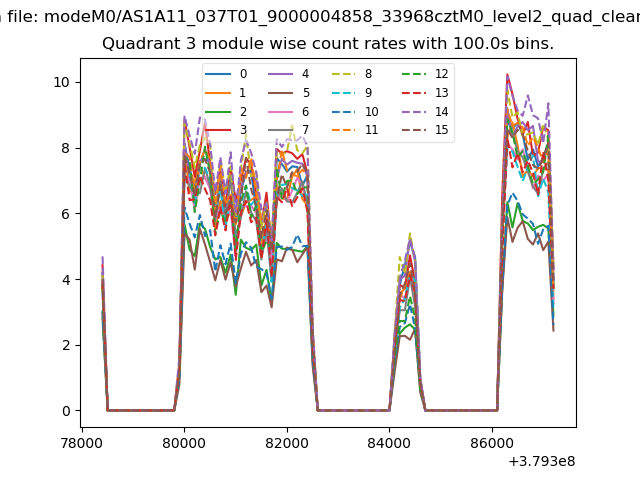 |
 |
| Parameter | Plot |
|---|---|
| CZT HV Monitor | 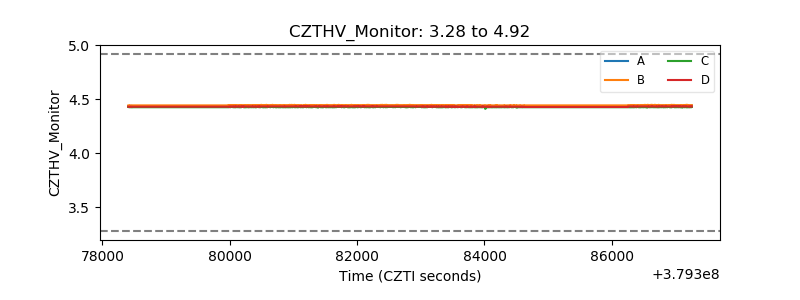 |
| D_VDD | 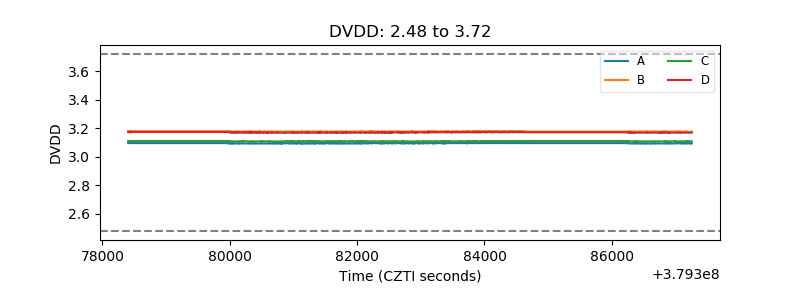 |
| Temperature 1 | 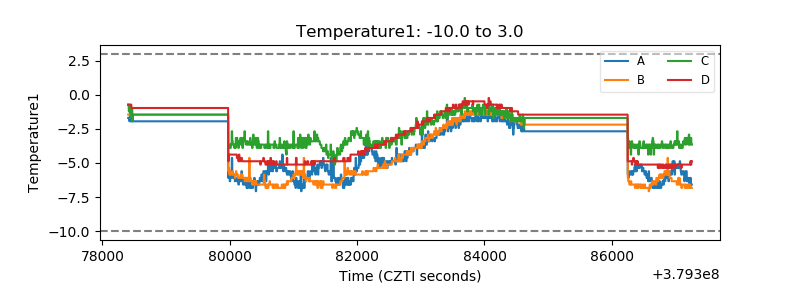 |
| Veto HV Monitor | 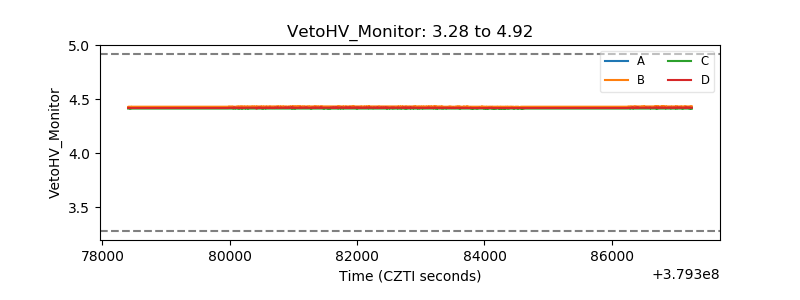 |
| Veto LLD |  |
| Alpha Counter | 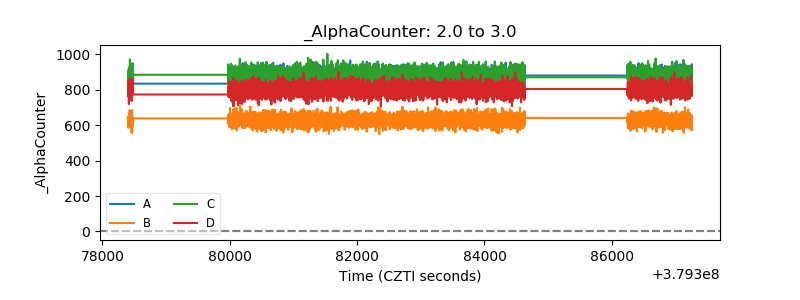 |
| _CPM_Rate | 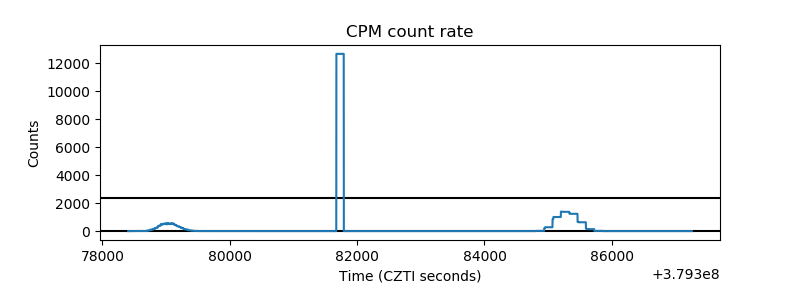 |
| CZT Counter |  |
| +2.5 Volts monitor |  |
| +5 Volts monitor | 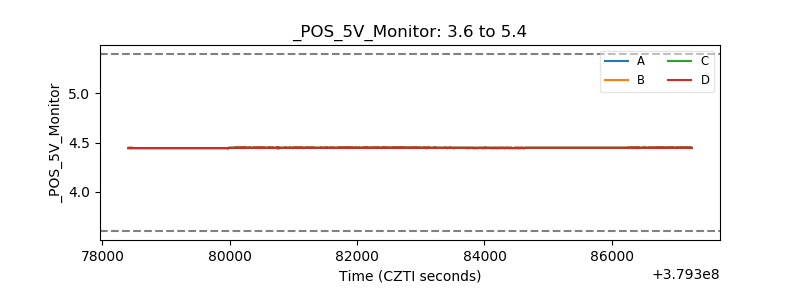 |
| _ROLL_ROT | 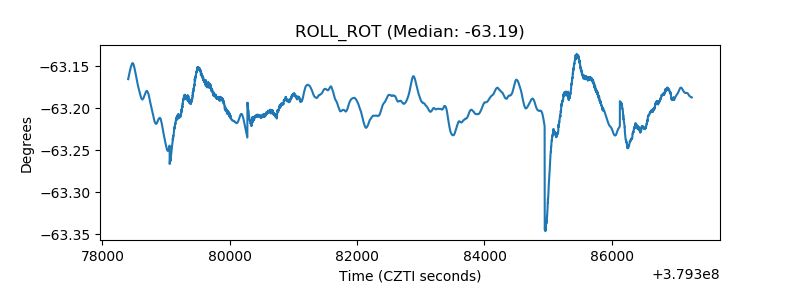 |
| _Roll_DEC | 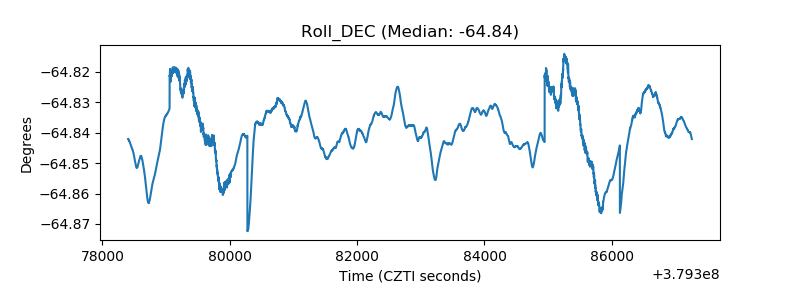 |
| _Roll_RA | 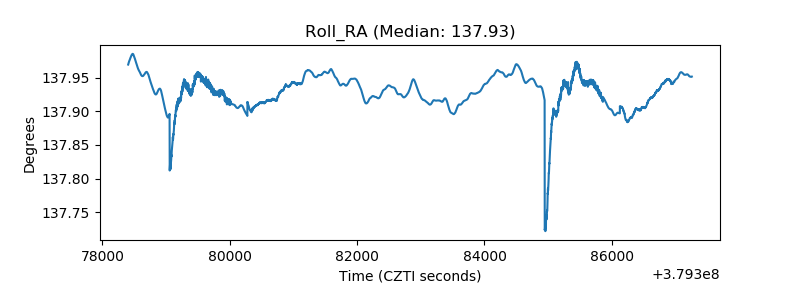 |
| Veto Counter | 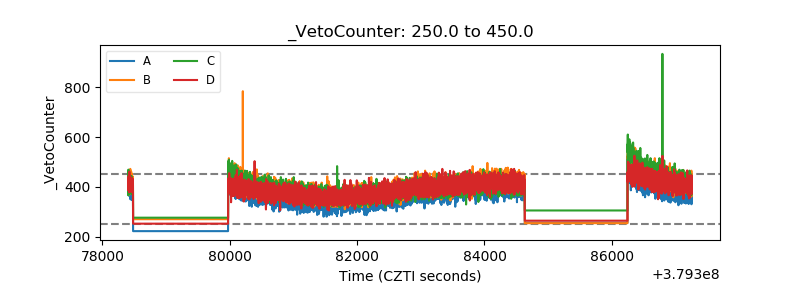 |