| Param | Original file | Final file |
|---|---|---|
| Filename | modeM0/AS1A11_037T01_9000004858_33970cztM0_level2.evt | modeM0/AS1A11_037T01_9000004858_33970cztM0_level2_quad_clean.evt |
| Size (bytes) | 604,244,160 | 76,273,920 |
| Size | 576.3 MB | 72.7 MB |
| Events in quadrant A | 2,833,624 | 506,369 |
| Events in quadrant B | 3,431,738 | 514,218 |
| Events in quadrant C | 3,102,386 | 506,845 |
| Events in quadrant D | 8,564,522 | 401,924 |
| Mode M0 | |||
|---|---|---|---|
| Quadrant | BADHDUFLAG | Total packets | Discarded packets |
| A | 0 | 11902 | 3 |
| B | 0 | 13651 | 2 |
| C | 0 | 12264 | 2 |
| D | 0 | 29236 | 2 |
| Mode SS | |||
|---|---|---|---|
| Quadrant | BADHDUFLAG | Total packets | Discarded packets |
| A | 0 | 110 | 0 |
| B | 0 | 110 | 0 |
| C | 0 | 110 | 0 |
| D | 0 | 110 | 0 |
| Mode M9 | |||
|---|---|---|---|
| Quadrant | BADHDUFLAG | Total packets | Discarded packets |
| A | 0 | 17 | 0 |
| B | 0 | 17 | 0 |
| C | 0 | 17 | 0 |
| D | 0 | 18 | 0 |
| Quadrant | Total seconds | Saturated seconds | Saturation percentage |
|---|---|---|---|
| A | 5425 | 139 | 2.562212% |
| B | 5425 | 185 | 3.410138% |
| C | 5425 | 87 | 1.603687% |
| D | 5425 | 2031 | 37.437788% |
Noise dominated data is calculated using 1-second bins in cleaned event files. If a bin has >2000 counts, and if more than 50% of those come from <1% of pixels, then it is considered to be noise-dominated and hence unusable.
| Quadrant | # 1 sec bins | Bins with >0 counts | Bins with >2000 counts | High rate bins dominated by noise | Noise dominated (total time) | Noise dominated (detector-on time) | Marked lightcurve |
|---|---|---|---|---|---|---|---|
| A | 7158 | 5426 | 121 | 121 | 1.69% | 2.23% | 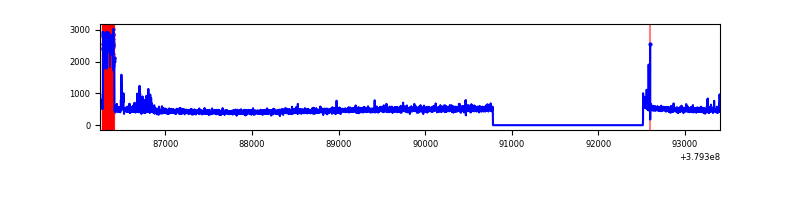 |
| B | 7158 | 5426 | 96 | 96 | 1.34% | 1.77% | 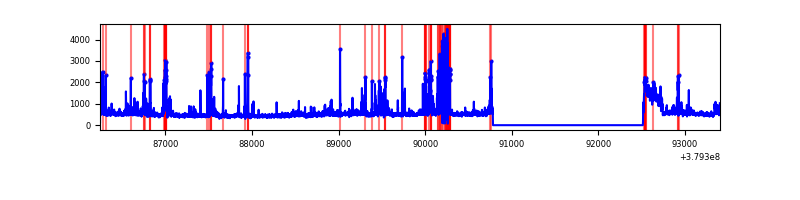 |
| C | 7158 | 5426 | 66 | 66 | 0.92% | 1.22% | 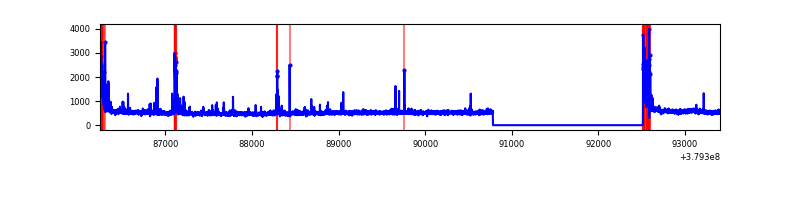 |
| D | 7158 | 5426 | 1886 | 1886 | 26.35% | 34.76% | 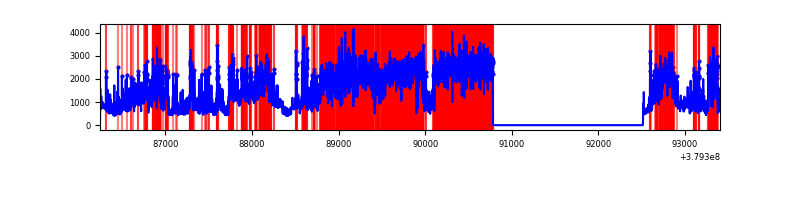 |
Top three noisy pixels from each quadrant. If the there are fewer than three noisy pixels in the level2.evt file, extra rows are filled as -1
| Pixel properties | Quadrant properties | ||||||
|---|---|---|---|---|---|---|---|
| Quadrant | DetID | PixID | Counts | Sigma | Mean | Median | Sigma |
| A | 15 | 169 | 340005 | 2664.58 | 637 | 624 | 127.4 |
| A | 10 | 83 | 13829 | 103.68 | 637 | 624 | 127.4 |
| A | 13 | 6 | 8993 | 65.71 | 637 | 624 | 127.4 |
| B | 5 | 172 | 397588 | 3263.73 | 640 | 624 | 121.6 |
| B | 0 | 182 | 311856 | 2558.86 | 640 | 624 | 121.6 |
| B | 0 | 190 | 90511 | 739.03 | 640 | 624 | 121.6 |
| C | 15 | 214 | 238375 | 1626.01 | 637 | 642 | 146.2 |
| C | 0 | 10 | 204615 | 1395.1 | 637 | 642 | 146.2 |
| C | 3 | 233 | 120000 | 816.37 | 637 | 642 | 146.2 |
| D | 12 | 33 | 5301622 | 40058.08 | 528 | 513 | 132.3 |
| D | 8 | 195 | 630009 | 4756.82 | 528 | 513 | 132.3 |
| D | 13 | 249 | 286988 | 2164.76 | 528 | 513 | 132.3 |
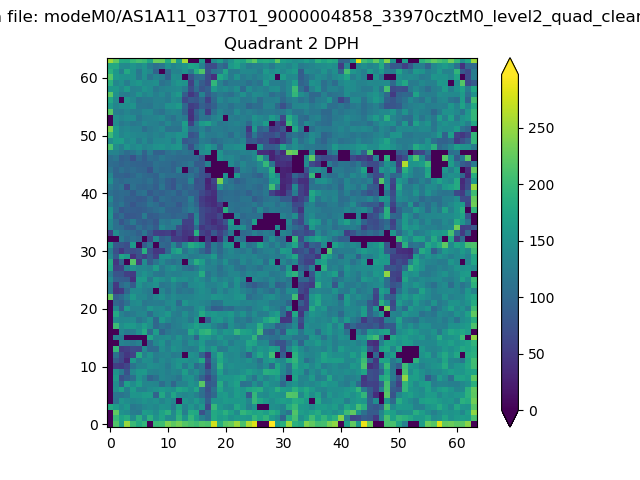
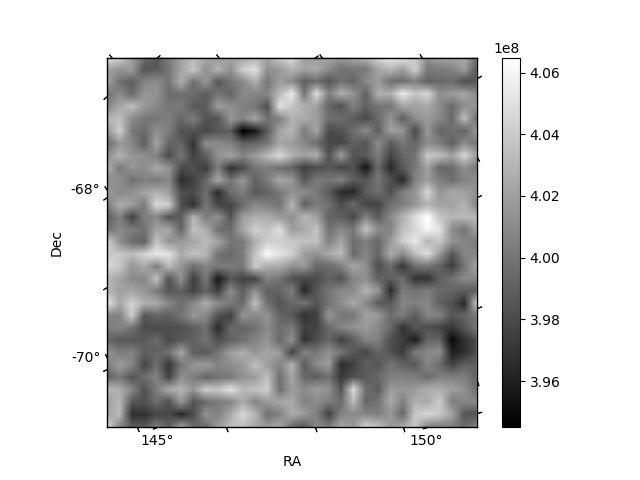
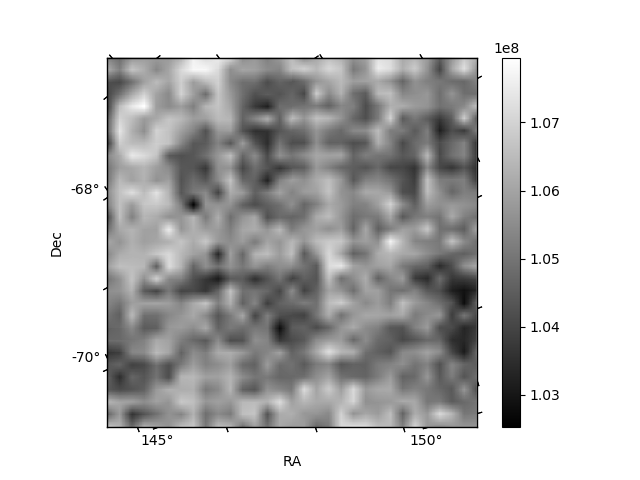
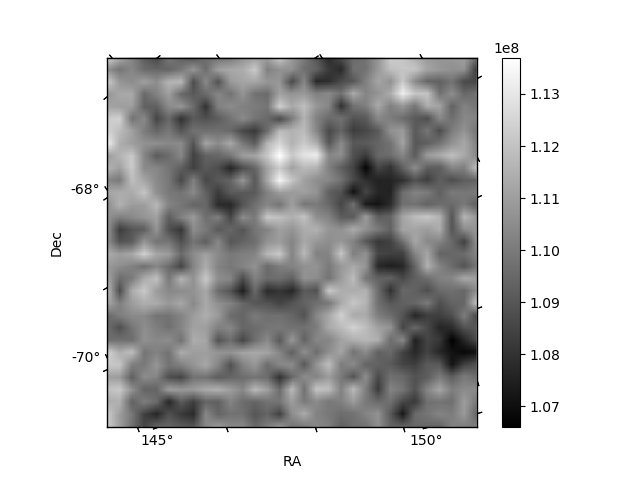
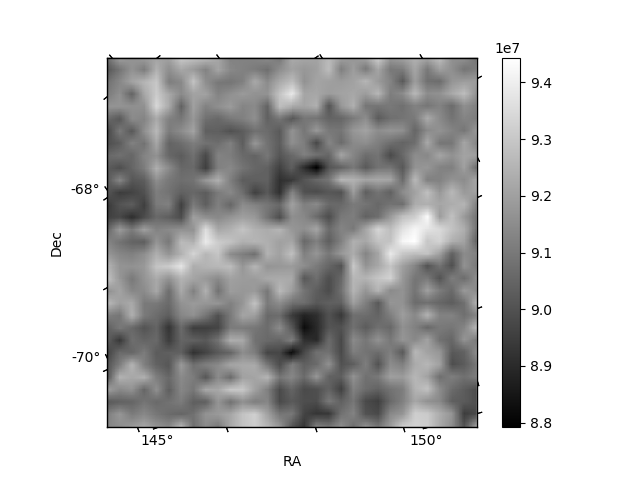
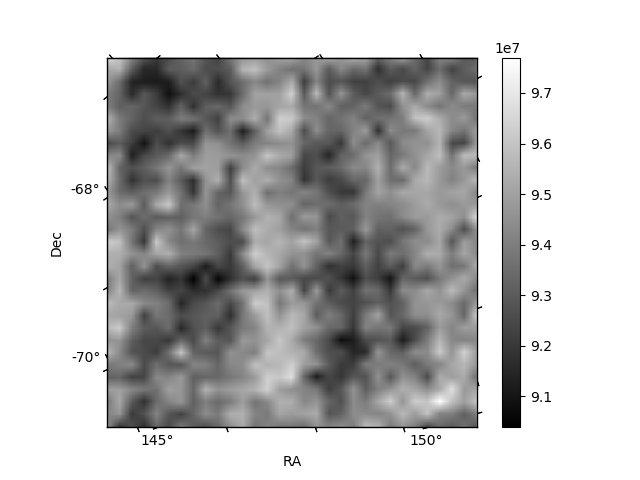
Histogram calculated using DETX and DETY for each event in the final _common_clean file
| Quadrant A | 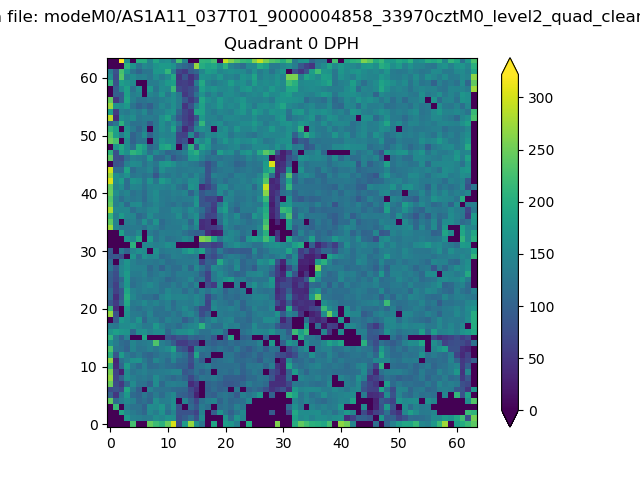 |
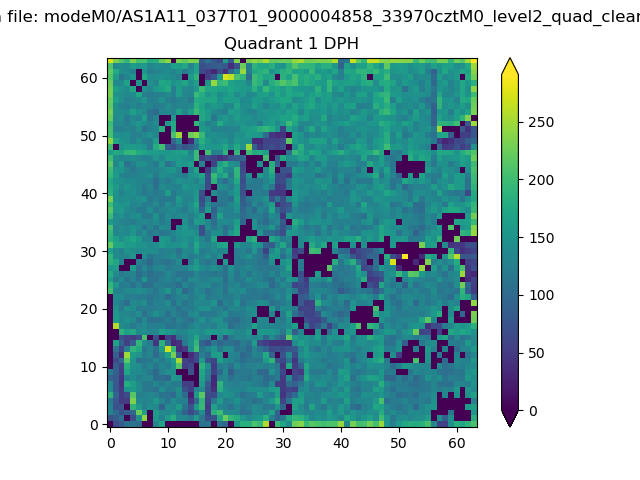 |
Quadrant B |
|---|---|---|---|
| Quadrant D | 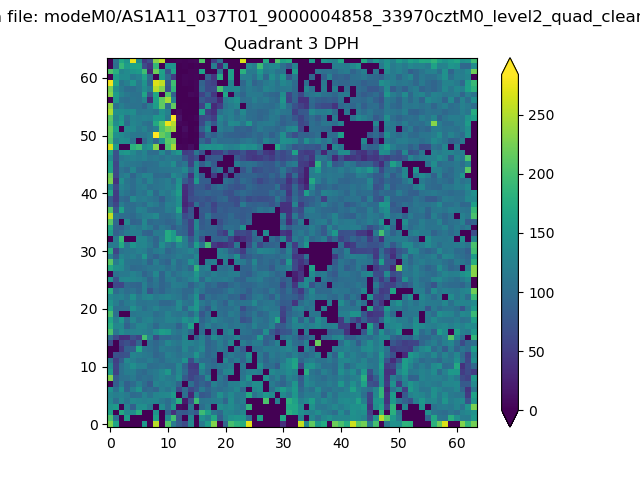 |
 |
Quadrant C |
| Plot type | Count rate plots | Images |
|---|---|---|
| Comparison with Poisson distribution Blue bars denote a histogram of data divided into 1 sec bins. Red curve is a Poisson curve with rate = median count rate of data. |
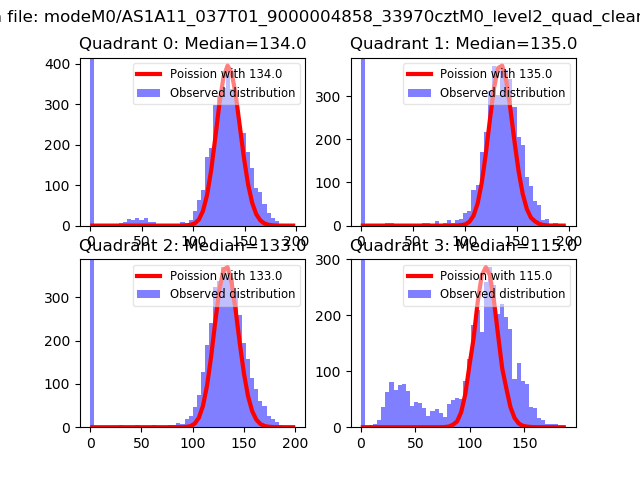 |
 |
| Quadrant-wise count rates Data is divided into 100 sec bins |
 |
|
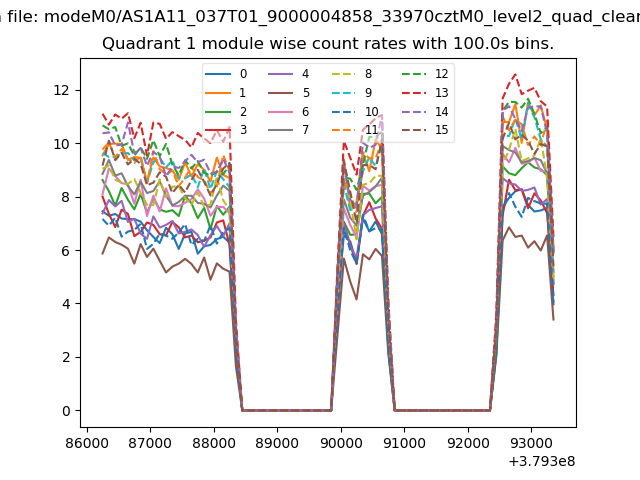
| Module-wise count rates for Quadrant A Data is divided into 100 sec bins |
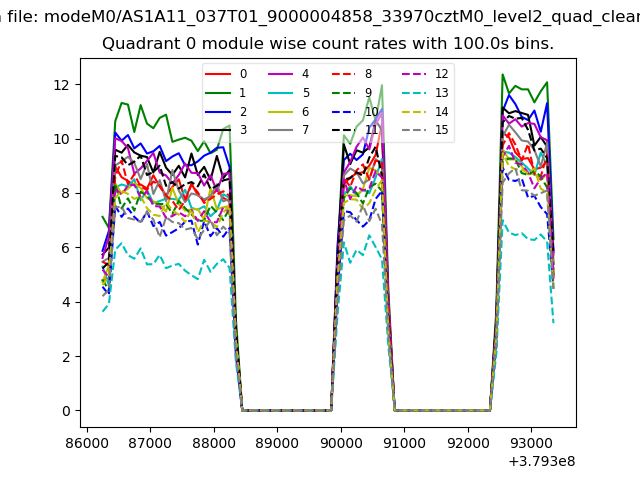 |
 |
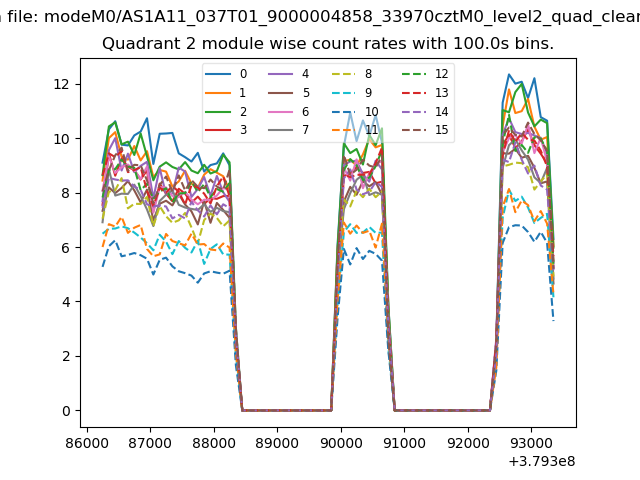
| Module-wise count rates for Quadrant B Data is divided into 100 sec bins |
 |
 |
| Module-wise count rates for Quadrant C Data is divided into 100 sec bins |
 |
 |
| Module-wise count rates for Quadrant D Data is divided into 100 sec bins |
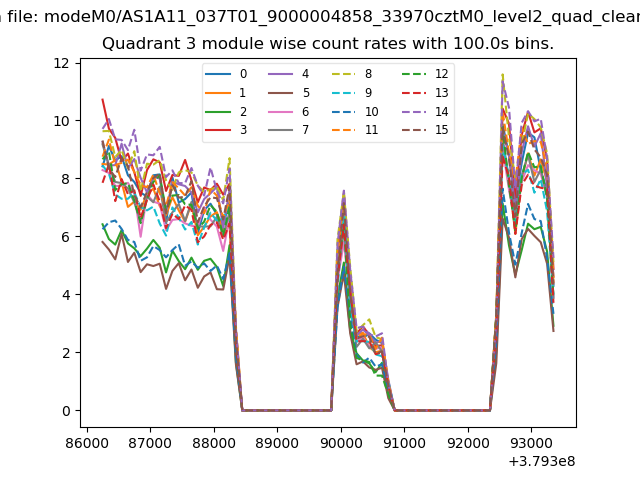 |
 |
| Parameter | Plot |
|---|---|
| CZT HV Monitor | 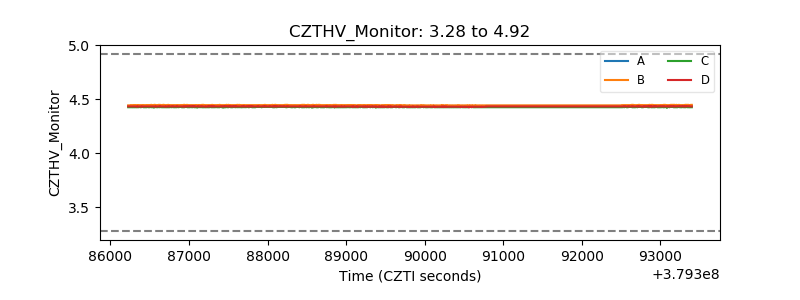 |
| D_VDD | 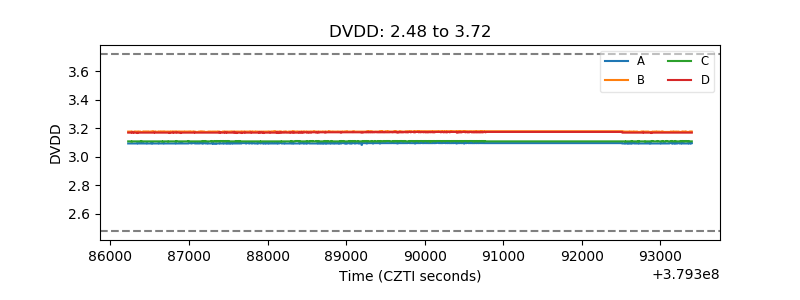 |
| Temperature 1 | 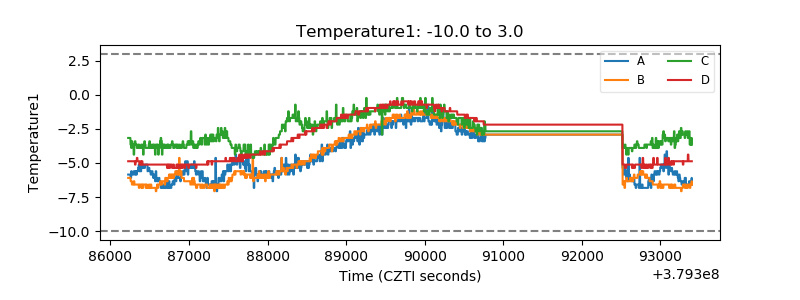 |
| Veto HV Monitor | 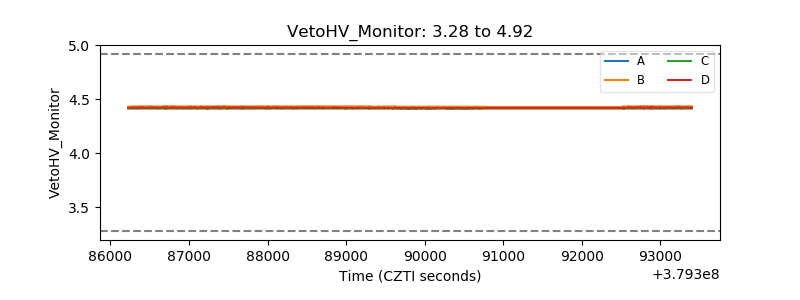 |
| Veto LLD | 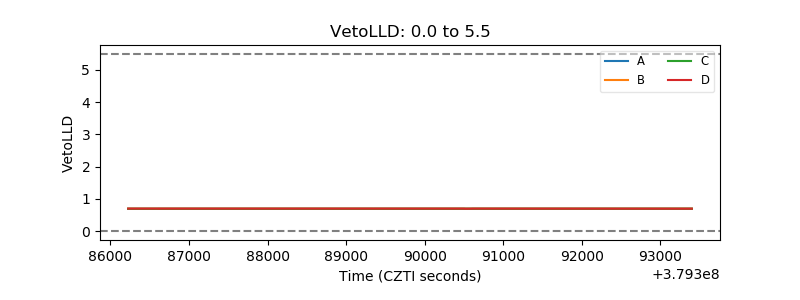 |
| Alpha Counter | 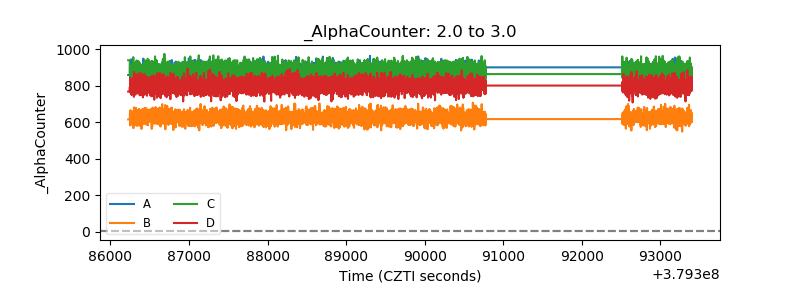 |
| _CPM_Rate |  |
| CZT Counter | 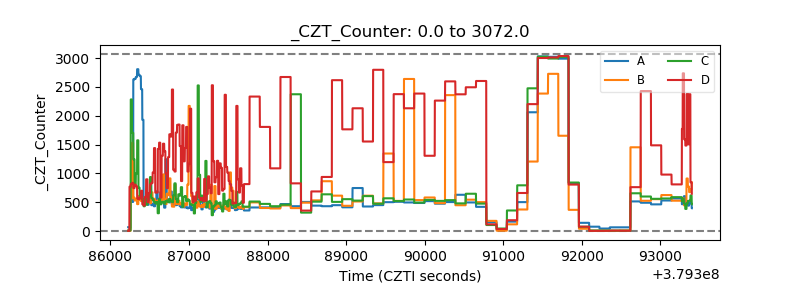 |
| +2.5 Volts monitor |  |
| +5 Volts monitor |  |
| _ROLL_ROT | 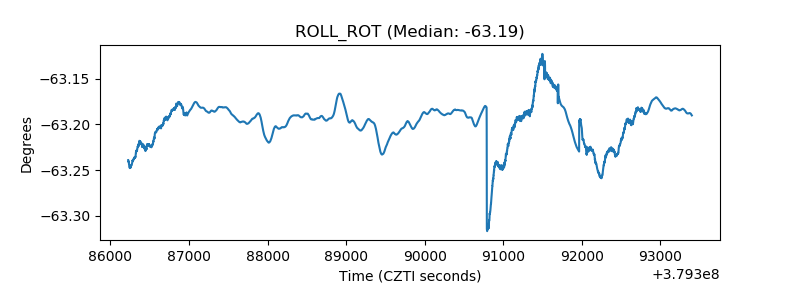 |
| _Roll_DEC | 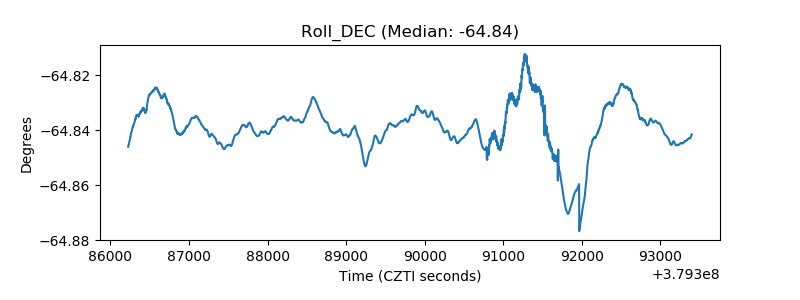 |
| _Roll_RA | 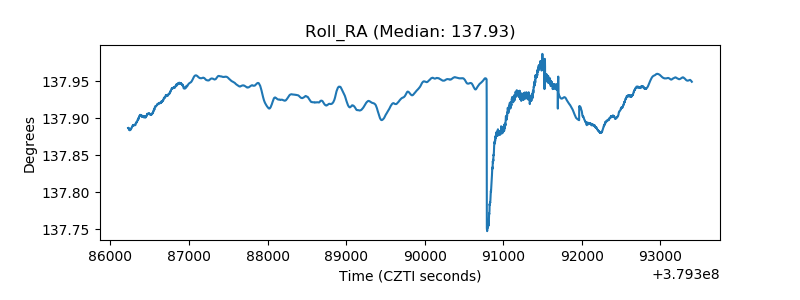 |
| Veto Counter | 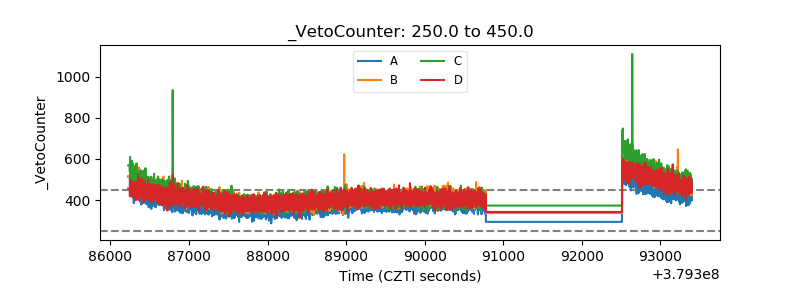 |