| Param | Original file | Final file |
|---|---|---|
| Filename | modeM0/AS1A11_037T01_9000004858_33971cztM0_level2.evt | modeM0/AS1A11_037T01_9000004858_33971cztM0_level2_quad_clean.evt |
| Size (bytes) | 664,542,720 | 73,532,160 |
| Size | 633.8 MB | 70.1 MB |
| Events in quadrant A | 3,457,344 | 479,748 |
| Events in quadrant B | 3,473,321 | 524,125 |
| Events in quadrant C | 2,893,028 | 517,172 |
| Events in quadrant D | 9,952,797 | 342,923 |
| Mode M0 | |||
|---|---|---|---|
| Quadrant | BADHDUFLAG | Total packets | Discarded packets |
| A | 0 | 13491 | 2 |
| B | 0 | 13616 | 1 |
| C | 0 | 11574 | 1 |
| D | 0 | 33150 | 1 |
| Mode SS | |||
|---|---|---|---|
| Quadrant | BADHDUFLAG | Total packets | Discarded packets |
| A | 0 | 106 | 0 |
| B | 0 | 106 | 0 |
| C | 0 | 106 | 0 |
| D | 0 | 106 | 0 |
| Mode M9 | |||
|---|---|---|---|
| Quadrant | BADHDUFLAG | Total packets | Discarded packets |
| A | 0 | 19 | 0 |
| B | 0 | 19 | 0 |
| C | 0 | 19 | 0 |
| D | 0 | 19 | 0 |
| Quadrant | Total seconds | Saturated seconds | Saturation percentage |
|---|---|---|---|
| A | 5160 | 485 | 9.399225% |
| B | 5160 | 93 | 1.802326% |
| C | 5160 | 31 | 0.600775% |
| D | 5160 | 3012 | 58.372093% |
Noise dominated data is calculated using 1-second bins in cleaned event files. If a bin has >2000 counts, and if more than 50% of those come from <1% of pixels, then it is considered to be noise-dominated and hence unusable.
| Quadrant | # 1 sec bins | Bins with >0 counts | Bins with >2000 counts | High rate bins dominated by noise | Noise dominated (total time) | Noise dominated (detector-on time) | Marked lightcurve |
|---|---|---|---|---|---|---|---|
| A | 7043 | 5161 | 97 | 97 | 1.38% | 1.88% | 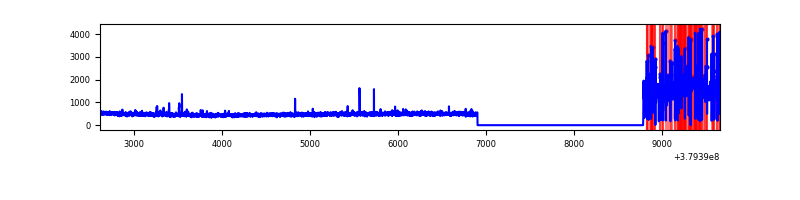 |
| B | 7043 | 5161 | 58 | 58 | 0.82% | 1.12% | 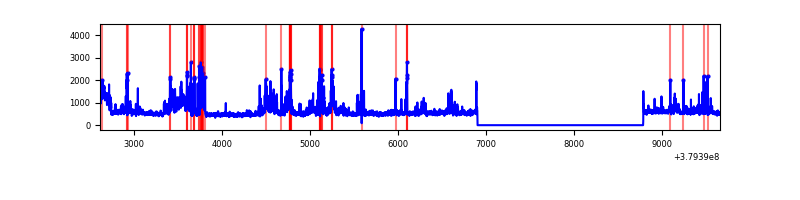 |
| C | 7043 | 5161 | 18 | 18 | 0.26% | 0.35% | 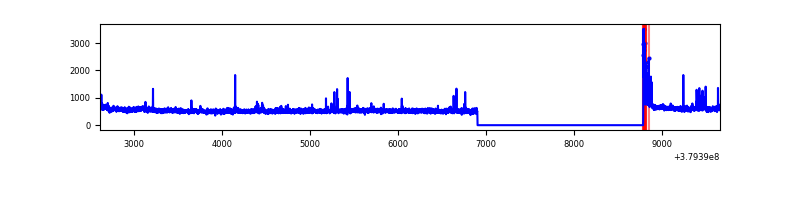 |
| D | 7043 | 5161 | 2675 | 2675 | 37.98% | 51.83% | 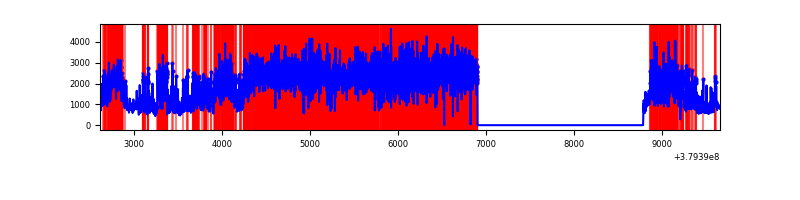 |
Top three noisy pixels from each quadrant. If the there are fewer than three noisy pixels in the level2.evt file, extra rows are filled as -1
| Pixel properties | Quadrant properties | ||||||
|---|---|---|---|---|---|---|---|
| Quadrant | DetID | PixID | Counts | Sigma | Mean | Median | Sigma |
| A | 15 | 169 | 1062995 | 8726.52 | 611 | 601 | 121.7 |
| A | 14 | 238 | 12913 | 101.13 | 611 | 601 | 121.7 |
| A | 13 | 254 | 8604 | 65.74 | 611 | 601 | 121.7 |
| B | 5 | 172 | 428608 | 3604.18 | 636 | 620 | 118.7 |
| B | 0 | 182 | 203353 | 1707.26 | 636 | 620 | 118.7 |
| B | 0 | 190 | 161628 | 1355.88 | 636 | 620 | 118.7 |
| C | 15 | 214 | 225141 | 1542.22 | 634 | 640 | 145.6 |
| C | 0 | 10 | 107492 | 734.02 | 634 | 640 | 145.6 |
| C | 3 | 233 | 56928 | 386.67 | 634 | 640 | 145.6 |
| D | 12 | 33 | 7463814 | 71969.14 | 420 | 409 | 103.7 |
| D | 8 | 195 | 460891 | 4440.4 | 420 | 409 | 103.7 |
| D | 2 | 250 | 159196 | 1531.17 | 420 | 409 | 103.7 |
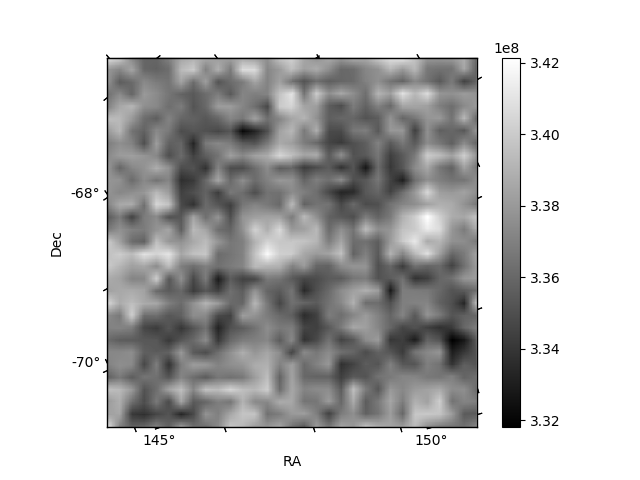
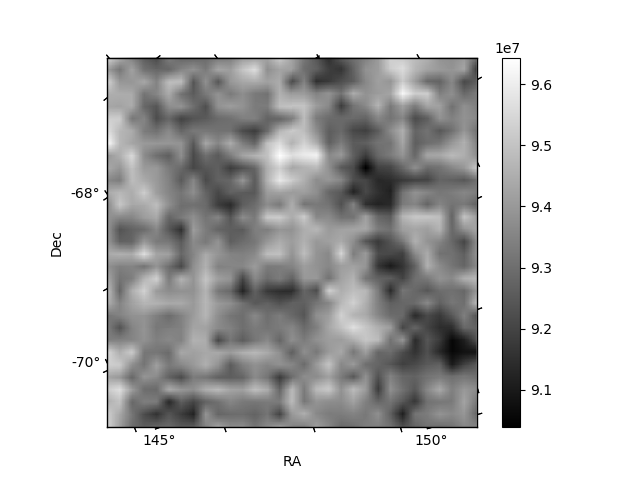
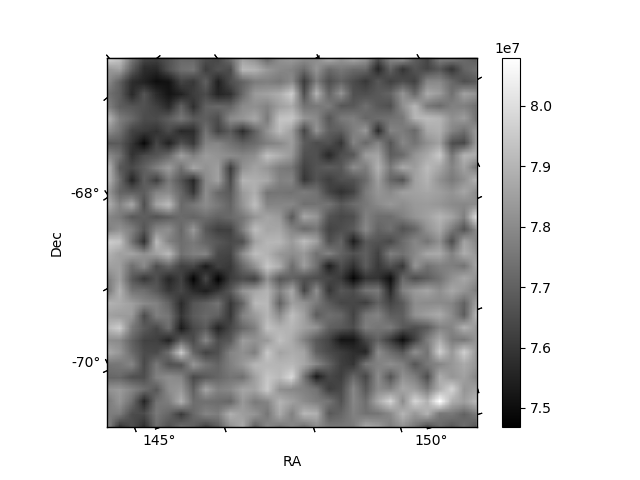
Histogram calculated using DETX and DETY for each event in the final _common_clean file
| Quadrant A | 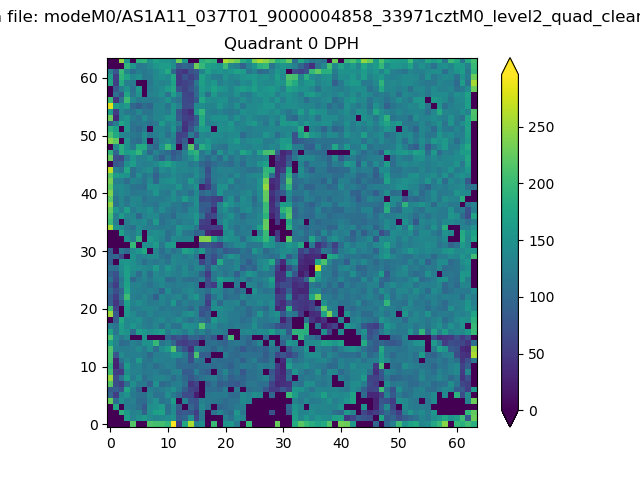 |
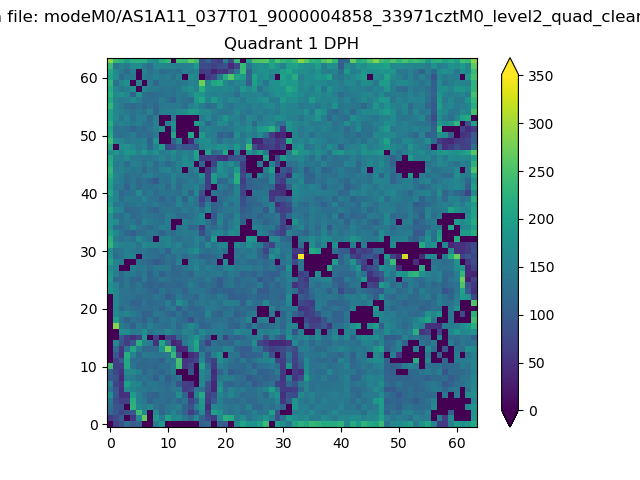 |
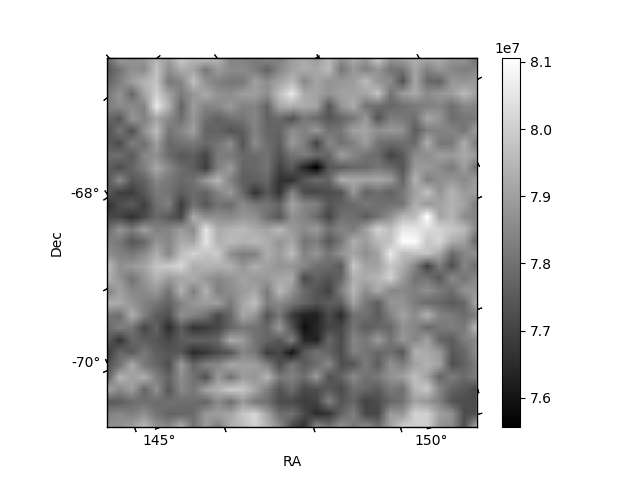
Quadrant B |
|---|---|---|---|
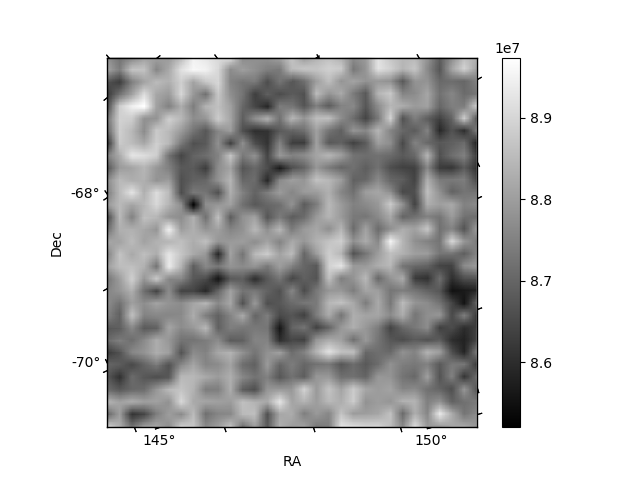
| Quadrant D | 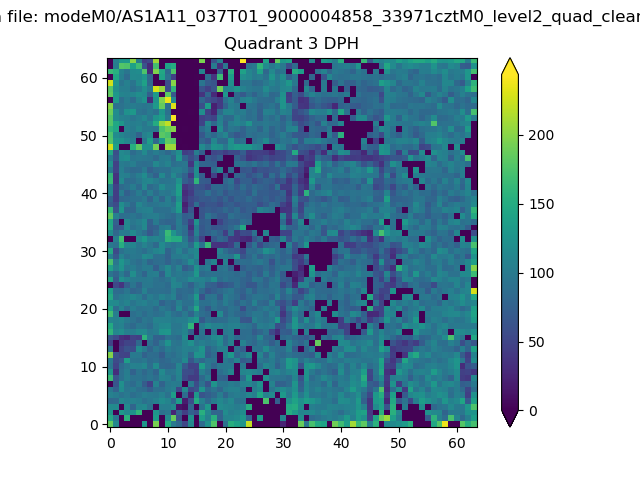 |
 |
Quadrant C |
| Plot type | Count rate plots | Images |
|---|---|---|
| Comparison with Poisson distribution Blue bars denote a histogram of data divided into 1 sec bins. Red curve is a Poisson curve with rate = median count rate of data. |
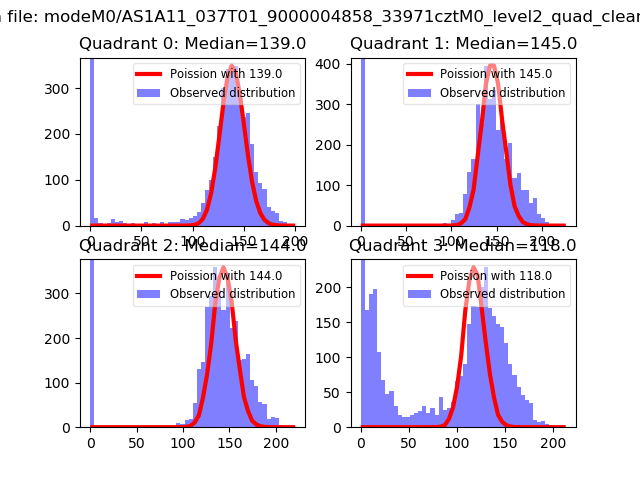 |
 |
| Quadrant-wise count rates Data is divided into 100 sec bins |
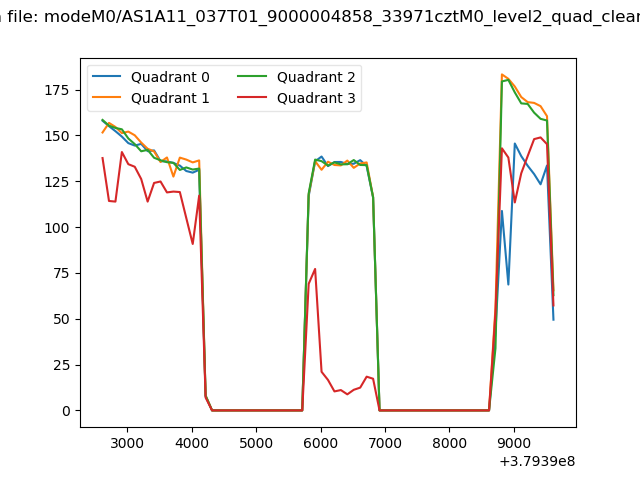 |
|
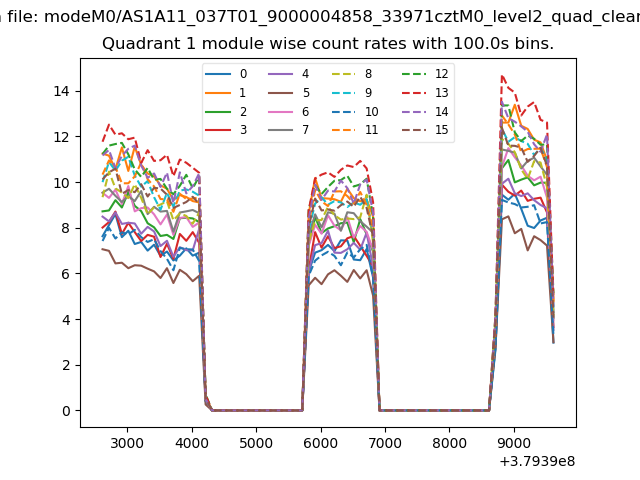
| Module-wise count rates for Quadrant A Data is divided into 100 sec bins |
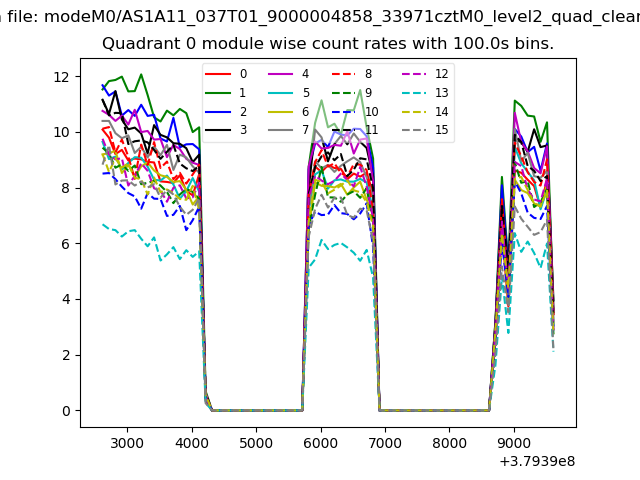 |
 |
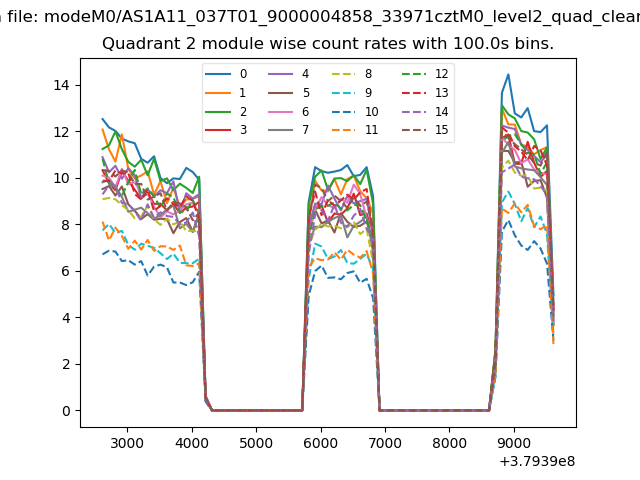
| Module-wise count rates for Quadrant B Data is divided into 100 sec bins |
 |
 |
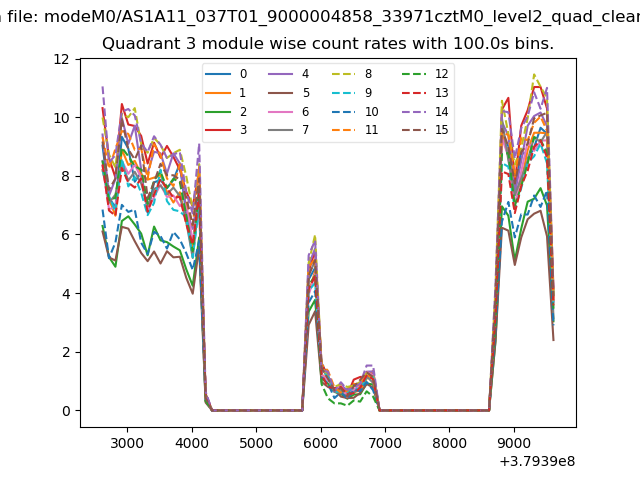
| Module-wise count rates for Quadrant C Data is divided into 100 sec bins |
 |
 |
| Module-wise count rates for Quadrant D Data is divided into 100 sec bins |
 |
 |
| Parameter | Plot |
|---|---|
| CZT HV Monitor | 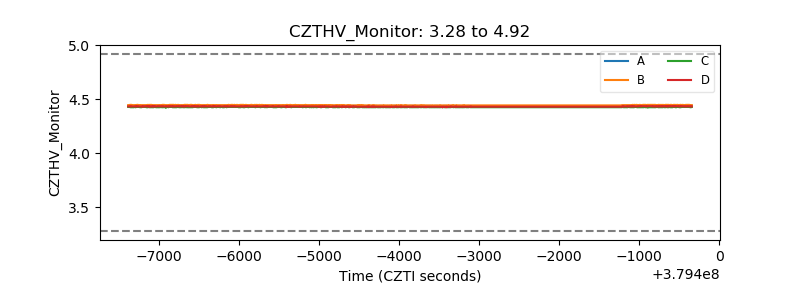 |
| D_VDD | 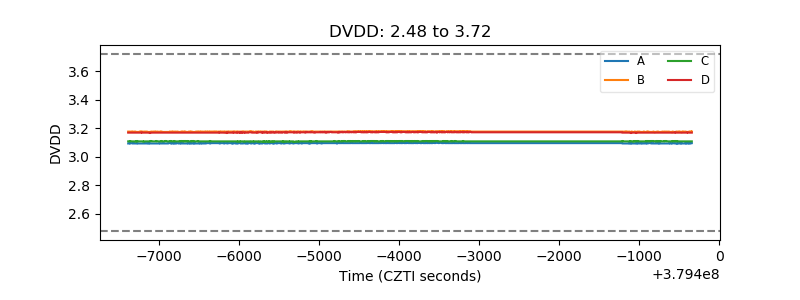 |
| Temperature 1 | 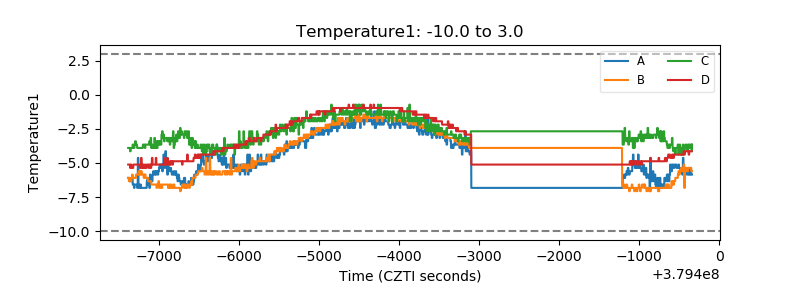 |
| Veto HV Monitor | 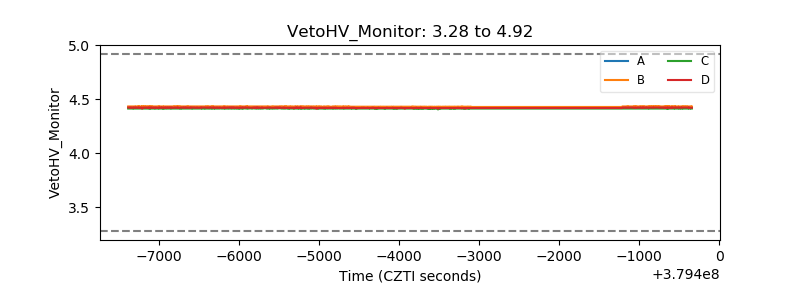 |
| Veto LLD | 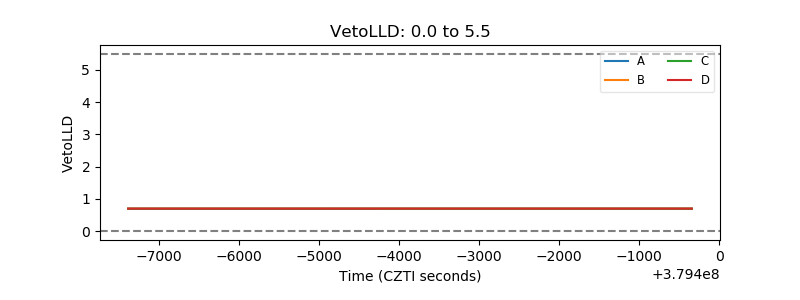 |
| Alpha Counter | 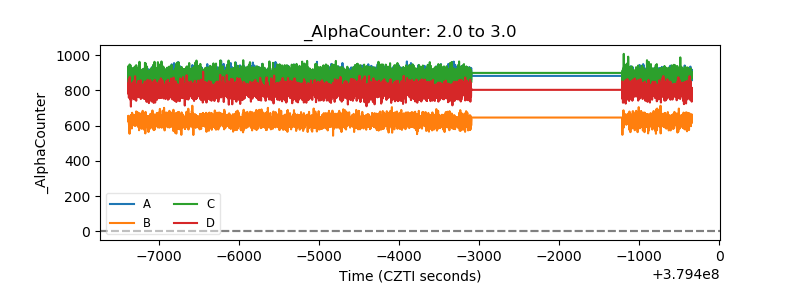 |
| _CPM_Rate | 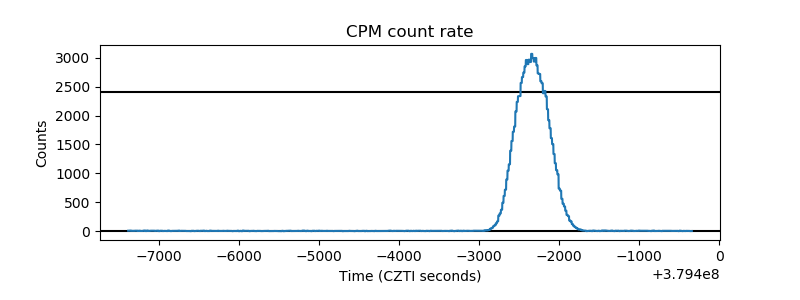 |
| CZT Counter | 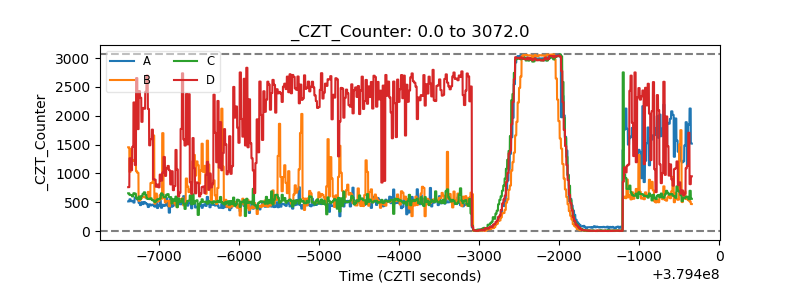 |
| +2.5 Volts monitor | 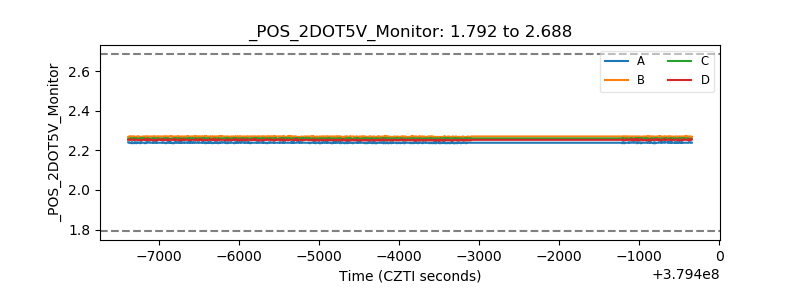 |
| +5 Volts monitor |  |
| _ROLL_ROT | 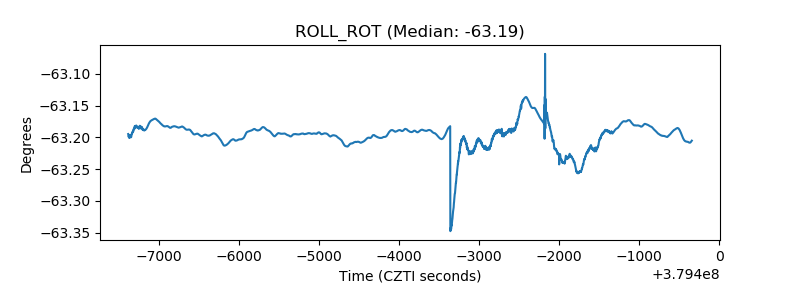 |
| _Roll_DEC | 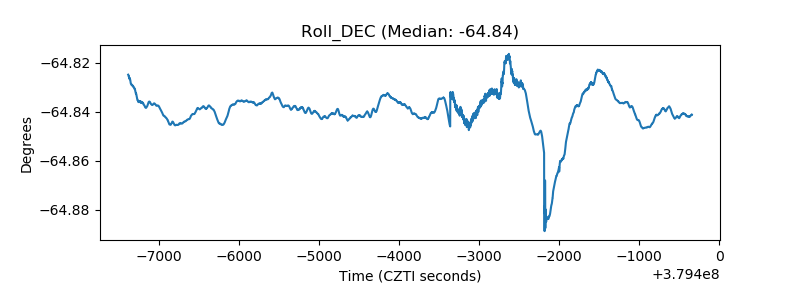 |
| _Roll_RA | 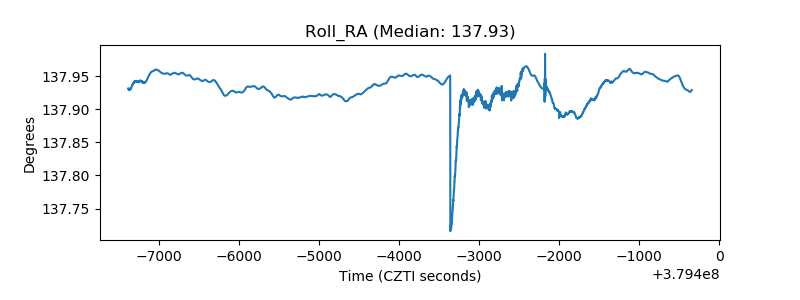 |
| Veto Counter | 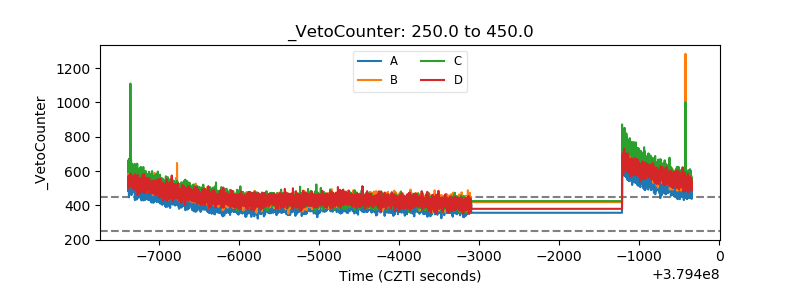 |