| Param | Original file | Final file |
|---|---|---|
| Filename | modeM0/AS1A11_037T01_9000004858_33972cztM0_level2.evt | modeM0/AS1A11_037T01_9000004858_33972cztM0_level2_quad_clean.evt |
| Size (bytes) | 696,294,720 | 70,459,200 |
| Size | 664.0 MB | 67.2 MB |
| Events in quadrant A | 8,176,950 | 189,755 |
| Events in quadrant B | 3,320,898 | 555,840 |
| Events in quadrant C | 3,238,706 | 543,844 |
| Events in quadrant D | 6,005,234 | 485,124 |
| Mode M0 | |||
|---|---|---|---|
| Quadrant | BADHDUFLAG | Total packets | Discarded packets |
| A | 0 | 27902 | 3 |
| B | 0 | 13044 | 2 |
| C | 0 | 12904 | 2 |
| D | 0 | 21460 | 2 |
| Mode SS | |||
|---|---|---|---|
| Quadrant | BADHDUFLAG | Total packets | Discarded packets |
| A | 0 | 104 | 0 |
| B | 0 | 104 | 0 |
| C | 0 | 104 | 0 |
| D | 0 | 104 | 0 |
| Mode M9 | |||
|---|---|---|---|
| Quadrant | BADHDUFLAG | Total packets | Discarded packets |
| A | 0 | 20 | 0 |
| B | 0 | 20 | 0 |
| C | 0 | 20 | 0 |
| D | 0 | 20 | 0 |
| Quadrant | Total seconds | Saturated seconds | Saturation percentage |
|---|---|---|---|
| A | 5097 | 4410 | 86.521483% |
| B | 5097 | 106 | 2.079655% |
| C | 5097 | 80 | 1.569551% |
| D | 5098 | 656 | 12.867791% |
Noise dominated data is calculated using 1-second bins in cleaned event files. If a bin has >2000 counts, and if more than 50% of those come from <1% of pixels, then it is considered to be noise-dominated and hence unusable.
| Quadrant | # 1 sec bins | Bins with >0 counts | Bins with >2000 counts | High rate bins dominated by noise | Noise dominated (total time) | Noise dominated (detector-on time) | Marked lightcurve |
|---|---|---|---|---|---|---|---|
| A | 7099 | 5096 | 1231 | 1231 | 17.34% | 24.16% | 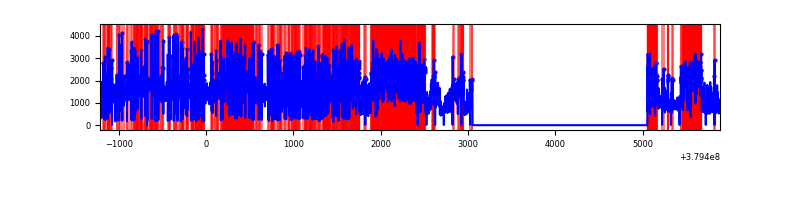 |
| B | 7100 | 5098 | 80 | 80 | 1.13% | 1.57% | 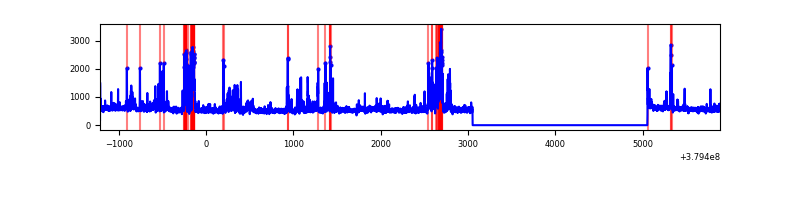 |
| C | 7100 | 5098 | 56 | 56 | 0.79% | 1.10% | 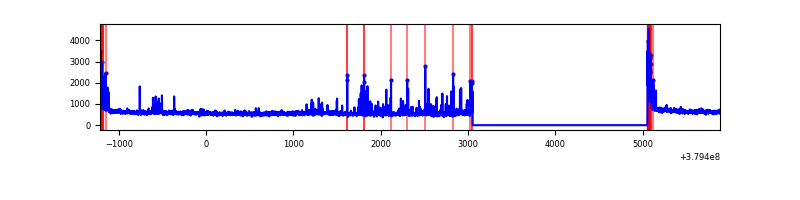 |
| D | 7101 | 5099 | 619 | 619 | 8.72% | 12.14% | 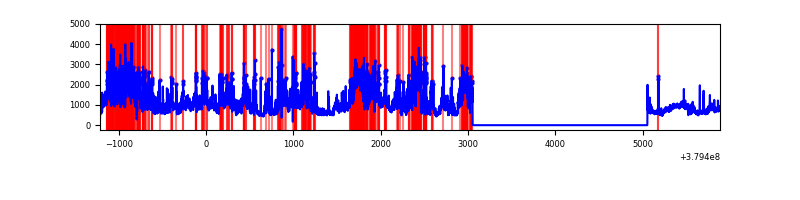 |
Top three noisy pixels from each quadrant. If the there are fewer than three noisy pixels in the level2.evt file, extra rows are filled as -1
| Pixel properties | Quadrant properties | ||||||
|---|---|---|---|---|---|---|---|
| Quadrant | DetID | PixID | Counts | Sigma | Mean | Median | Sigma |
| A | 15 | 169 | 7003222 | 117425.68 | 297 | 293 | 59.6 |
| A | 10 | 83 | 8363 | 135.32 | 297 | 293 | 59.6 |
| A | 7 | 16 | 7436 | 119.77 | 297 | 293 | 59.6 |
| B | 5 | 172 | 495678 | 4056.94 | 656 | 640 | 122.0 |
| B | 0 | 190 | 136622 | 1114.4 | 656 | 640 | 122.0 |
| B | 0 | 229 | 24866 | 198.54 | 656 | 640 | 122.0 |
| C | 0 | 10 | 280078 | 1887.2 | 652 | 659 | 148.1 |
| C | 15 | 214 | 222579 | 1498.85 | 652 | 659 | 148.1 |
| C | 3 | 233 | 166992 | 1123.42 | 652 | 659 | 148.1 |
| D | 12 | 33 | 1741345 | 11386.75 | 628 | 610 | 152.9 |
| D | 8 | 195 | 855376 | 5591.32 | 628 | 610 | 152.9 |
| D | 2 | 250 | 427398 | 2791.77 | 628 | 610 | 152.9 |
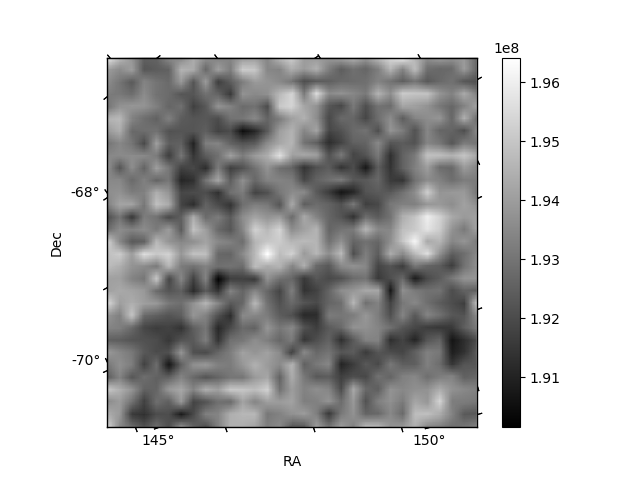
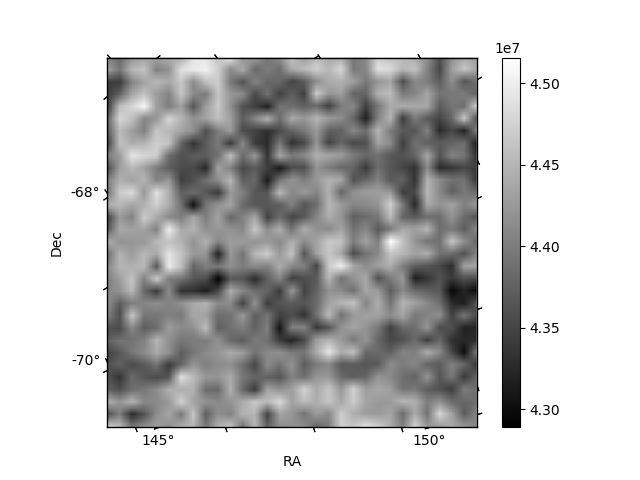
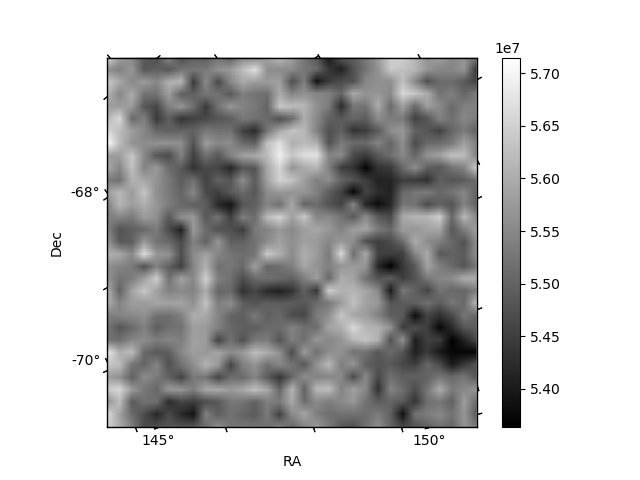
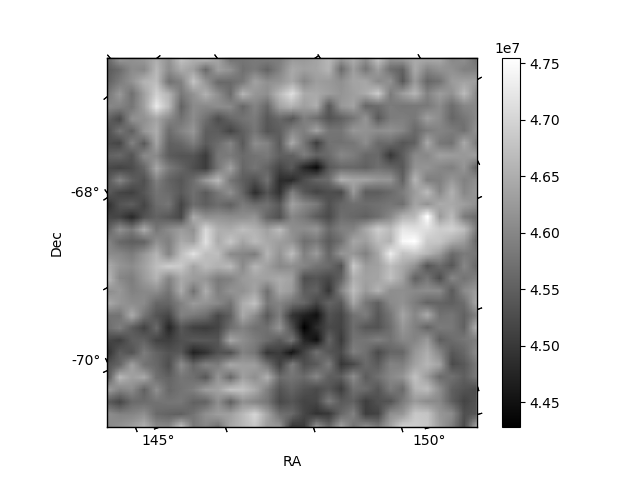
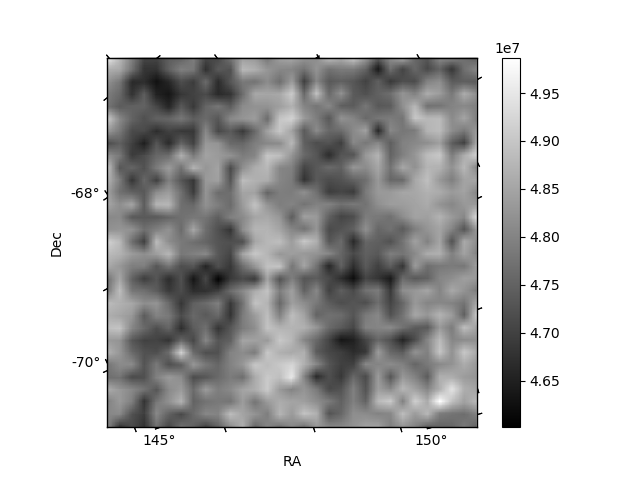
Histogram calculated using DETX and DETY for each event in the final _common_clean file
| Quadrant A | 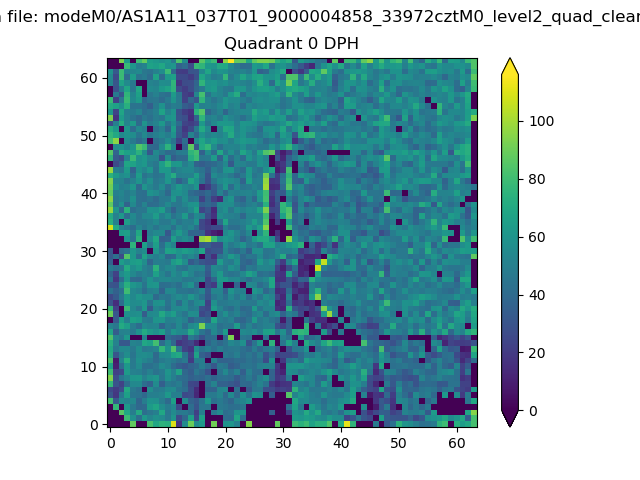 |
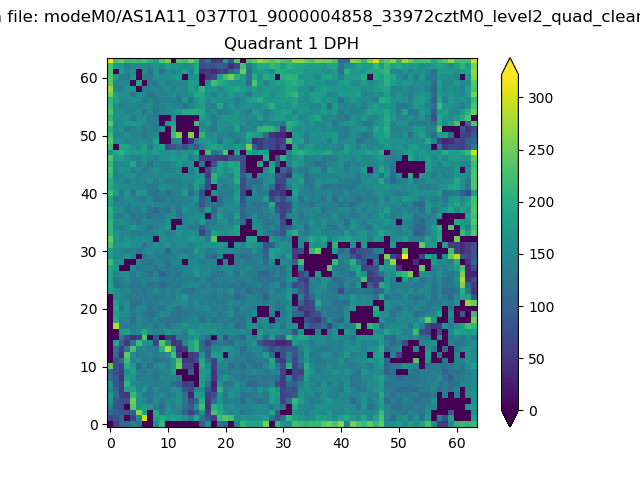 |
Quadrant B |
|---|---|---|---|
| Quadrant D | 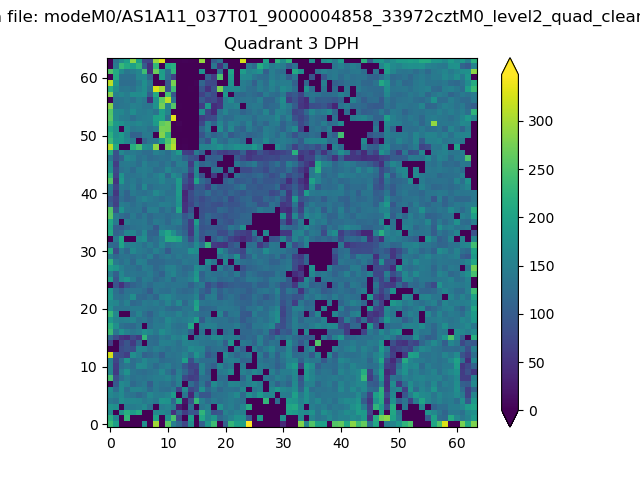 |
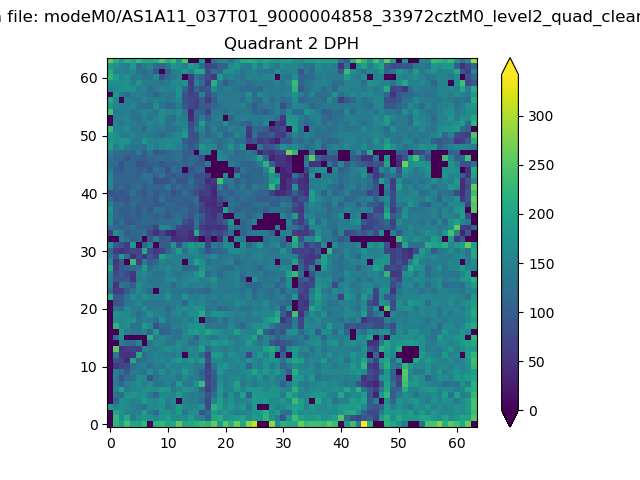 |
Quadrant C |
| Plot type | Count rate plots | Images |
|---|---|---|
| Comparison with Poisson distribution Blue bars denote a histogram of data divided into 1 sec bins. Red curve is a Poisson curve with rate = median count rate of data. |
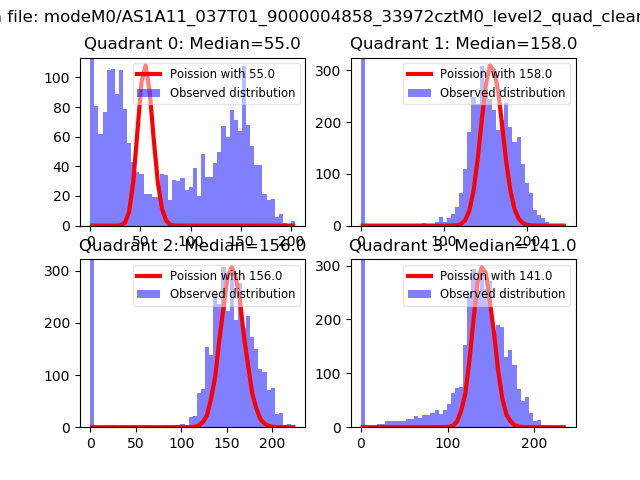 |
 |
| Quadrant-wise count rates Data is divided into 100 sec bins |
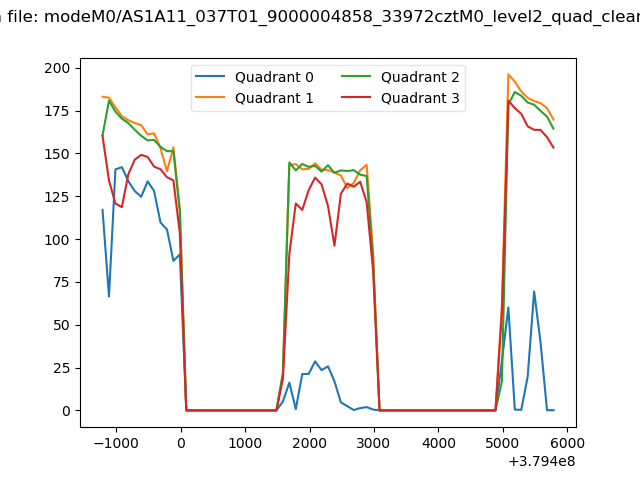 |
|
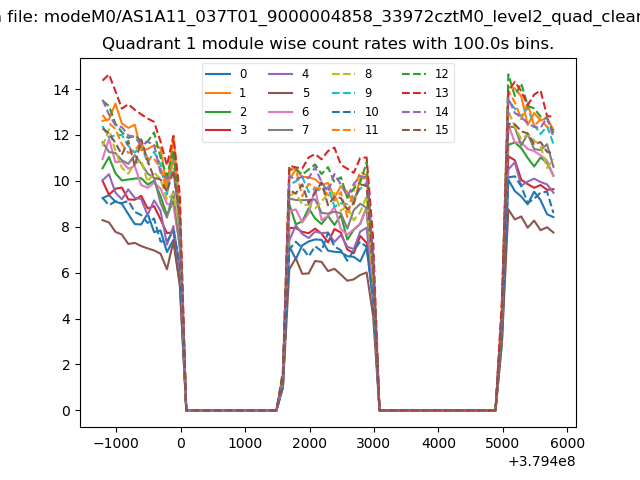
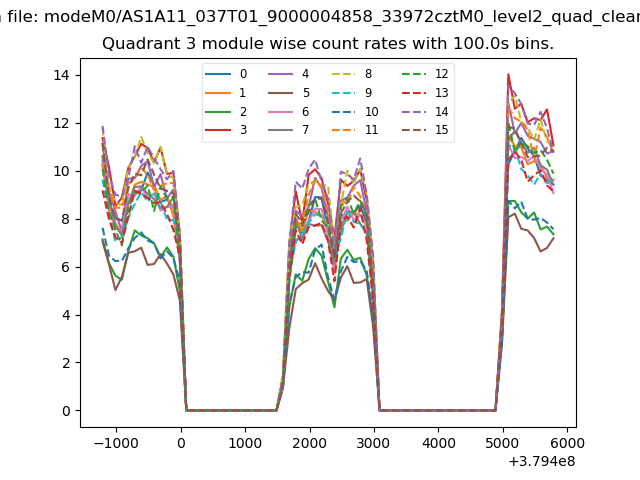
| Module-wise count rates for Quadrant A Data is divided into 100 sec bins |
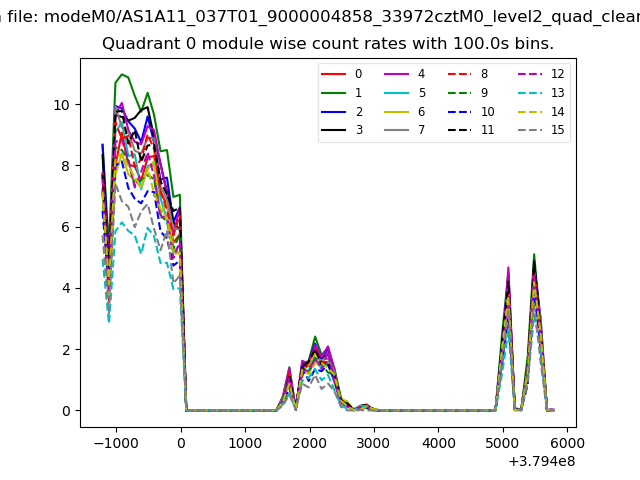 |
 |
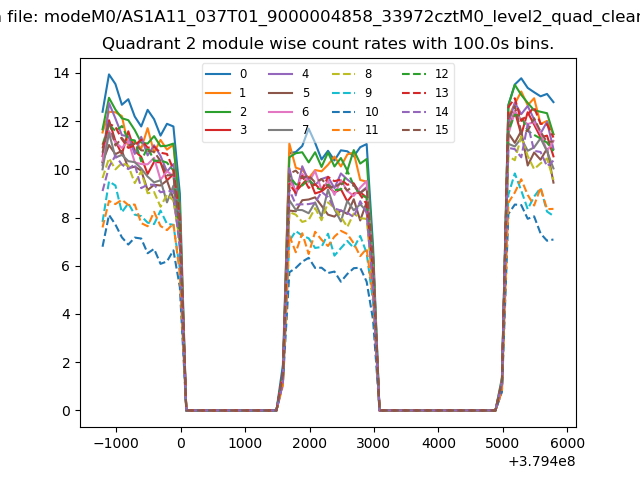
| Module-wise count rates for Quadrant B Data is divided into 100 sec bins |
 |
 |
| Module-wise count rates for Quadrant C Data is divided into 100 sec bins |
 |
 |
| Module-wise count rates for Quadrant D Data is divided into 100 sec bins |
 |
 |
| Parameter | Plot |
|---|---|
| CZT HV Monitor | 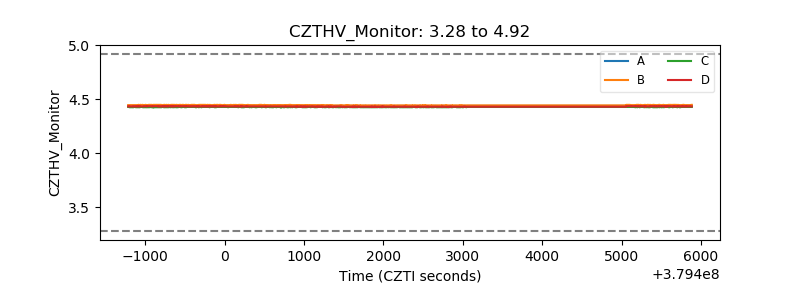 |
| D_VDD | 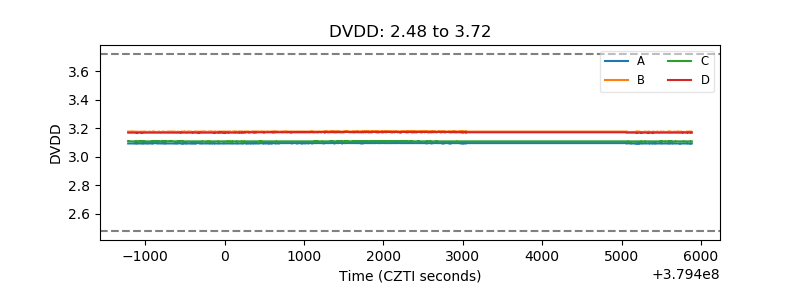 |
| Temperature 1 | 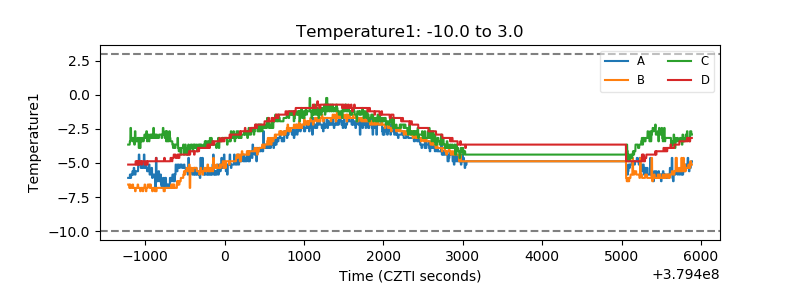 |
| Veto HV Monitor |  |
| Veto LLD | 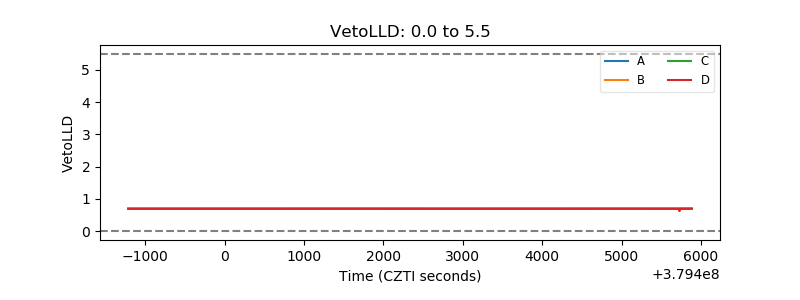 |
| Alpha Counter | 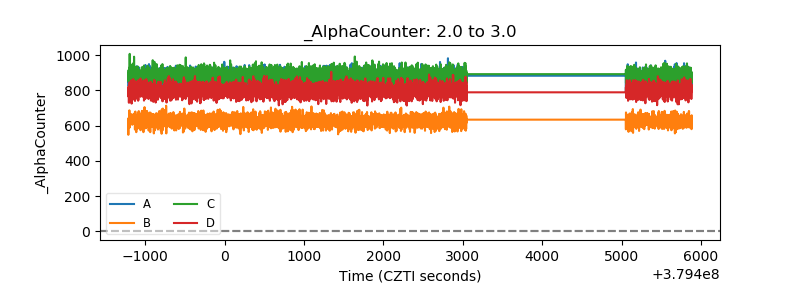 |
| _CPM_Rate |  |
| CZT Counter | 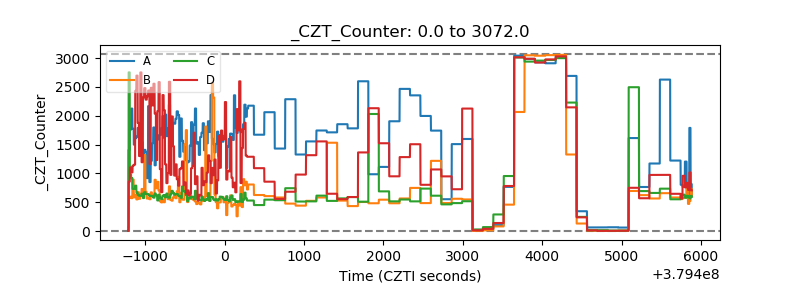 |
| +2.5 Volts monitor |  |
| +5 Volts monitor |  |
| _ROLL_ROT | 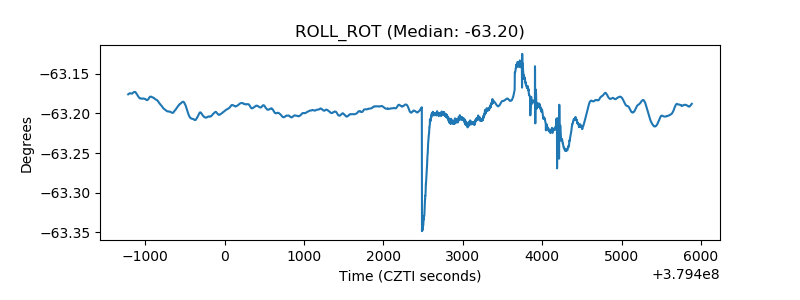 |
| _Roll_DEC | 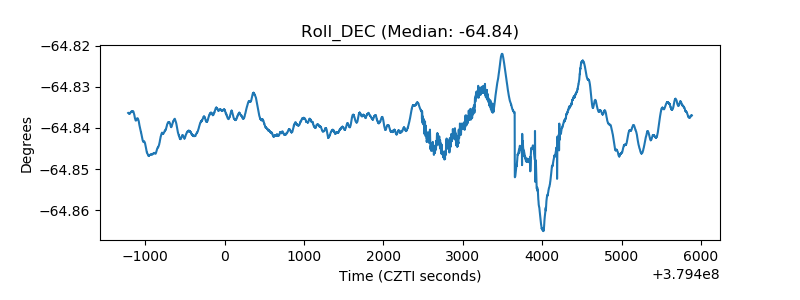 |
| _Roll_RA | 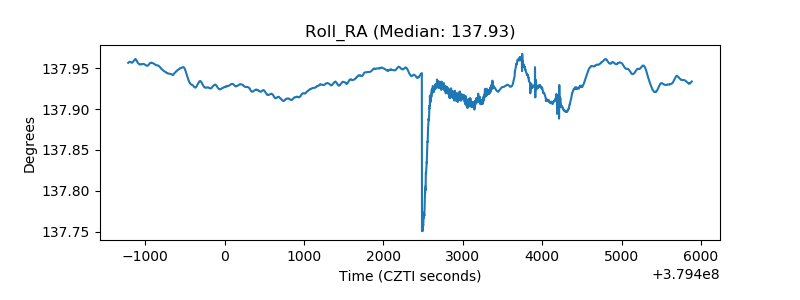 |
| Veto Counter | 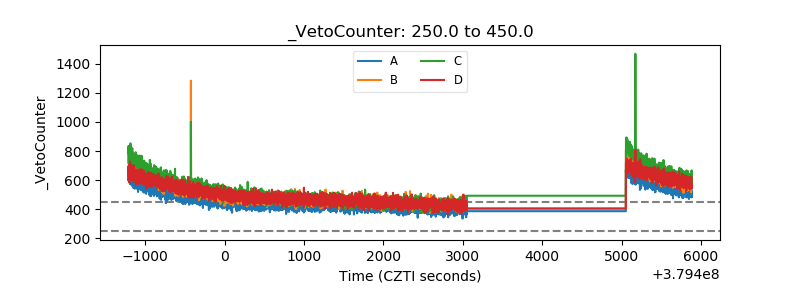 |