| Param | Original file | Final file |
|---|---|---|
| Filename | modeM0/AS1A11_037T01_9000004858_33973cztM0_level2.evt | modeM0/AS1A11_037T01_9000004858_33973cztM0_level2_quad_clean.evt |
| Size (bytes) | 695,543,040 | 56,111,040 |
| Size | 663.3 MB | 53.5 MB |
| Events in quadrant A | 8,393,764 | 51,041 |
| Events in quadrant B | 3,297,077 | 460,290 |
| Events in quadrant C | 3,143,133 | 444,208 |
| Events in quadrant D | 5,902,818 | 402,797 |
| Mode M0 | |||
|---|---|---|---|
| Quadrant | BADHDUFLAG | Total packets | Discarded packets |
| A | 0 | 29895 | 1565 |
| B | 0 | 13454 | 487 |
| C | 0 | 13161 | 605 |
| D | 0 | 21851 | 906 |
| Mode SS | |||
|---|---|---|---|
| Quadrant | BADHDUFLAG | Total packets | Discarded packets |
| A | 0 | 102 | 4 |
| B | 0 | 102 | 4 |
| C | 0 | 102 | 8 |
| D | 0 | 102 | 4 |
| Mode M9 | |||
|---|---|---|---|
| Quadrant | BADHDUFLAG | Total packets | Discarded packets |
| A | 0 | 26 | 8 |
| B | 0 | 26 | 11 |
| C | 0 | 26 | 11 |
| D | 0 | 27 | 8 |
| Quadrant | Total seconds | Saturated seconds | Saturation percentage |
|---|---|---|---|
| A | 4809 | 4804 | 99.896028% |
| B | 4849 | 124 | 2.557228% |
| C | 4840 | 97 | 2.004132% |
| D | 4839 | 854 | 17.648274% |
Noise dominated data is calculated using 1-second bins in cleaned event files. If a bin has >2000 counts, and if more than 50% of those come from <1% of pixels, then it is considered to be noise-dominated and hence unusable.
| Quadrant | # 1 sec bins | Bins with >0 counts | Bins with >2000 counts | High rate bins dominated by noise | Noise dominated (total time) | Noise dominated (detector-on time) | Marked lightcurve |
|---|---|---|---|---|---|---|---|
| A | 7111 | 4837 | 2253 | 2253 | 31.68% | 46.58% | 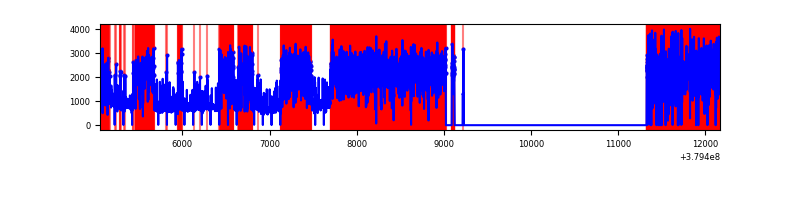 |
| B | 7112 | 4870 | 86 | 86 | 1.21% | 1.77% | 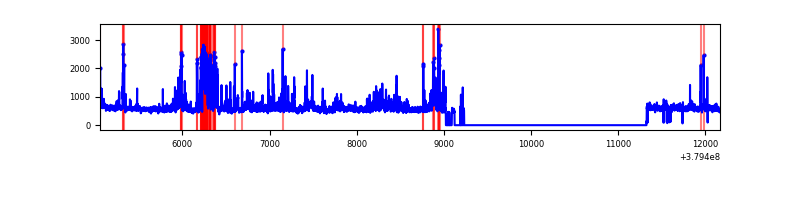 |
| C | 7112 | 4866 | 68 | 68 | 0.96% | 1.40% | 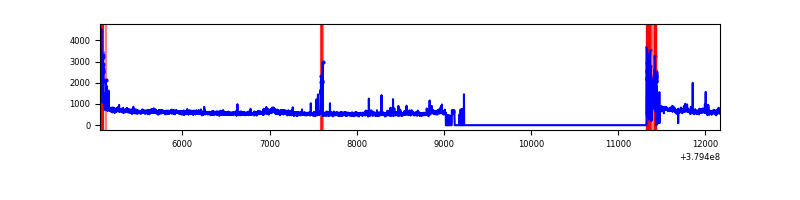 |
| D | 7112 | 4864 | 771 | 771 | 10.84% | 15.85% | 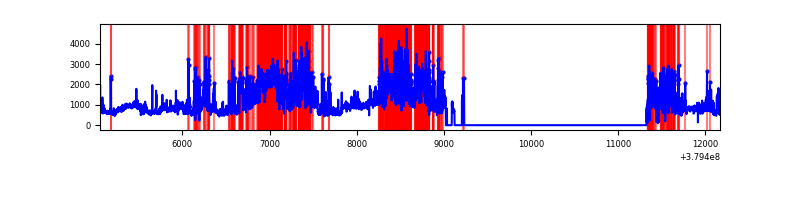 |
Top three noisy pixels from each quadrant. If the there are fewer than three noisy pixels in the level2.evt file, extra rows are filled as -1
| Pixel properties | Quadrant properties | ||||||
|---|---|---|---|---|---|---|---|
| Quadrant | DetID | PixID | Counts | Sigma | Mean | Median | Sigma |
| A | 15 | 169 | 8006141 | 381949.27 | 98 | 96 | 21.0 |
| A | 10 | 83 | 4296 | 200.37 | 98 | 96 | 21.0 |
| A | 13 | 254 | 1444 | 64.31 | 98 | 96 | 21.0 |
| B | 5 | 172 | 440346 | 3765.43 | 638 | 624 | 116.8 |
| B | 0 | 190 | 128309 | 1093.39 | 638 | 624 | 116.8 |
| B | 0 | 219 | 55132 | 466.76 | 638 | 624 | 116.8 |
| C | 3 | 233 | 226995 | 1594.03 | 630 | 635 | 142.0 |
| C | 15 | 214 | 213803 | 1501.13 | 630 | 635 | 142.0 |
| C | 0 | 10 | 182553 | 1281.07 | 630 | 635 | 142.0 |
| D | 12 | 33 | 1678362 | 11514.39 | 602 | 586 | 145.7 |
| D | 8 | 195 | 840424 | 5763.72 | 602 | 586 | 145.7 |
| D | 2 | 250 | 493406 | 3382.17 | 602 | 586 | 145.7 |
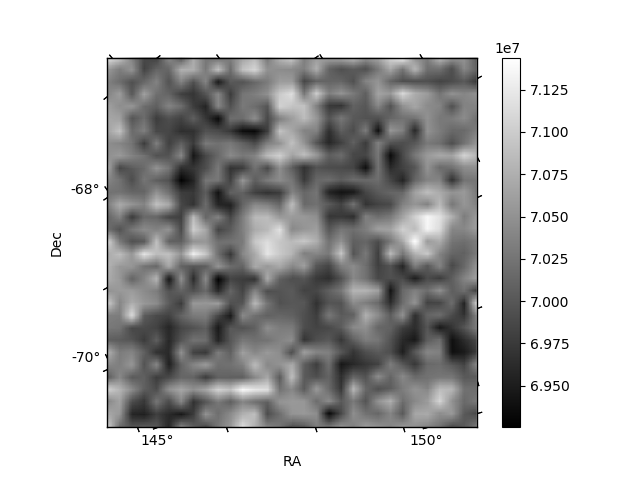
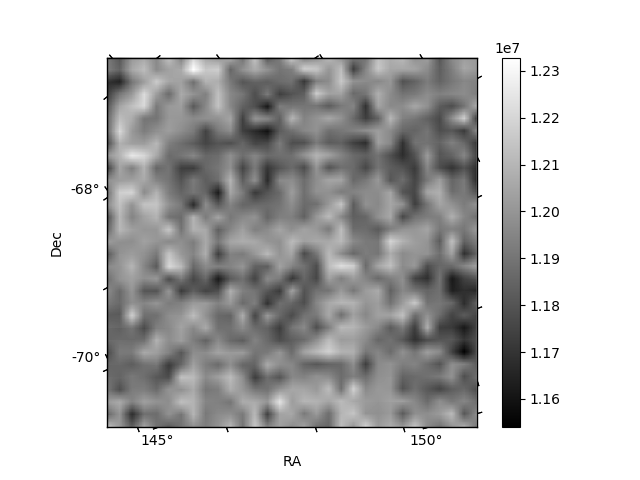
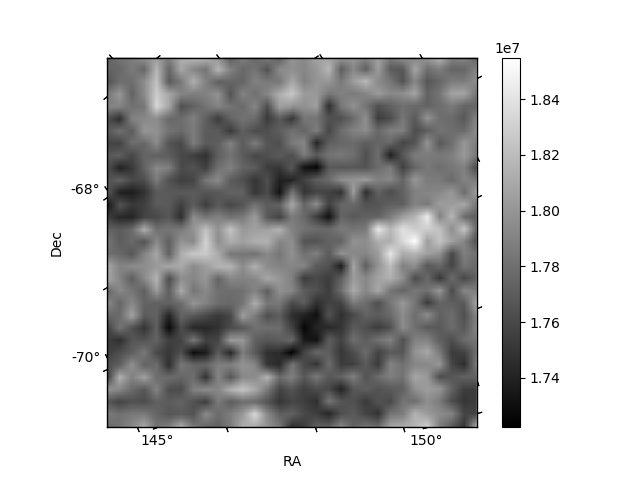
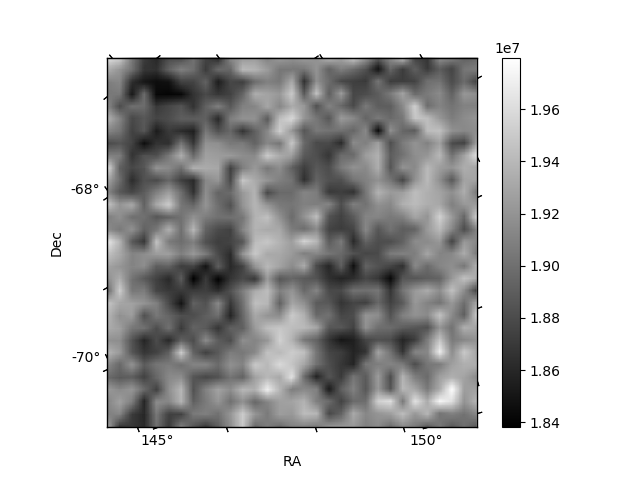
Histogram calculated using DETX and DETY for each event in the final _common_clean file
| Quadrant A | 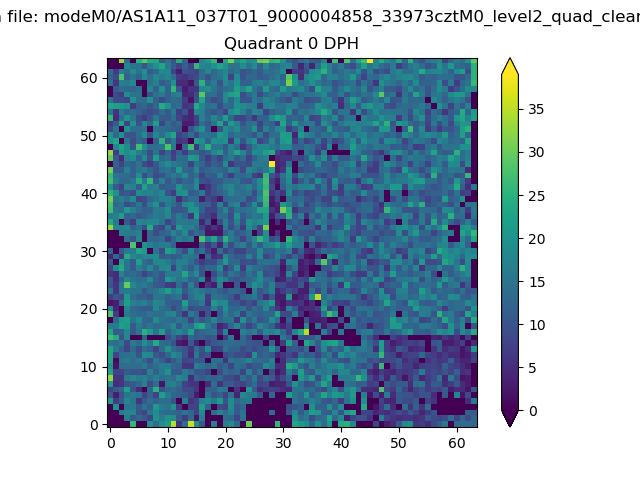 |
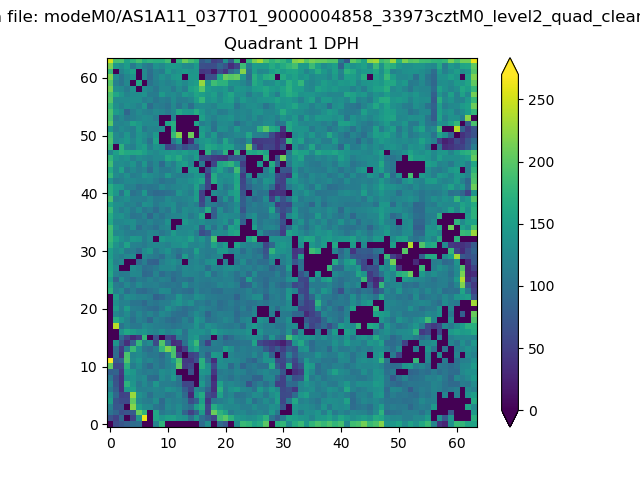 |
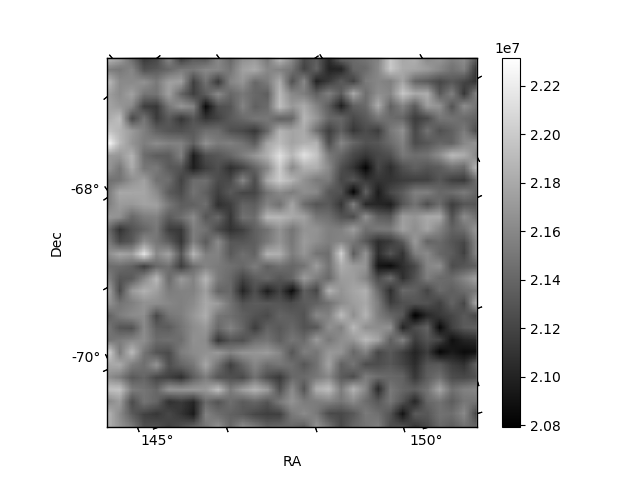
Quadrant B |
|---|---|---|---|
| Quadrant D | 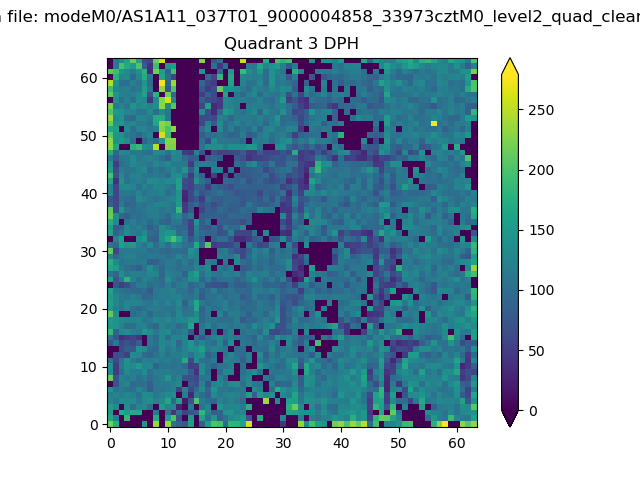 |
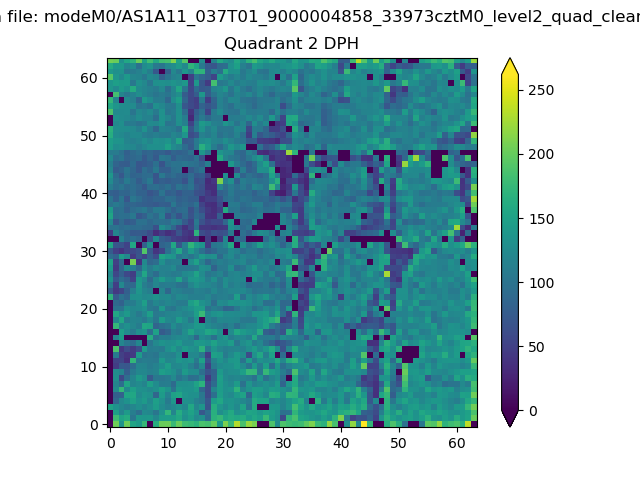 |
Quadrant C |
| Plot type | Count rate plots | Images |
|---|---|---|
| Comparison with Poisson distribution Blue bars denote a histogram of data divided into 1 sec bins. Red curve is a Poisson curve with rate = median count rate of data. |
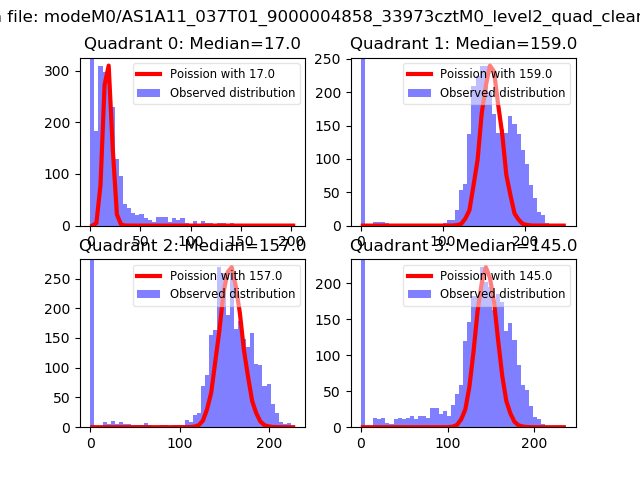 |
 |
| Quadrant-wise count rates Data is divided into 100 sec bins |
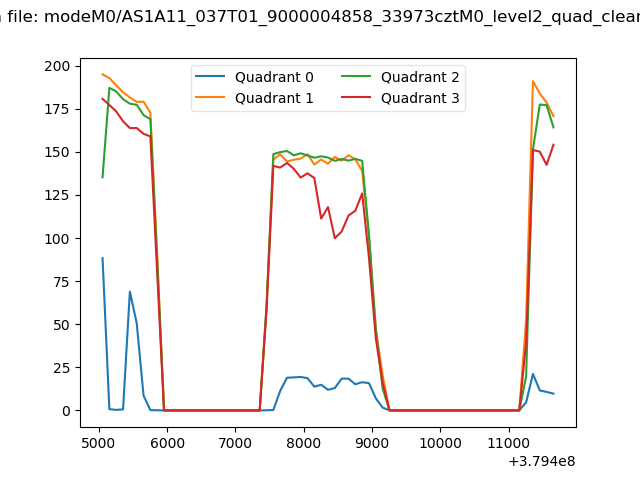 |
|
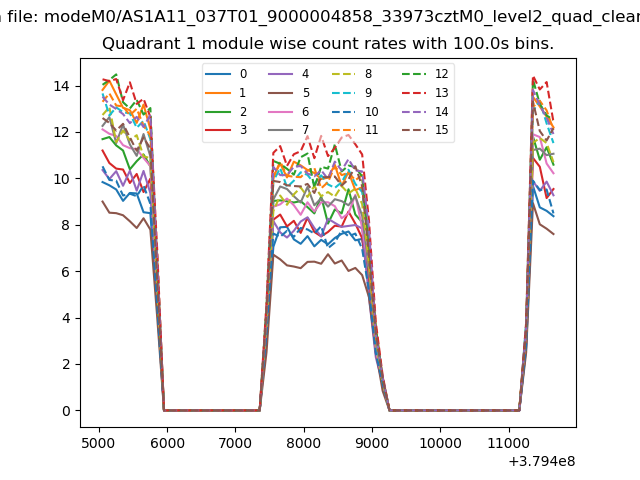
| Module-wise count rates for Quadrant A Data is divided into 100 sec bins |
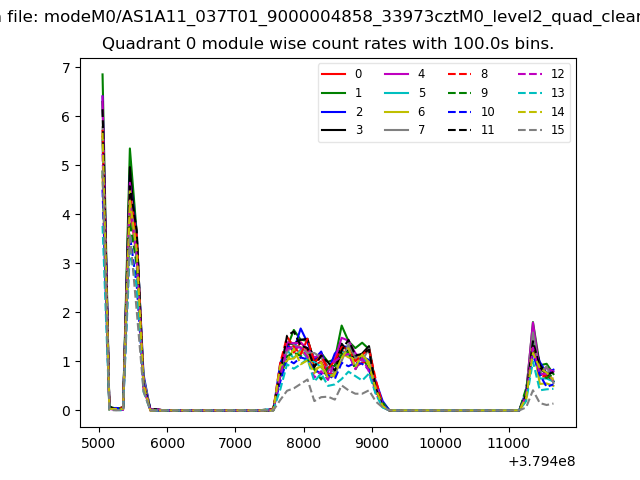 |
 |
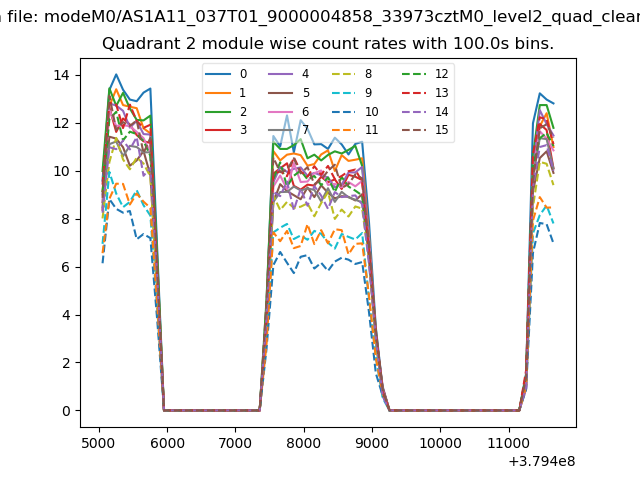
| Module-wise count rates for Quadrant B Data is divided into 100 sec bins |
 |
 |
| Module-wise count rates for Quadrant C Data is divided into 100 sec bins |
 |
 |
| Module-wise count rates for Quadrant D Data is divided into 100 sec bins |
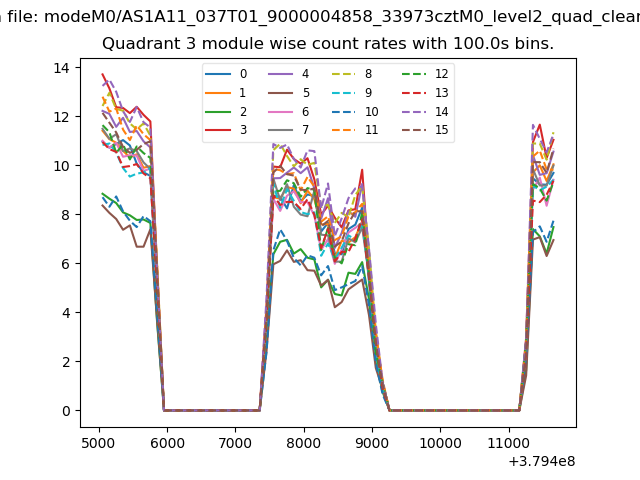 |
 |
| Parameter | Plot |
|---|---|
| CZT HV Monitor | 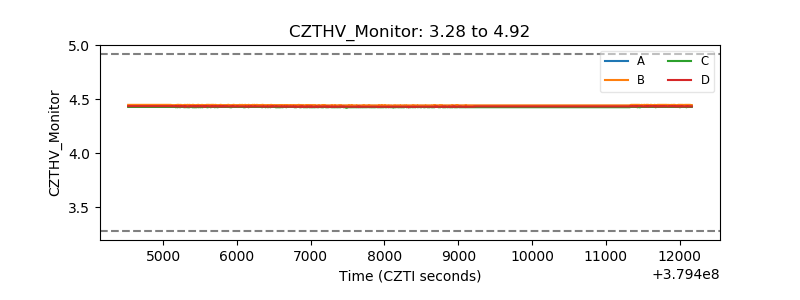 |
| D_VDD | 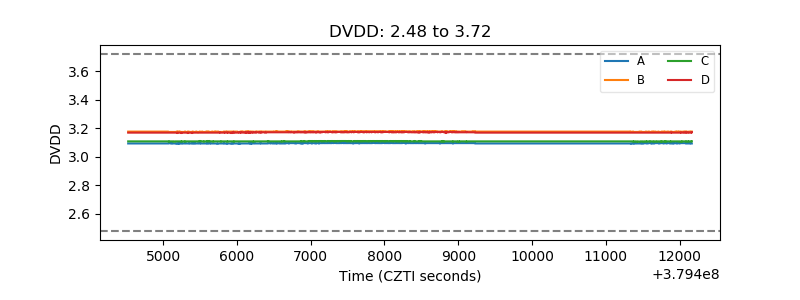 |
| Temperature 1 | 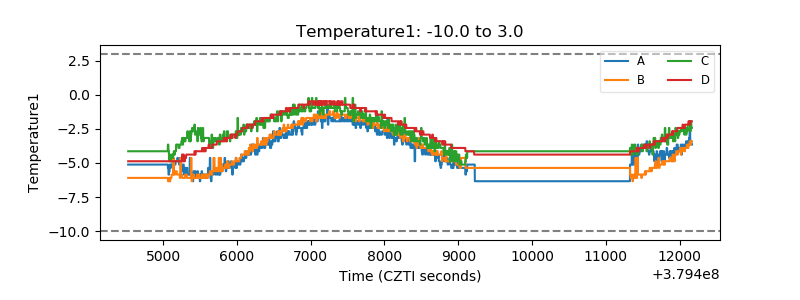 |
| Veto HV Monitor | 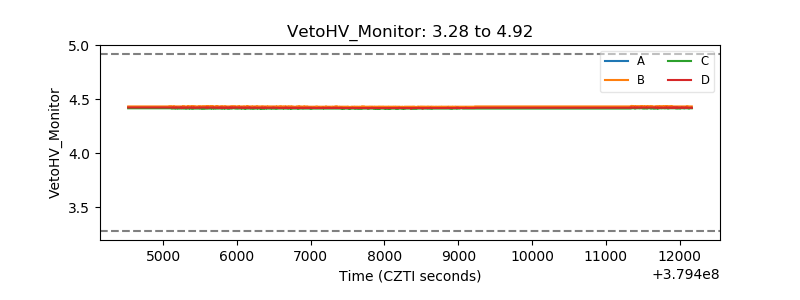 |
| Veto LLD | 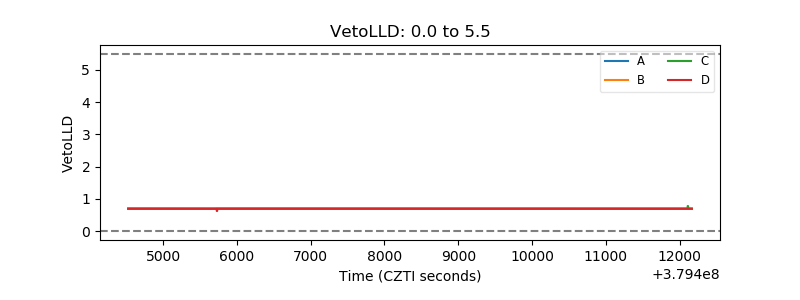 |
| Alpha Counter | 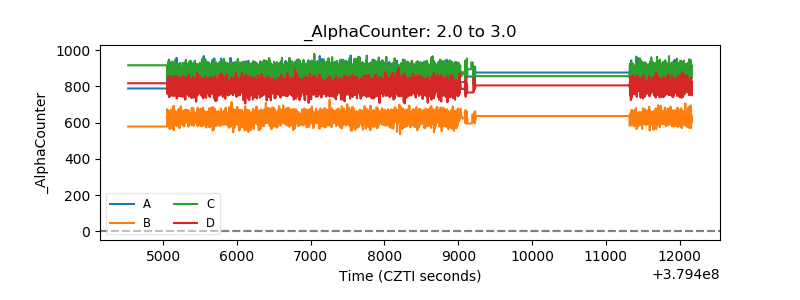 |
| _CPM_Rate | 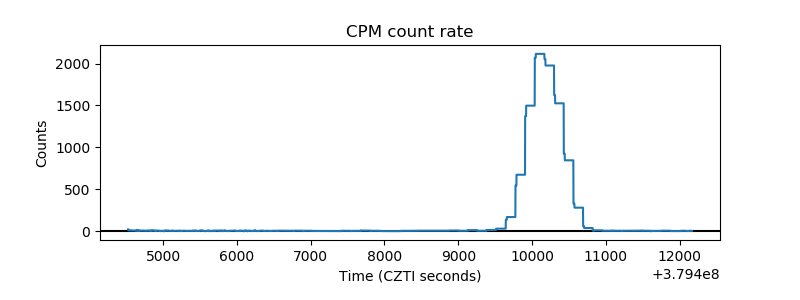 |
| CZT Counter | 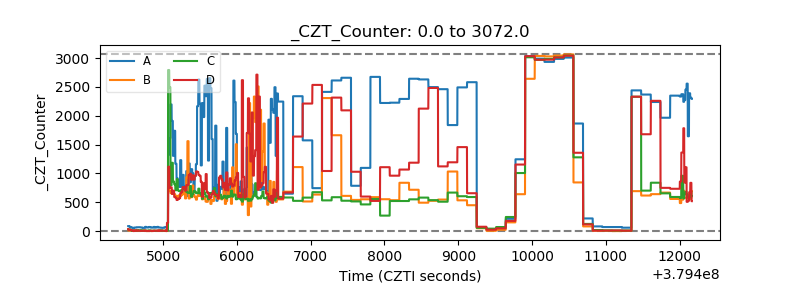 |
| +2.5 Volts monitor | 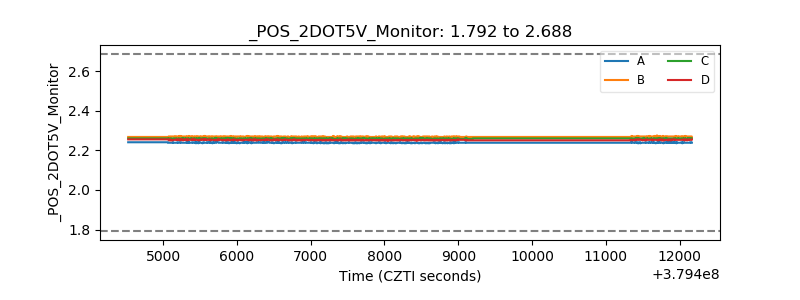 |
| +5 Volts monitor |  |
| _ROLL_ROT | 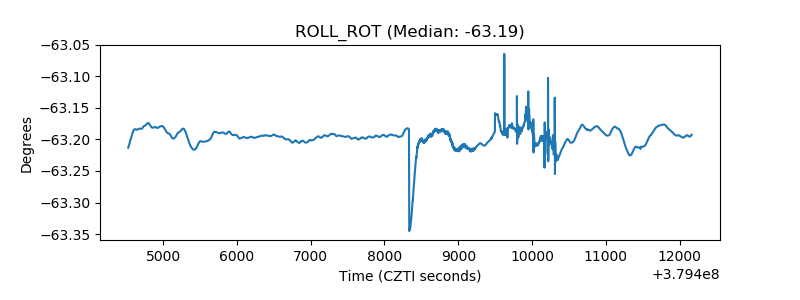 |
| _Roll_DEC | 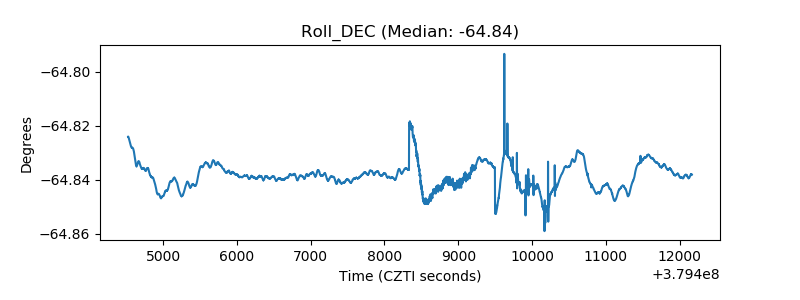 |
| _Roll_RA | 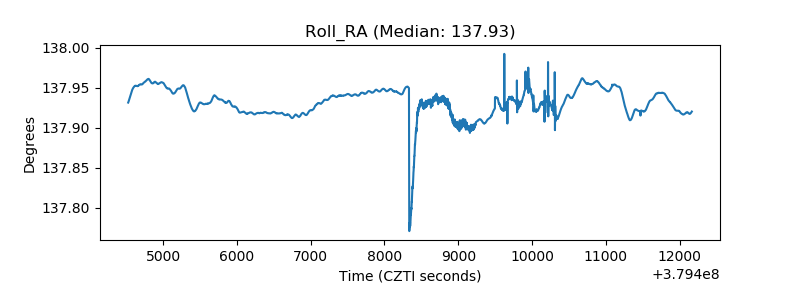 |
| Veto Counter | 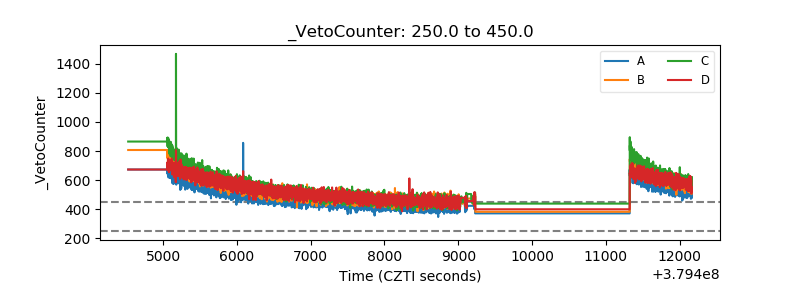 |