| Param | Original file | Final file |
|---|---|---|
| Filename | modeM0/AS1A11_037T01_9000004858_33974cztM0_level2.evt | modeM0/AS1A11_037T01_9000004858_33974cztM0_level2_quad_clean.evt |
| Size (bytes) | 548,818,560 | 32,938,560 |
| Size | 523.4 MB | 31.4 MB |
| Events in quadrant A | 7,076,756 | 12,413 |
| Events in quadrant B | 1,955,153 | 270,592 |
| Events in quadrant C | 2,492,746 | 260,416 |
| Events in quadrant D | 4,868,181 | 213,756 |
| Mode M0 | |||
|---|---|---|---|
| Quadrant | BADHDUFLAG | Total packets | Discarded packets |
| A | 0 | 23330 | 0 |
| B | 0 | 7871 | 0 |
| C | 0 | 9727 | 0 |
| D | 0 | 16792 | 0 |
| Mode SS | |||
|---|---|---|---|
| Quadrant | BADHDUFLAG | Total packets | Discarded packets |
| A | 0 | 68 | 0 |
| B | 0 | 68 | 0 |
| C | 0 | 68 | 0 |
| D | 0 | 68 | 0 |
| Quadrant | Total seconds | Saturated seconds | Saturation percentage |
|---|---|---|---|
| A | 3360 | 3360 | 100.000000% |
| B | 3360 | 6 | 0.178571% |
| C | 3360 | 135 | 4.017857% |
| D | 3360 | 992 | 29.523810% |
Noise dominated data is calculated using 1-second bins in cleaned event files. If a bin has >2000 counts, and if more than 50% of those come from <1% of pixels, then it is considered to be noise-dominated and hence unusable.
| Quadrant | # 1 sec bins | Bins with >0 counts | Bins with >2000 counts | High rate bins dominated by noise | Noise dominated (total time) | Noise dominated (detector-on time) | Marked lightcurve |
|---|---|---|---|---|---|---|---|
| A | 3360 | 3360 | 2025 | 2025 | 60.27% | 60.27% | 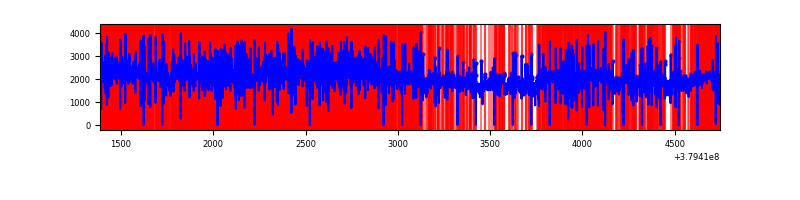 |
| B | 3360 | 3360 | 5 | 5 | 0.15% | 0.15% | 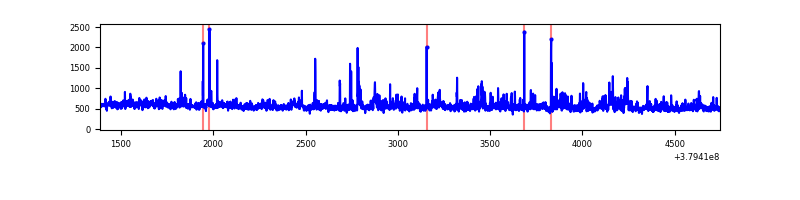 |
| C | 3360 | 3360 | 105 | 105 | 3.12% | 3.12% | 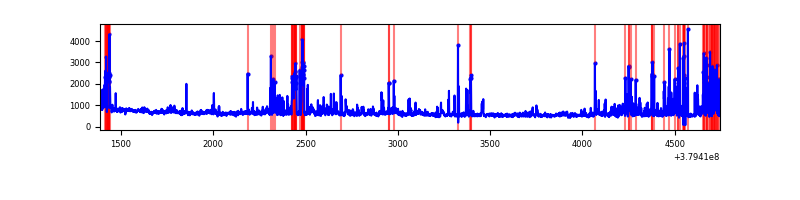 |
| D | 3360 | 3360 | 970 | 970 | 28.87% | 28.87% | 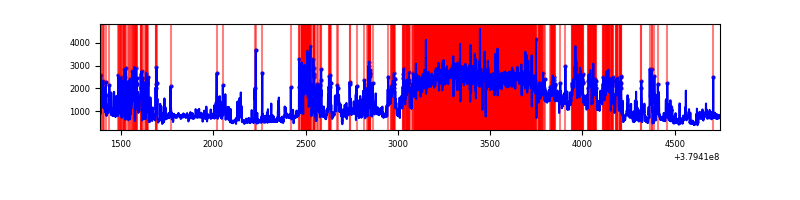 |
Top three noisy pixels from each quadrant. If the there are fewer than three noisy pixels in the level2.evt file, extra rows are filled as -1
| Pixel properties | Quadrant properties | ||||||
|---|---|---|---|---|---|---|---|
| Quadrant | DetID | PixID | Counts | Sigma | Mean | Median | Sigma |
| A | 15 | 169 | 6889297 | 610741.26 | 47 | 46 | 11.3 |
| A | 13 | 6 | 1536 | 132.09 | 47 | 46 | 11.3 |
| A | 13 | 254 | 799 | 66.75 | 47 | 46 | 11.3 |
| B | 5 | 172 | 82323 | 1015.52 | 434 | 424 | 80.6 |
| B | 0 | 190 | 70824 | 872.94 | 434 | 424 | 80.6 |
| B | 0 | 229 | 30585 | 373.99 | 434 | 424 | 80.6 |
| C | 4 | 254 | 451248 | 4773.56 | 420 | 425 | 94.4 |
| C | 15 | 214 | 146289 | 1544.49 | 420 | 425 | 94.4 |
| C | 0 | 10 | 111195 | 1172.89 | 420 | 425 | 94.4 |
| D | 12 | 33 | 1917161 | 19759.58 | 381 | 372 | 97.0 |
| D | 8 | 195 | 473493 | 4877.26 | 381 | 372 | 97.0 |
| D | 2 | 250 | 375286 | 3864.87 | 381 | 372 | 97.0 |
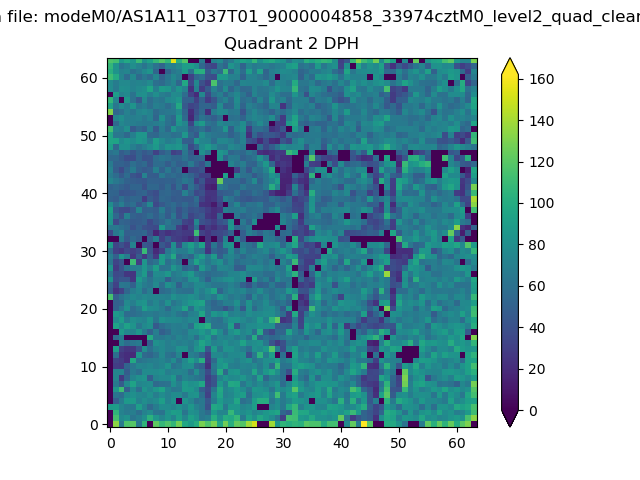
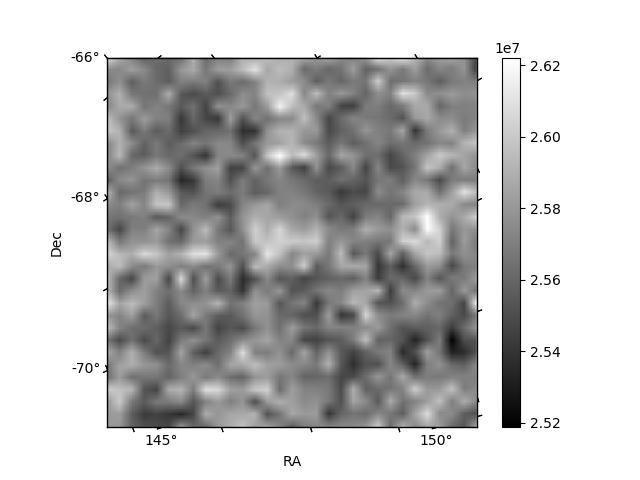
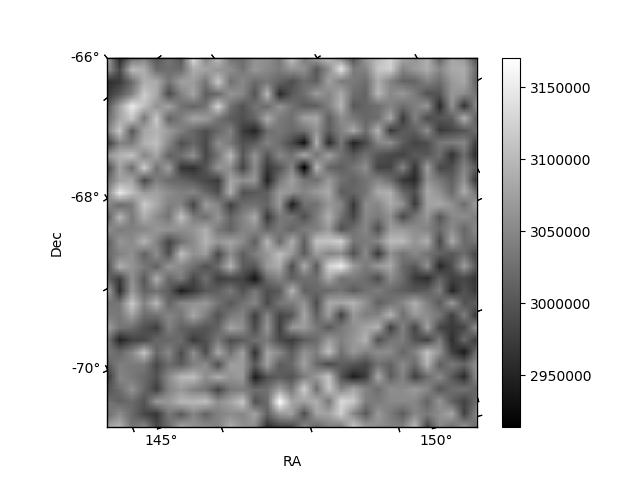
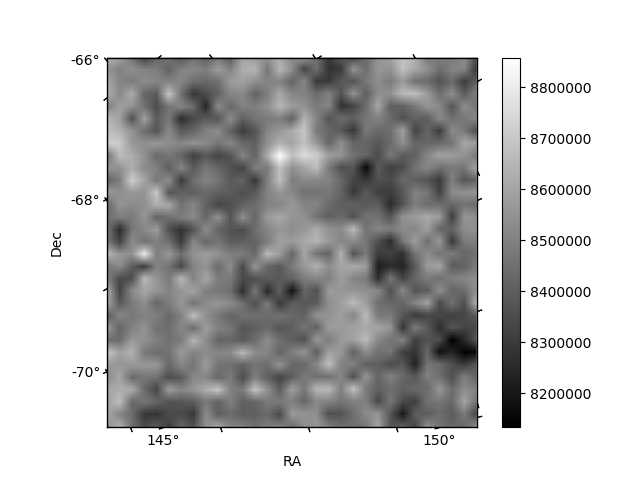
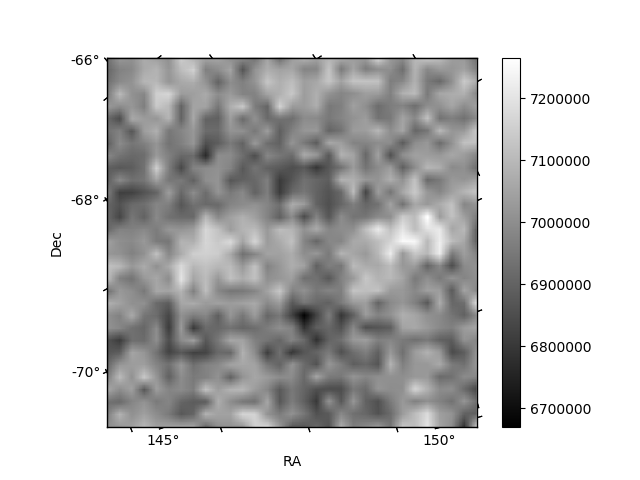
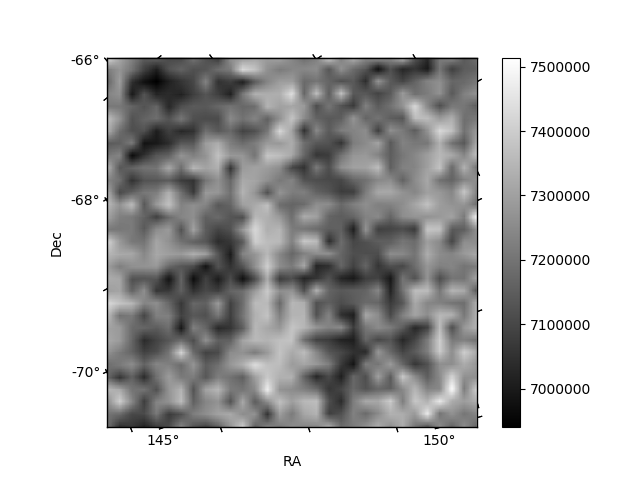
Histogram calculated using DETX and DETY for each event in the final _common_clean file
| Quadrant A | 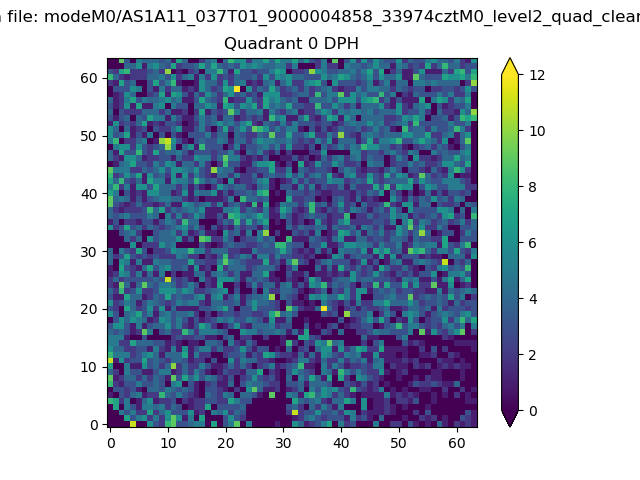 |
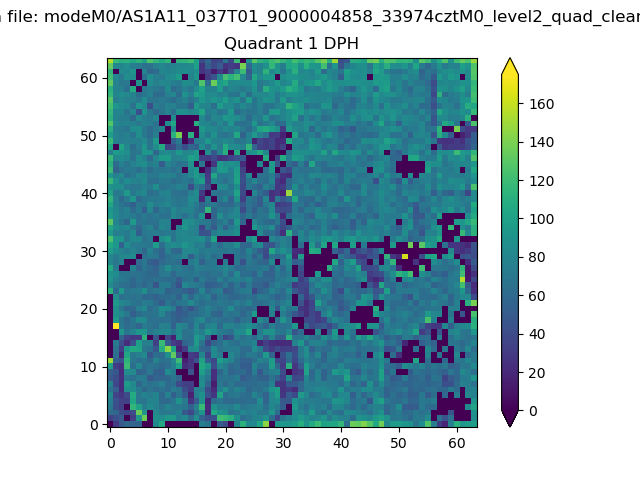 |
Quadrant B |
|---|---|---|---|
| Quadrant D | 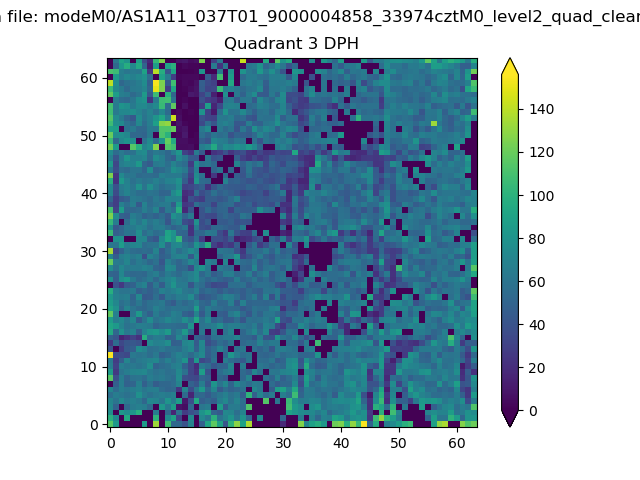 |
 |
Quadrant C |
| Plot type | Count rate plots | Images |
|---|---|---|
| Comparison with Poisson distribution Blue bars denote a histogram of data divided into 1 sec bins. Red curve is a Poisson curve with rate = median count rate of data. |
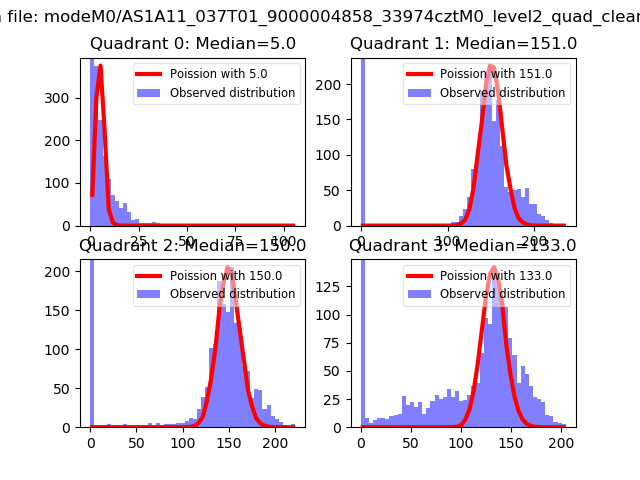 |
 |
| Quadrant-wise count rates Data is divided into 100 sec bins |
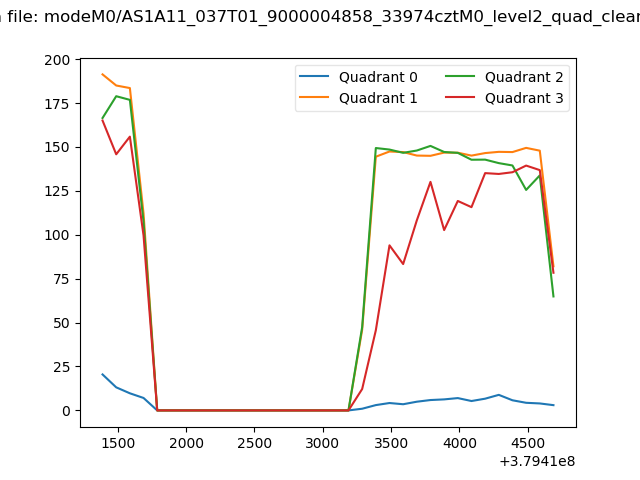 |
|
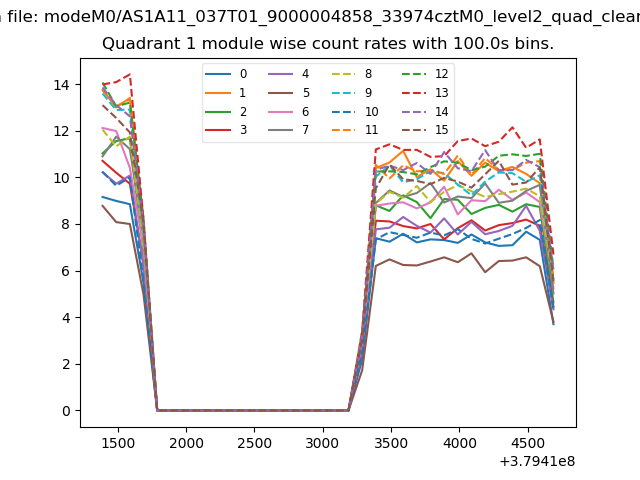
| Module-wise count rates for Quadrant A Data is divided into 100 sec bins |
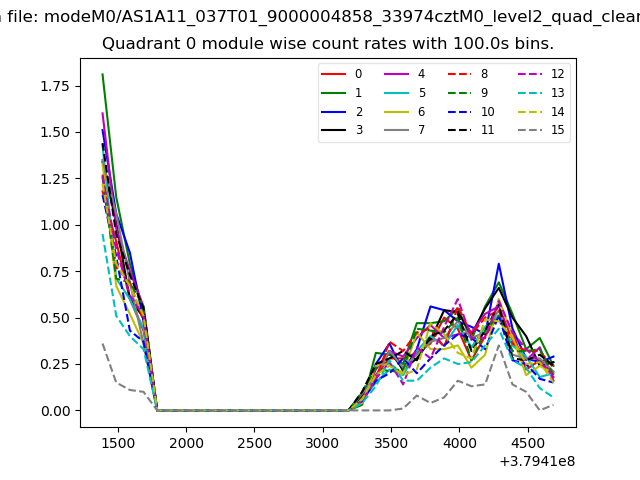 |
 |
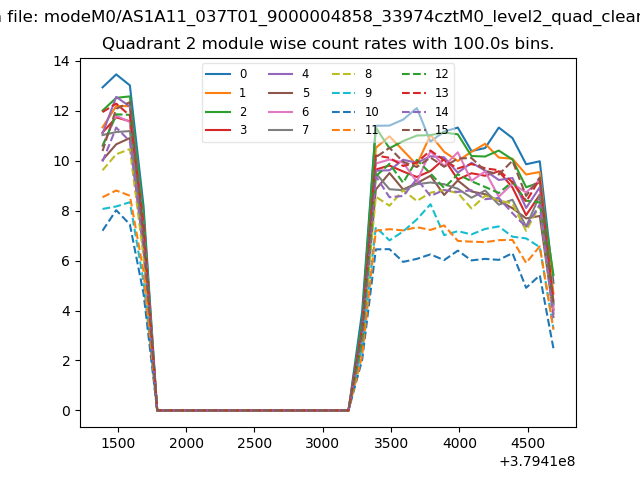
| Module-wise count rates for Quadrant B Data is divided into 100 sec bins |
 |
 |
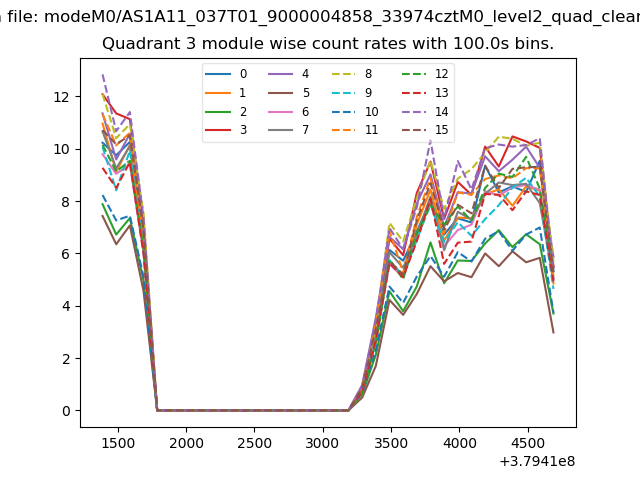
| Module-wise count rates for Quadrant C Data is divided into 100 sec bins |
 |
 |
| Module-wise count rates for Quadrant D Data is divided into 100 sec bins |
 |
 |
| Parameter | Plot |
|---|---|
| CZT HV Monitor | 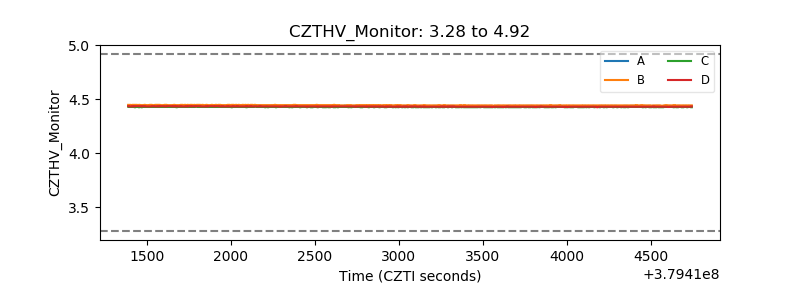 |
| D_VDD | 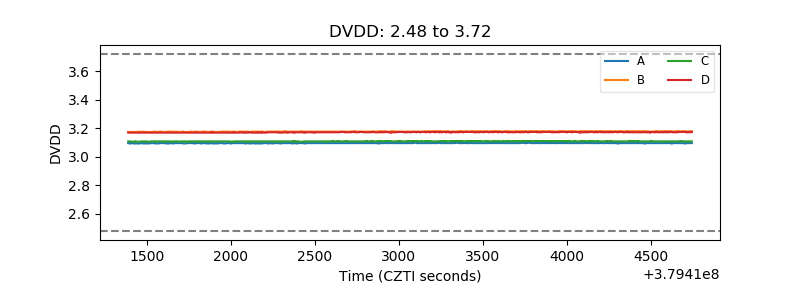 |
| Temperature 1 | 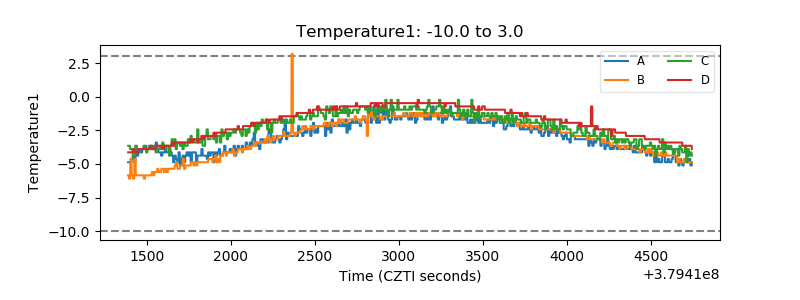 |
| Veto HV Monitor |  |
| Veto LLD | 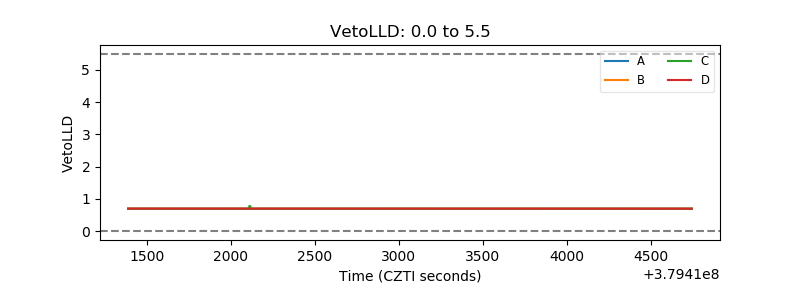 |
| Alpha Counter | 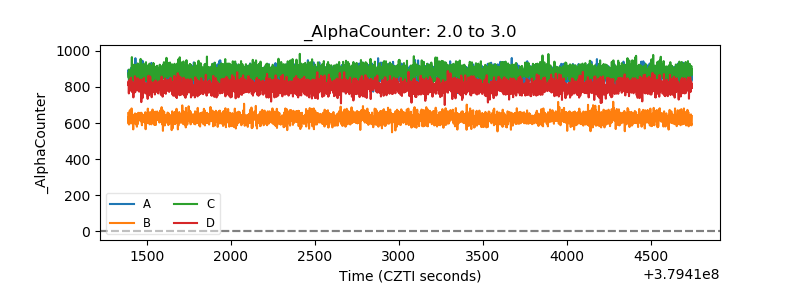 |
| _CPM_Rate |  |
| CZT Counter | 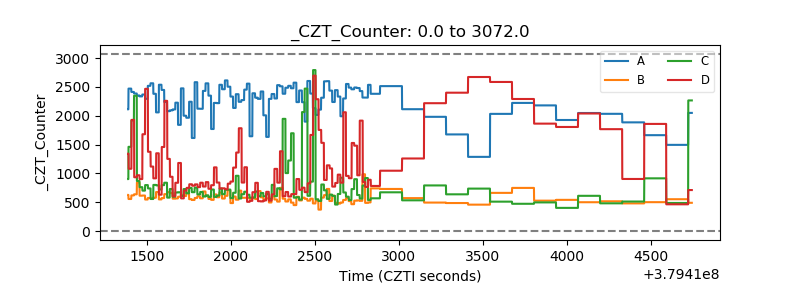 |
| +2.5 Volts monitor |  |
| +5 Volts monitor |  |
| _ROLL_ROT | 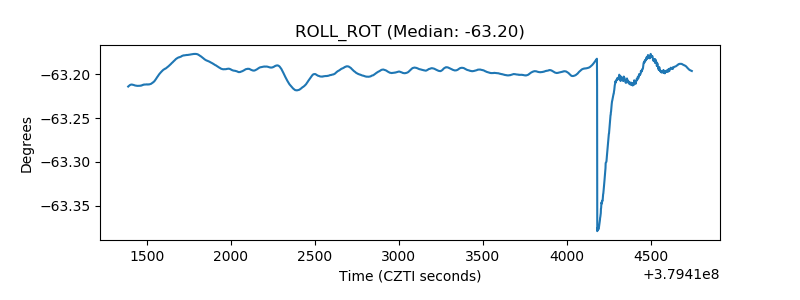 |
| _Roll_DEC | 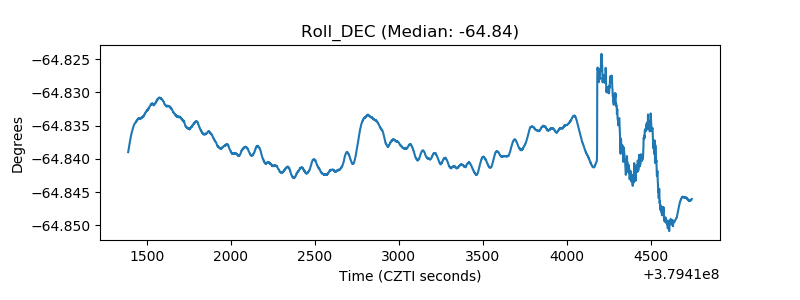 |
| _Roll_RA | 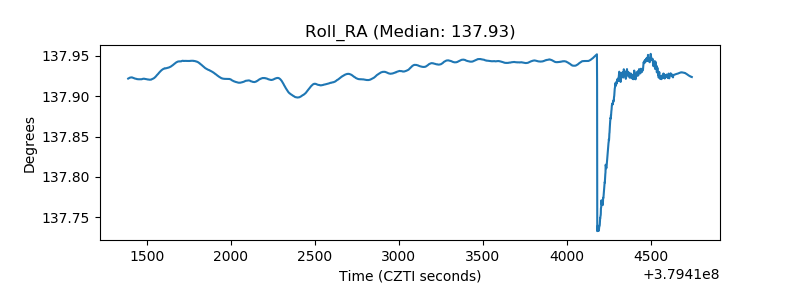 |
| Veto Counter | 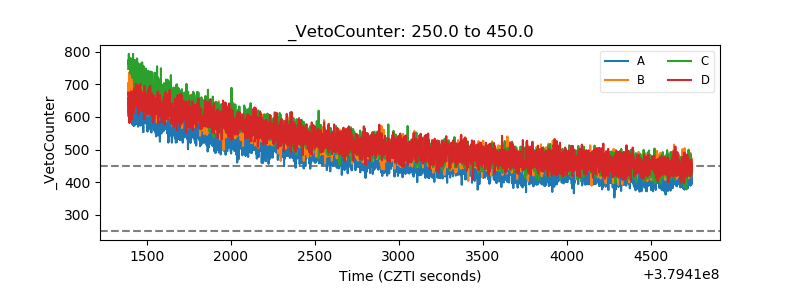 |