| Param | Original file | Final file |
|---|---|---|
| Filename | modeM0/AS1A11_058T01_9000004854cztM0_level2.fits | modeM0/AS1A11_058T01_9000004854cztM0_level2_quad_clean.evt |
| Size (bytes) | 234,996,480 | 223,516,800 |
| Size | 224.1 MB | 213.2 MB |
| Events in quadrant A | 1,517,666 | 1,404,841 |
| Events in quadrant B | 1,402,266 | 1,369,342 |
| Events in quadrant C | 1,429,710 | 1,288,249 |
| Events in quadrant D | 1,167,442 | 1,106,388 |
| Mode SS | |||
|---|---|---|---|
| Quadrant | BADHDUFLAG | Total packets | Discarded packets |
| A | 0 | 476 | 0 |
| B | 0 | 476 | 0 |
| C | 0 | 476 | 0 |
| D | 0 | 476 | 0 |
| Mode M9 | |||
|---|---|---|---|
| Quadrant | BADHDUFLAG | Total packets | Discarded packets |
| A | 0 | 115 | 0 |
| B | 0 | 115 | 0 |
| C | 0 | 115 | 0 |
| D | 0 | 115 | 0 |
| Mode M0 | |||
|---|---|---|---|
| Quadrant | BADHDUFLAG | Total packets | Discarded packets |
| A | 0 | 54494 | 0 |
| B | 0 | 58598 | 0 |
| C | 0 | 51302 | 0 |
| D | 0 | 86943 | 0 |
| Quadrant | Total seconds | Saturated seconds | Saturation percentage |
|---|---|---|---|
| A | 23229 | 173 | 0.744759% |
| B | 23229 | 791 | 3.405226% |
| C | 23229 | 233 | 1.003057% |
| D | 23229 | 2946 | 12.682423% |
Noise dominated data is calculated using 1-second bins in cleaned event files. If a bin has >2000 counts, and if more than 50% of those come from <1% of pixels, then it is considered to be noise-dominated and hence unusable.
| Quadrant | # 1 sec bins | Bins with >0 counts | Bins with >2000 counts | High rate bins dominated by noise | Noise dominated (total time) | Noise dominated (detector-on time) | Marked lightcurve |
|---|---|---|---|---|---|---|---|
| A | 33389 | 23228 | 0 | 0 | 0.00% | 0.00% |  |
| B | 33389 | 23224 | 0 | 0 | 0.00% | 0.00% |  |
| C | 33389 | 23228 | 0 | 0 | 0.00% | 0.00% |  |
| D | 33389 | 23191 | 0 | 0 | 0.00% | 0.00% |  |
Top three noisy pixels from each quadrant. If the there are fewer than three noisy pixels in the level2.evt file, extra rows are filled as -1
| Pixel properties | Quadrant properties | ||||||
|---|---|---|---|---|---|---|---|
| Quadrant | DetID | PixID | Counts | Sigma | Mean | Median | Sigma |
| A | 9 | 19 | 1260 | 8.92 | 396 | 377 | 99.0 |
| A | 7 | 110 | 1237 | 8.69 | 396 | 377 | 99.0 |
| A | 0 | 29 | 1221 | 8.53 | 396 | 377 | 99.0 |
| B | 2 | 9 | 1133 | 10.57 | 372 | 360 | 73.1 |
| B | 3 | 80 | 1082 | 9.88 | 372 | 360 | 73.1 |
| B | 5 | 128 | 986 | 8.56 | 372 | 360 | 73.1 |
| C | 1 | 81 | 1217 | 8.8 | 378 | 359 | 97.5 |
| C | 1 | 80 | 1158 | 8.19 | 378 | 359 | 97.5 |
| C | 3 | 202 | 1139 | 8.0 | 378 | 359 | 97.5 |
| D | 10 | 189 | 883 | 6.38 | 335 | 308 | 90.1 |
| D | 10 | 113 | 876 | 6.3 | 335 | 308 | 90.1 |
| D | 6 | 67 | 867 | 6.2 | 335 | 308 | 90.1 |
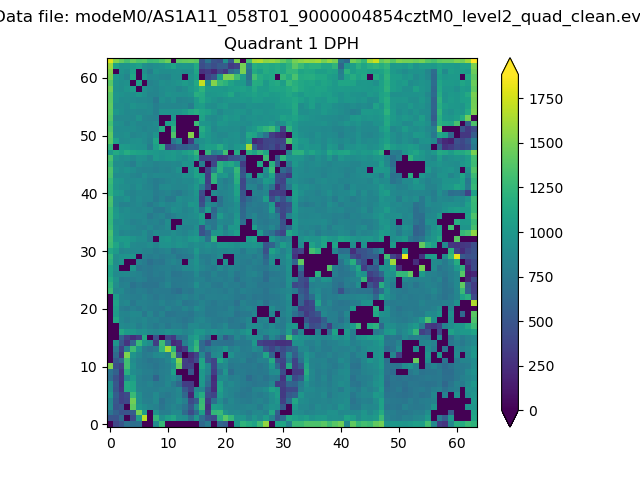
Histogram calculated using DETX and DETY for each event in the final _common_clean file
| Quadrant A |  |
 |
Quadrant B |
|---|---|---|---|
| Quadrant D |  |
 |
Quadrant C |
| Plot type | Count rate plots | Images |
|---|---|---|
| Comparison with Poisson distribution Blue bars denote a histogram of data divided into 1 sec bins. Red curve is a Poisson curve with rate = median count rate of data. |
 |
 |
| Quadrant-wise count rates Data is divided into 100 sec bins |
 |
|
| Module-wise count rates for Quadrant A Data is divided into 100 sec bins |
 |
 |
| Module-wise count rates for Quadrant B Data is divided into 100 sec bins |
 |
 |
| Module-wise count rates for Quadrant C Data is divided into 100 sec bins |
 |
 |
| Module-wise count rates for Quadrant D Data is divided into 100 sec bins |
 |
 |
| Parameter | Plot |
|---|---|
| CZT HV Monitor |  |
| D_VDD |  |
| Temperature 1 |  |
| Veto HV Monitor |  |
| Veto LLD |  |
| Alpha Counter |  |
| _CPM_Rate |  |
| CZT Counter |  |
| +2.5 Volts monitor |  |
| +5 Volts monitor |  |
| _ROLL_ROT |  |
| _Roll_DEC |  |
| _Roll_RA |  |
| Veto Counter |  |