| Param | Original file | Final file |
|---|---|---|
| Filename | modeM0/AS1A11_058T01_9000004854_33957cztM0_level2.evt | modeM0/AS1A11_058T01_9000004854_33957cztM0_level2_quad_clean.evt |
| Size (bytes) | 83,594,880 | 20,568,960 |
| Size | 79.7 MB | 19.6 MB |
| Events in quadrant A | 474,521 | 144,632 |
| Events in quadrant B | 701,821 | 141,056 |
| Events in quadrant C | 587,670 | 137,482 |
| Events in quadrant D | 704,466 | 130,000 |
| Mode SS | |||
|---|---|---|---|
| Quadrant | BADHDUFLAG | Total packets | Discarded packets |
| A | 0 | 18 | 0 |
| B | 0 | 18 | 0 |
| C | 0 | 18 | 0 |
| D | 0 | 18 | 0 |
| Mode M9 | |||
|---|---|---|---|
| Quadrant | BADHDUFLAG | Total packets | Discarded packets |
| A | 0 | 14 | 0 |
| B | 0 | 14 | 0 |
| C | 0 | 14 | 0 |
| D | 0 | 14 | 0 |
| Mode M0 | |||
|---|---|---|---|
| Quadrant | BADHDUFLAG | Total packets | Discarded packets |
| A | 0 | 1876 | 2 |
| B | 0 | 2618 | 1 |
| C | 0 | 2230 | 1 |
| D | 0 | 2711 | 1 |
| Quadrant | Total seconds | Saturated seconds | Saturation percentage |
|---|---|---|---|
| A | 884 | 2 | 0.226244% |
| B | 884 | 73 | 8.257919% |
| C | 884 | 31 | 3.506787% |
| D | 884 | 46 | 5.203620% |
Noise dominated data is calculated using 1-second bins in cleaned event files. If a bin has >2000 counts, and if more than 50% of those come from <1% of pixels, then it is considered to be noise-dominated and hence unusable.
| Quadrant | # 1 sec bins | Bins with >0 counts | Bins with >2000 counts | High rate bins dominated by noise | Noise dominated (total time) | Noise dominated (detector-on time) | Marked lightcurve |
|---|---|---|---|---|---|---|---|
| A | 884 | 884 | 1 | 1 | 0.11% | 0.11% | 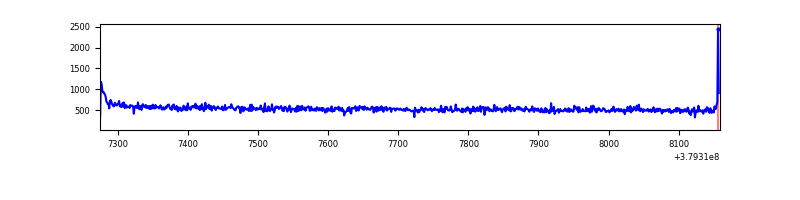 |
| B | 884 | 884 | 52 | 52 | 5.88% | 5.88% | 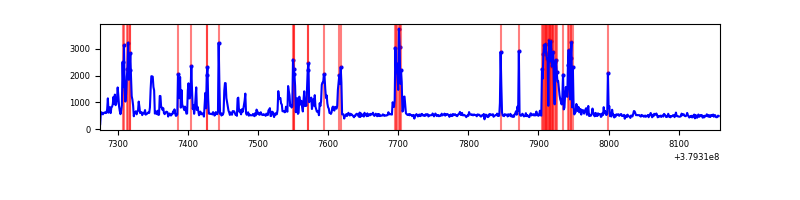 |
| C | 884 | 884 | 29 | 29 | 3.28% | 3.28% | 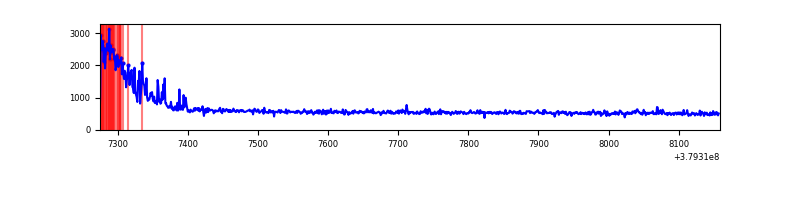 |
| D | 884 | 884 | 28 | 28 | 3.17% | 3.17% | 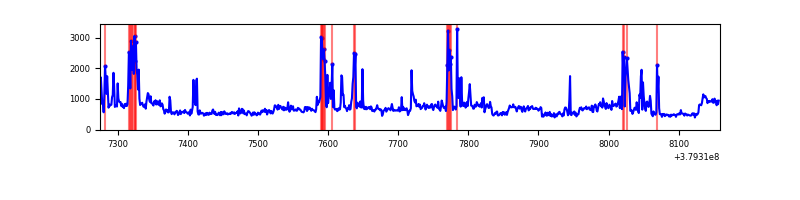 |
Top three noisy pixels from each quadrant. If the there are fewer than three noisy pixels in the level2.evt file, extra rows are filled as -1
| Pixel properties | Quadrant properties | ||||||
|---|---|---|---|---|---|---|---|
| Quadrant | DetID | PixID | Counts | Sigma | Mean | Median | Sigma |
| A | 10 | 83 | 6520 | 253.8 | 119 | 117 | 25.2 |
| A | 15 | 169 | 3313 | 126.68 | 119 | 117 | 25.2 |
| A | 13 | 6 | 2292 | 86.21 | 119 | 117 | 25.2 |
| B | 5 | 172 | 248732 | 10702.77 | 114 | 111 | 23.2 |
| B | 0 | 199 | 4117 | 172.45 | 114 | 111 | 23.2 |
| B | 3 | 112 | 2521 | 103.75 | 114 | 111 | 23.2 |
| C | 0 | 10 | 109184 | 4109.87 | 109 | 109 | 26.5 |
| C | 15 | 214 | 42053 | 1580.42 | 109 | 109 | 26.5 |
| C | 3 | 233 | 9020 | 335.76 | 109 | 109 | 26.5 |
| D | 8 | 195 | 123685 | 4444.81 | 108 | 105 | 27.8 |
| D | 13 | 249 | 110146 | 3957.85 | 108 | 105 | 27.8 |
| D | 7 | 238 | 52064 | 1868.81 | 108 | 105 | 27.8 |
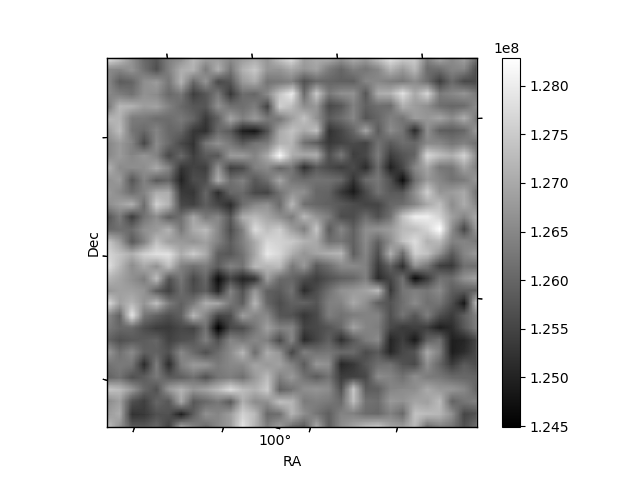
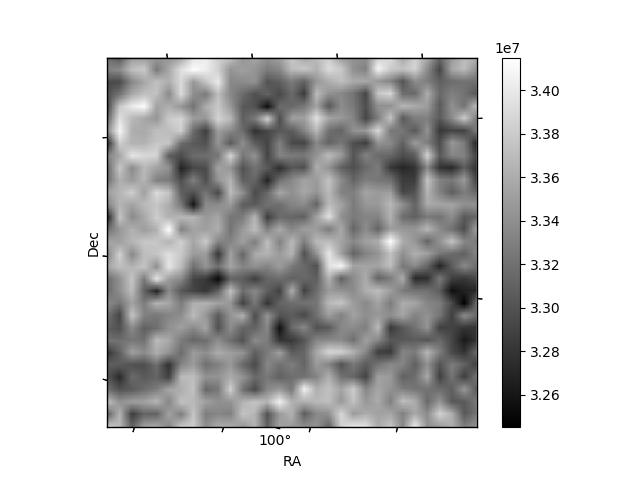
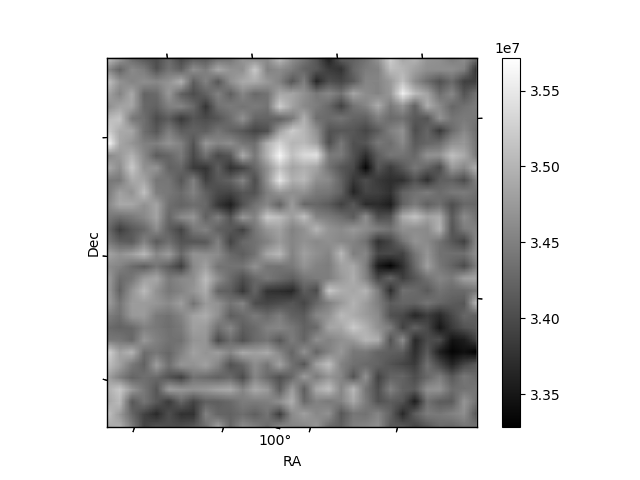
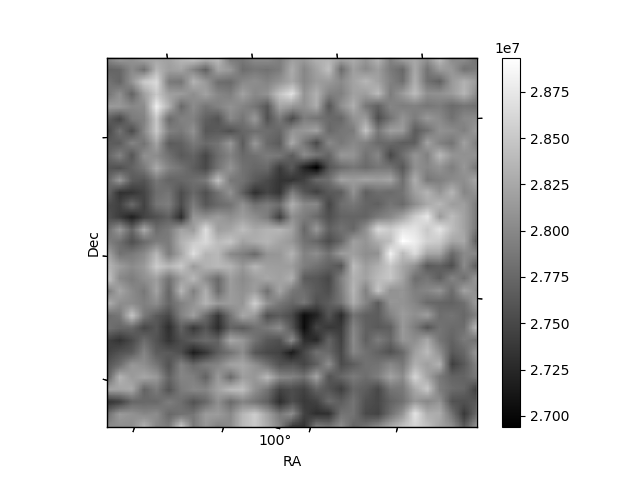
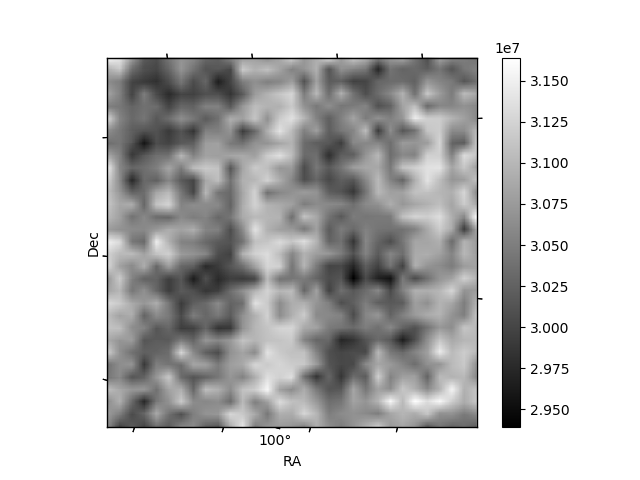
Histogram calculated using DETX and DETY for each event in the final _common_clean file
| Quadrant A | 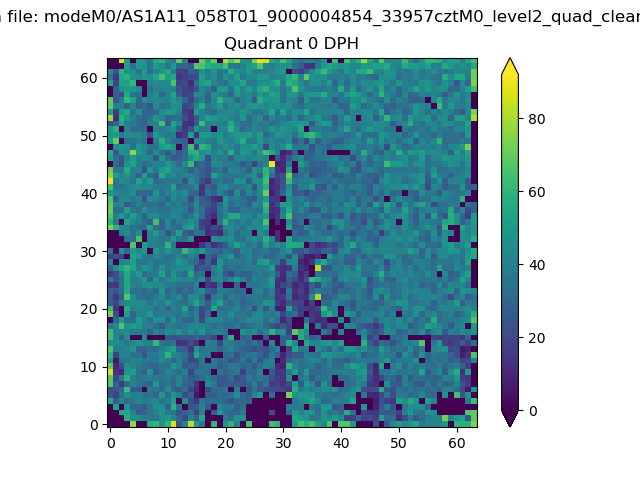 |
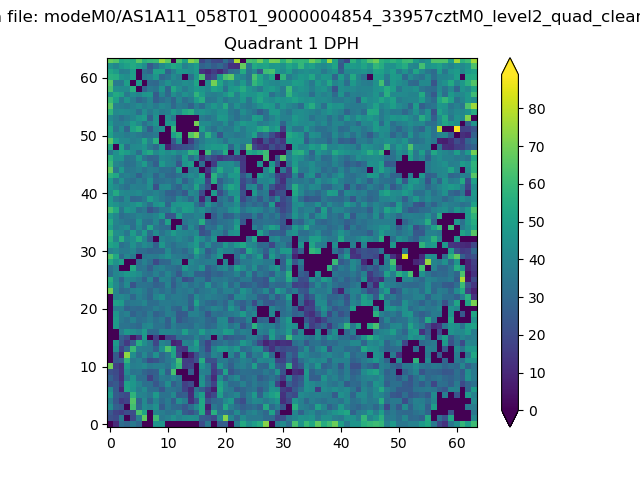 |
Quadrant B |
|---|---|---|---|
| Quadrant D | 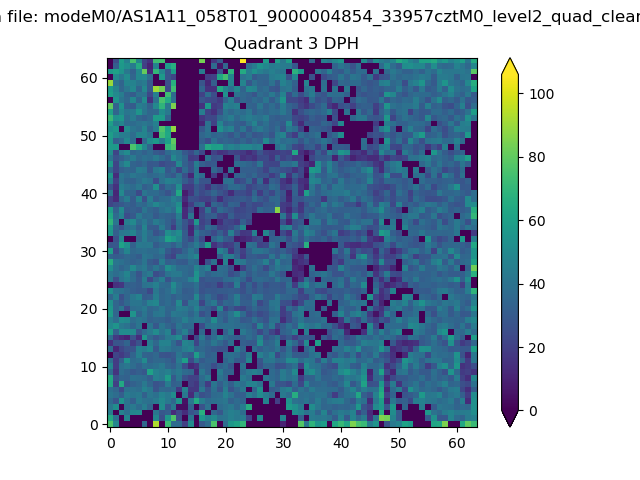 |
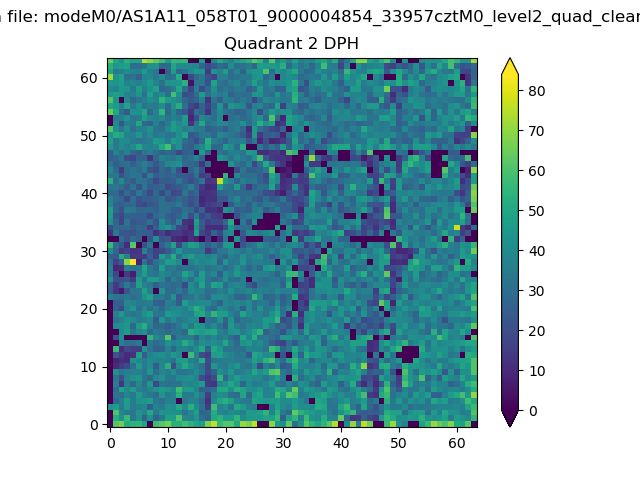 |
Quadrant C |
| Plot type | Count rate plots | Images |
|---|---|---|
| Comparison with Poisson distribution Blue bars denote a histogram of data divided into 1 sec bins. Red curve is a Poisson curve with rate = median count rate of data. |
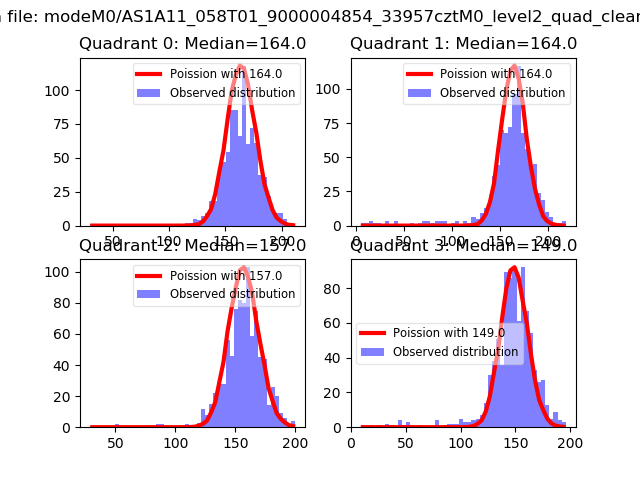 |
 |
| Quadrant-wise count rates Data is divided into 100 sec bins |
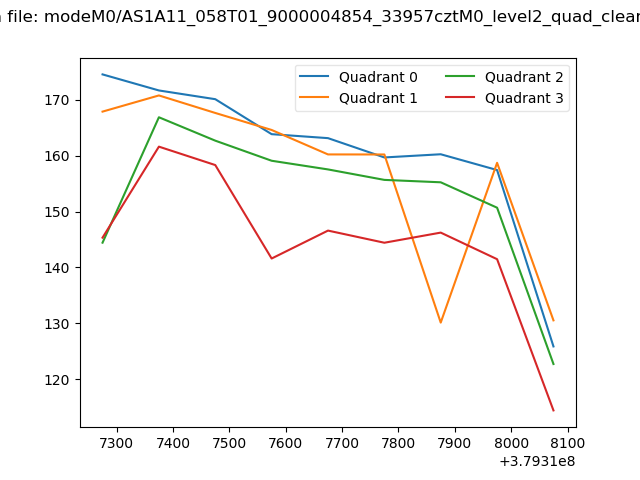 |
|
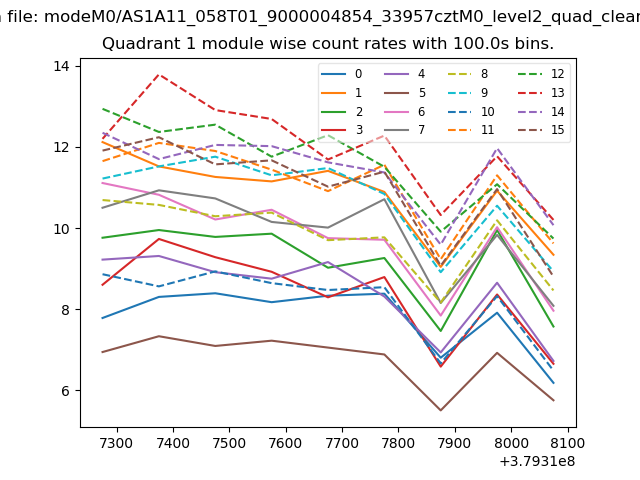
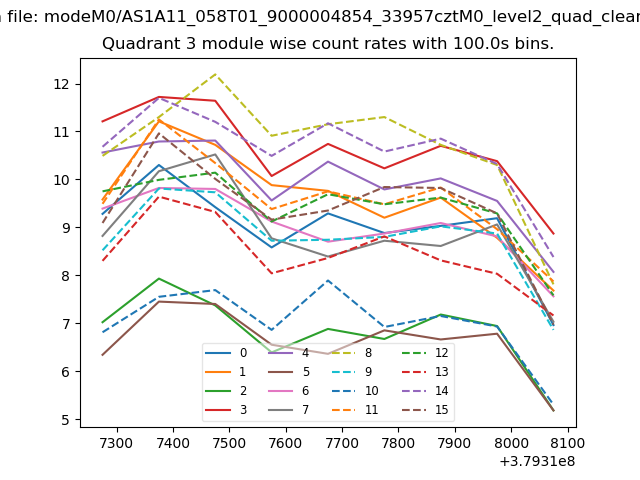
| Module-wise count rates for Quadrant A Data is divided into 100 sec bins |
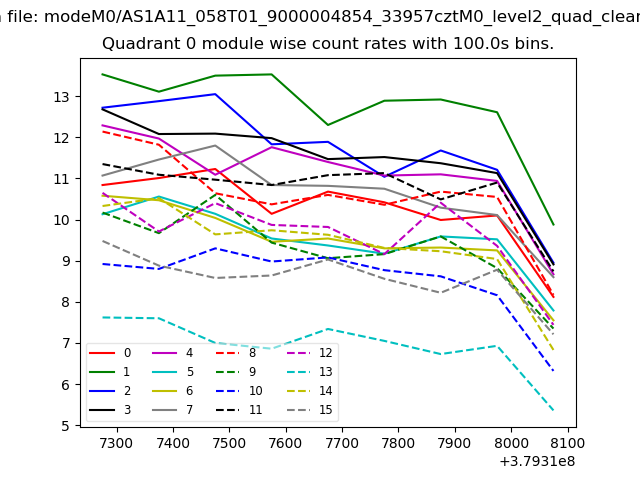 |
 |
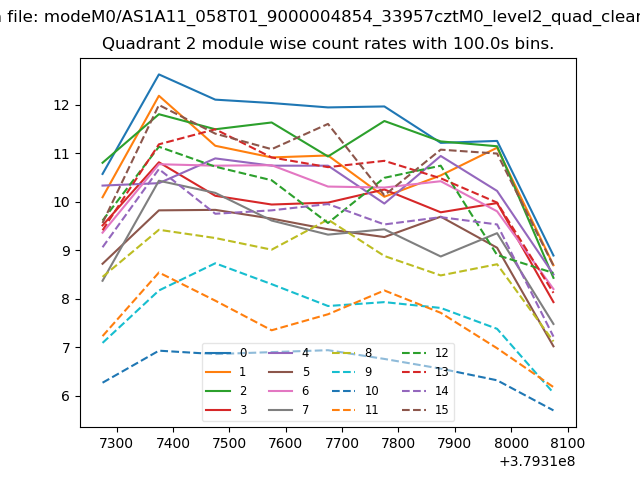
| Module-wise count rates for Quadrant B Data is divided into 100 sec bins |
 |
 |
| Module-wise count rates for Quadrant C Data is divided into 100 sec bins |
 |
 |
| Module-wise count rates for Quadrant D Data is divided into 100 sec bins |
 |
 |
| Parameter | Plot |
|---|---|
| CZT HV Monitor | 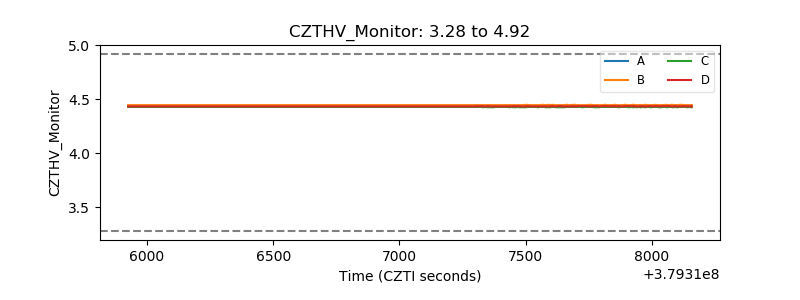 |
| D_VDD | 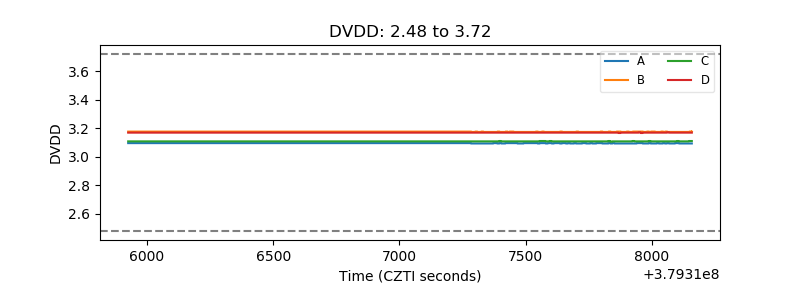 |
| Temperature 1 | 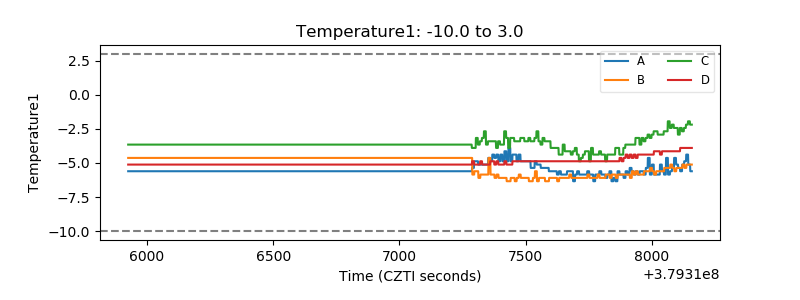 |
| Veto HV Monitor | 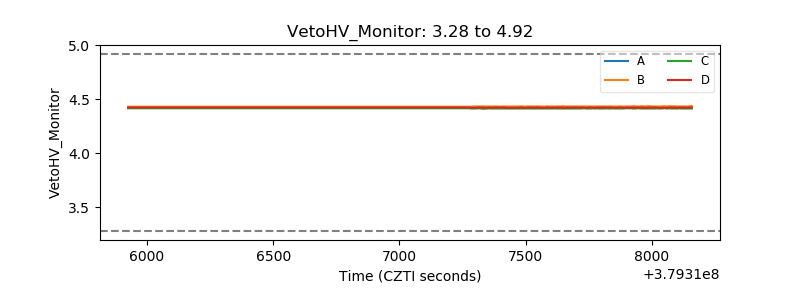 |
| Veto LLD | 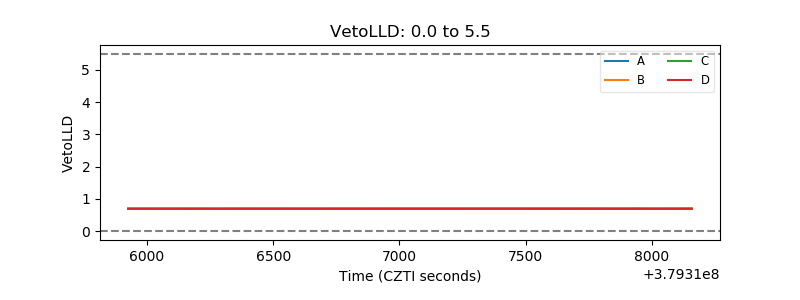 |
| Alpha Counter | 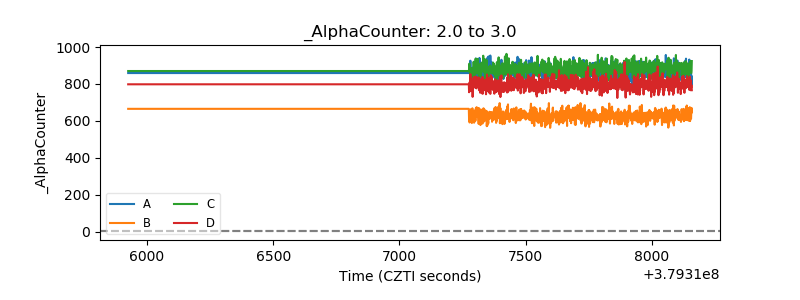 |
| _CPM_Rate | 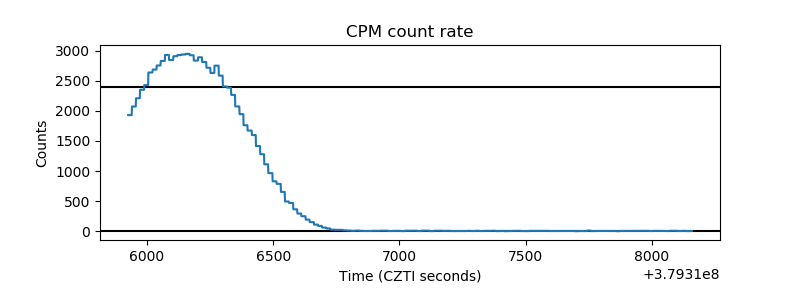 |
| CZT Counter | 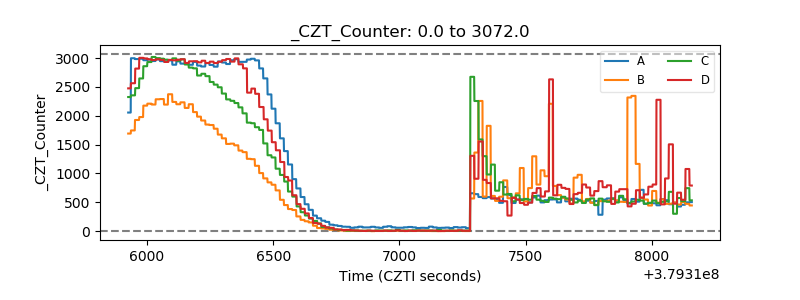 |
| +2.5 Volts monitor | 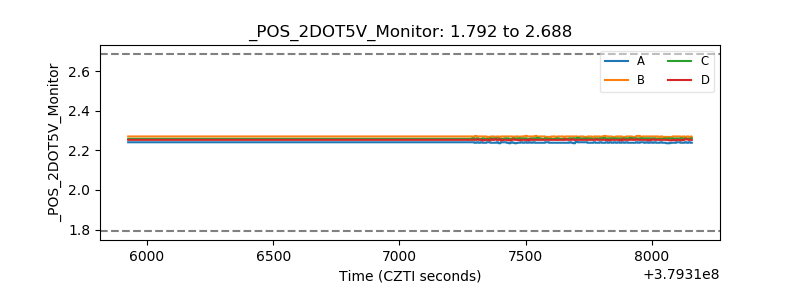 |
| +5 Volts monitor |  |
| _ROLL_ROT | 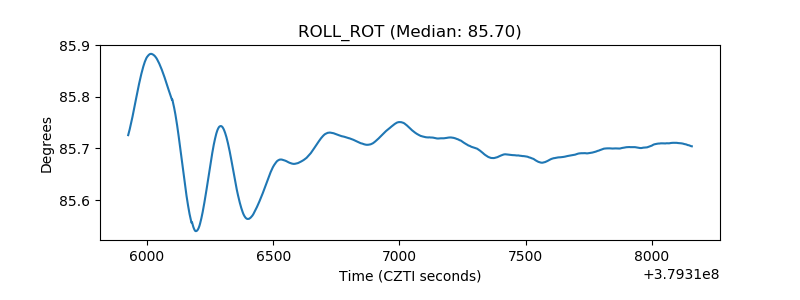 |
| _Roll_DEC |  |
| _Roll_RA | 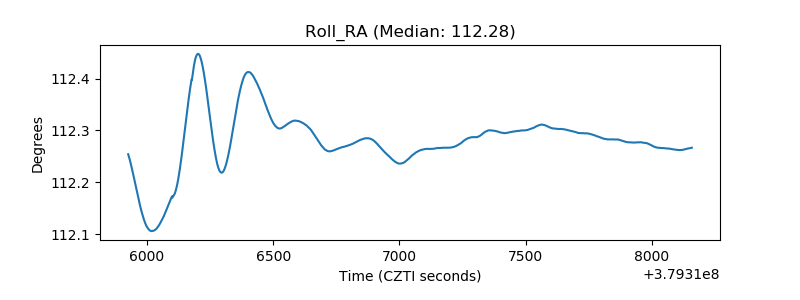 |
| Veto Counter | 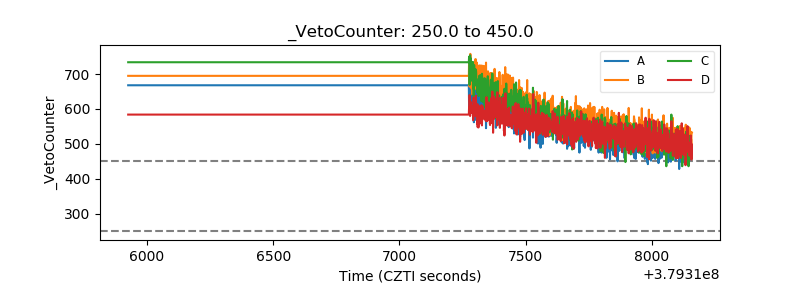 |