| Param | Original file | Final file |
|---|---|---|
| Filename | modeM0/AS1A11_058T01_9000004854_33958cztM0_level2.evt | modeM0/AS1A11_058T01_9000004854_33958cztM0_level2_quad_clean.evt |
| Size (bytes) | 509,451,840 | 105,969,600 |
| Size | 485.9 MB | 101.1 MB |
| Events in quadrant A | 2,558,867 | 769,787 |
| Events in quadrant B | 3,407,055 | 758,403 |
| Events in quadrant C | 2,866,899 | 728,369 |
| Events in quadrant D | 6,255,091 | 599,926 |
| Mode SS | |||
|---|---|---|---|
| Quadrant | BADHDUFLAG | Total packets | Discarded packets |
| A | 0 | 102 | 0 |
| B | 0 | 102 | 0 |
| C | 0 | 102 | 0 |
| D | 0 | 102 | 0 |
| Mode M9 | |||
|---|---|---|---|
| Quadrant | BADHDUFLAG | Total packets | Discarded packets |
| A | 0 | 29 | 0 |
| B | 0 | 29 | 0 |
| C | 0 | 29 | 0 |
| D | 0 | 30 | 0 |
| Mode M0 | |||
|---|---|---|---|
| Quadrant | BADHDUFLAG | Total packets | Discarded packets |
| A | 0 | 10430 | 3 |
| B | 0 | 13106 | 2 |
| C | 0 | 11204 | 2 |
| D | 0 | 21997 | 2 |
| Quadrant | Total seconds | Saturated seconds | Saturation percentage |
|---|---|---|---|
| A | 5027 | 10 | 0.198926% |
| B | 5027 | 221 | 4.396260% |
| C | 5027 | 60 | 1.193555% |
| D | 5027 | 1360 | 27.053909% |
Noise dominated data is calculated using 1-second bins in cleaned event files. If a bin has >2000 counts, and if more than 50% of those come from <1% of pixels, then it is considered to be noise-dominated and hence unusable.
| Quadrant | # 1 sec bins | Bins with >0 counts | Bins with >2000 counts | High rate bins dominated by noise | Noise dominated (total time) | Noise dominated (detector-on time) | Marked lightcurve |
|---|---|---|---|---|---|---|---|
| A | 7059 | 5028 | 4 | 4 | 0.06% | 0.08% | 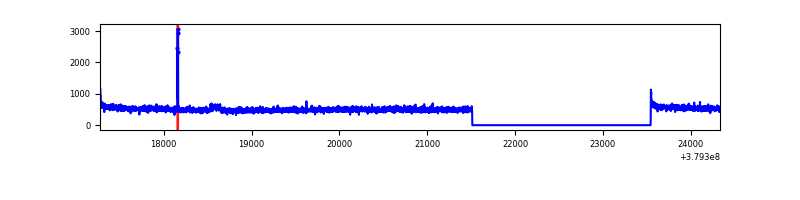 |
| B | 7059 | 5028 | 152 | 152 | 2.15% | 3.02% | 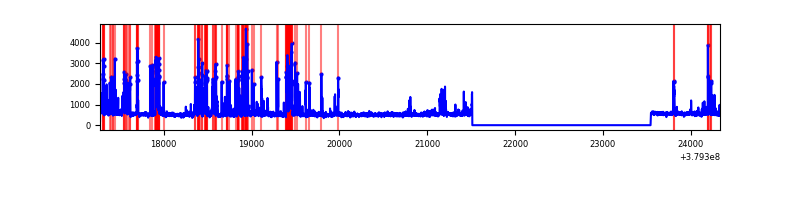 |
| C | 7059 | 5028 | 52 | 52 | 0.74% | 1.03% | 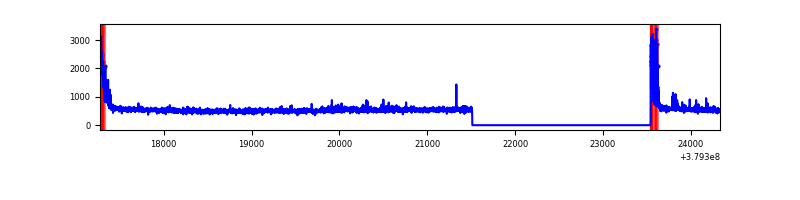 |
| D | 7059 | 5028 | 1170 | 1170 | 16.57% | 23.27% | 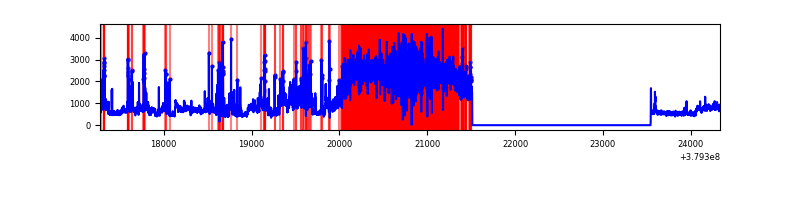 |
Top three noisy pixels from each quadrant. If the there are fewer than three noisy pixels in the level2.evt file, extra rows are filled as -1
| Pixel properties | Quadrant properties | ||||||
|---|---|---|---|---|---|---|---|
| Quadrant | DetID | PixID | Counts | Sigma | Mean | Median | Sigma |
| A | 15 | 169 | 24235 | 184.39 | 650 | 639 | 128.0 |
| A | 10 | 83 | 14813 | 110.76 | 650 | 639 | 128.0 |
| A | 13 | 254 | 10400 | 76.28 | 650 | 639 | 128.0 |
| B | 5 | 172 | 839156 | 7146.23 | 630 | 615 | 117.3 |
| B | 3 | 112 | 30207 | 252.19 | 630 | 615 | 117.3 |
| B | 4 | 232 | 25925 | 215.7 | 630 | 615 | 117.3 |
| C | 15 | 214 | 223003 | 1620.37 | 607 | 613 | 137.2 |
| C | 0 | 10 | 210717 | 1530.85 | 607 | 613 | 137.2 |
| C | 3 | 233 | 44830 | 322.17 | 607 | 613 | 137.2 |
| D | 12 | 33 | 1821654 | 13719.27 | 538 | 521 | 132.7 |
| D | 8 | 195 | 908605 | 6840.93 | 538 | 521 | 132.7 |
| D | 2 | 250 | 728115 | 5481.24 | 538 | 521 | 132.7 |
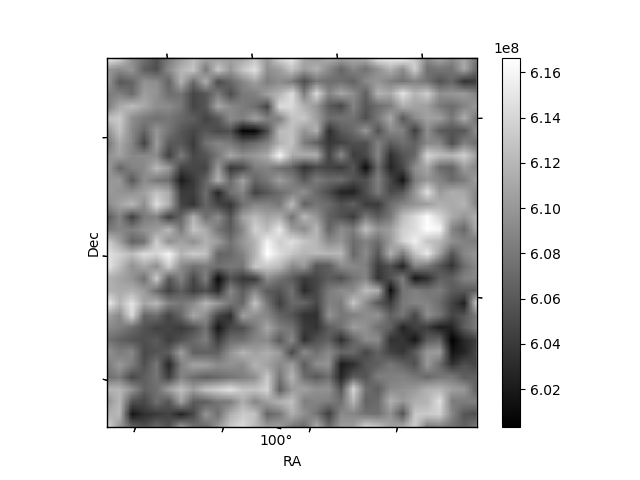
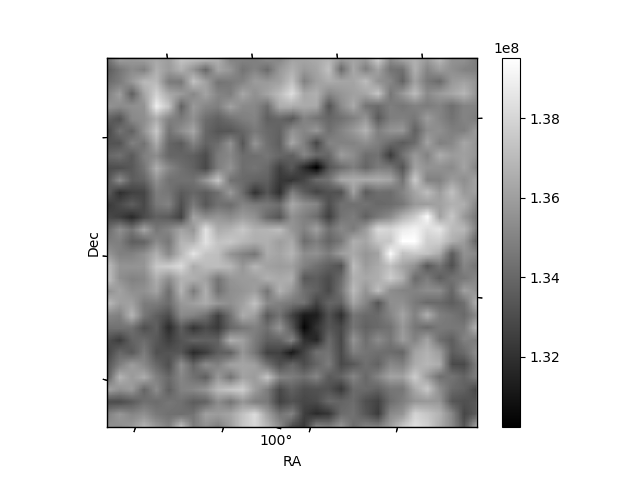
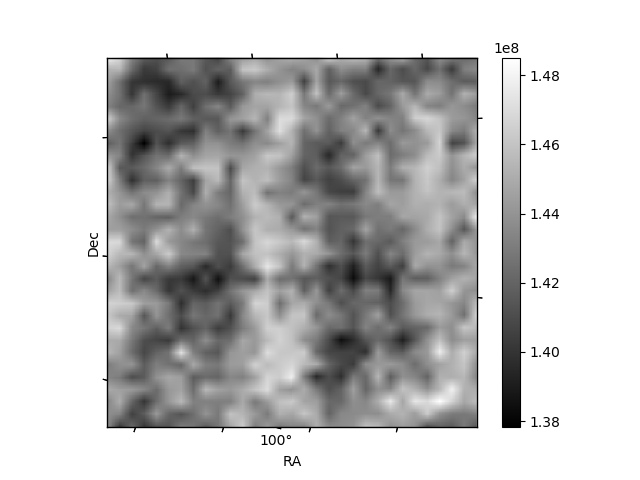
Histogram calculated using DETX and DETY for each event in the final _common_clean file
| Quadrant A | 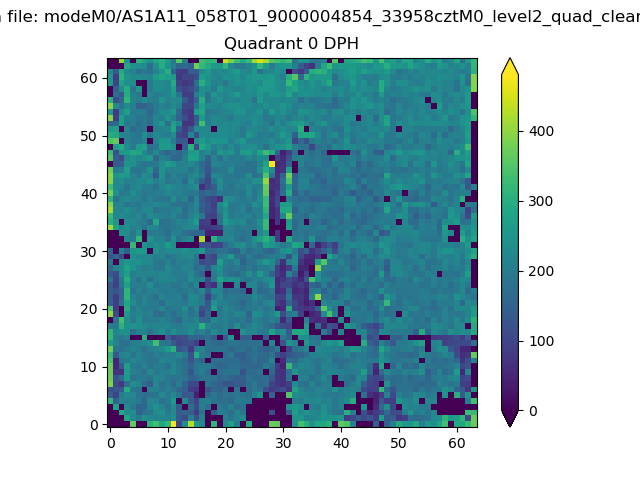 |
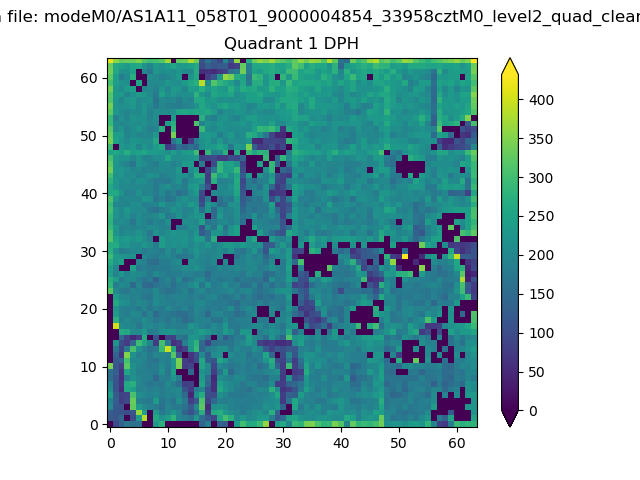 |
Quadrant B |
|---|---|---|---|
| Quadrant D | 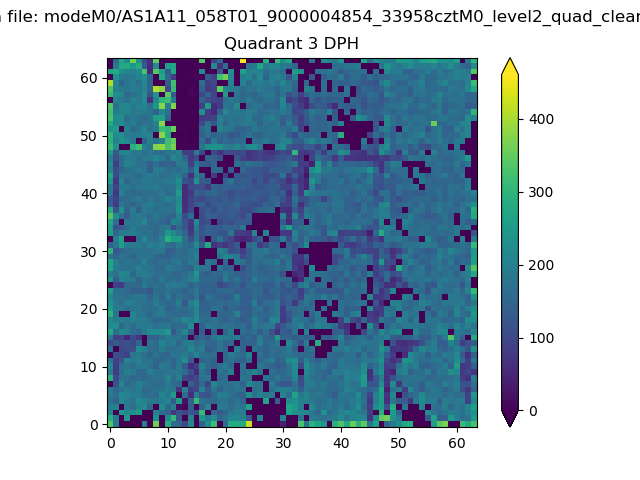 |
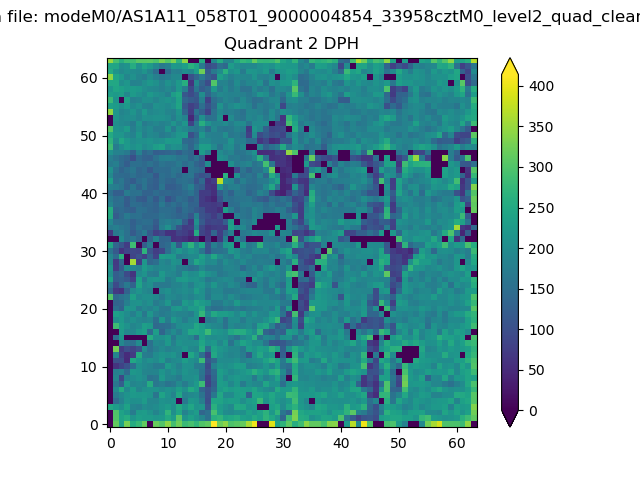 |
Quadrant C |
| Plot type | Count rate plots | Images |
|---|---|---|
| Comparison with Poisson distribution Blue bars denote a histogram of data divided into 1 sec bins. Red curve is a Poisson curve with rate = median count rate of data. |
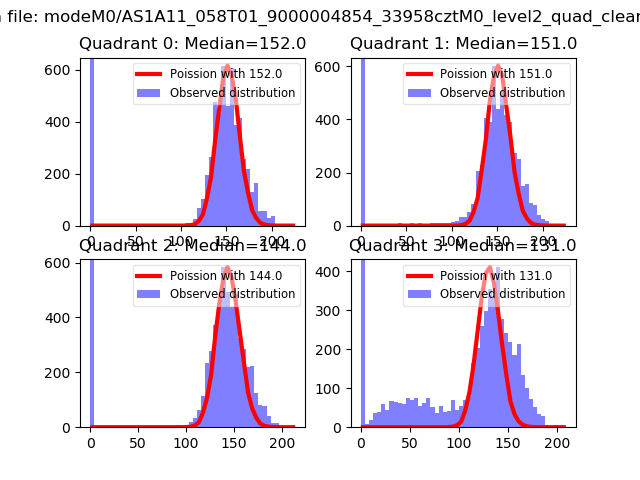 |
 |
| Quadrant-wise count rates Data is divided into 100 sec bins |
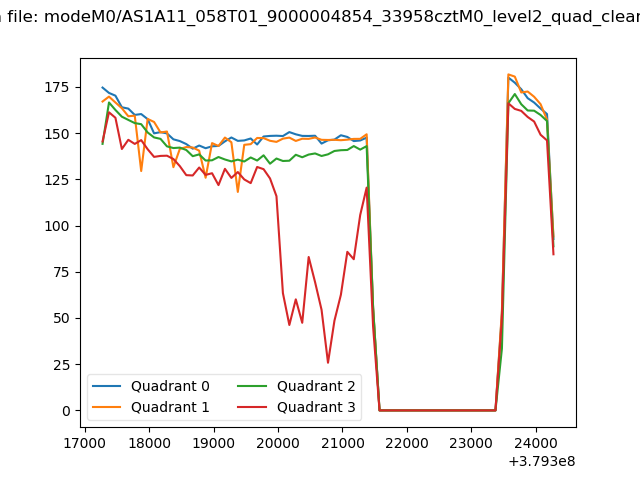 |
|
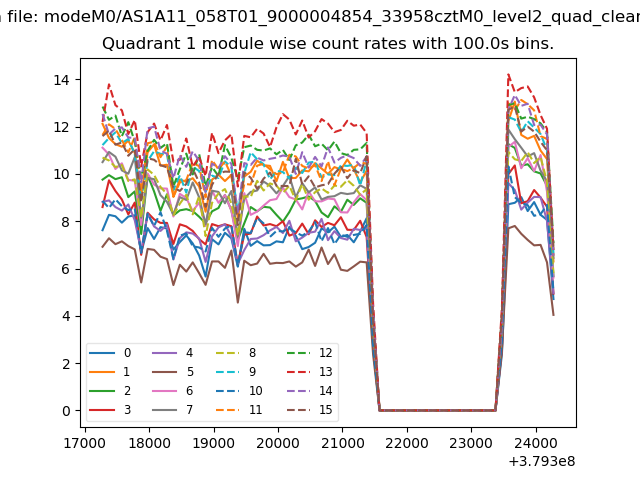
| Module-wise count rates for Quadrant A Data is divided into 100 sec bins |
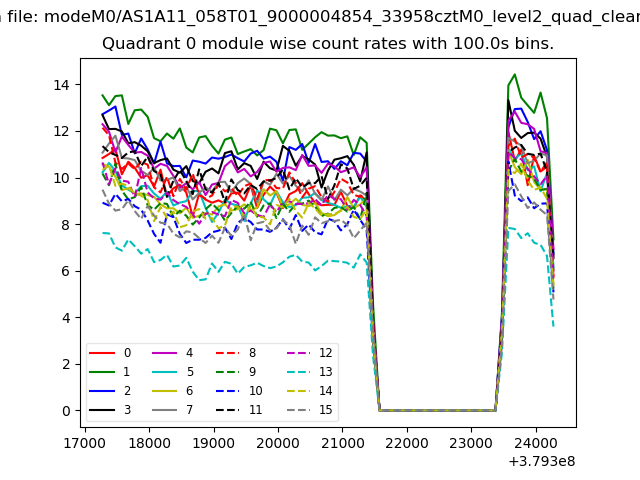 |
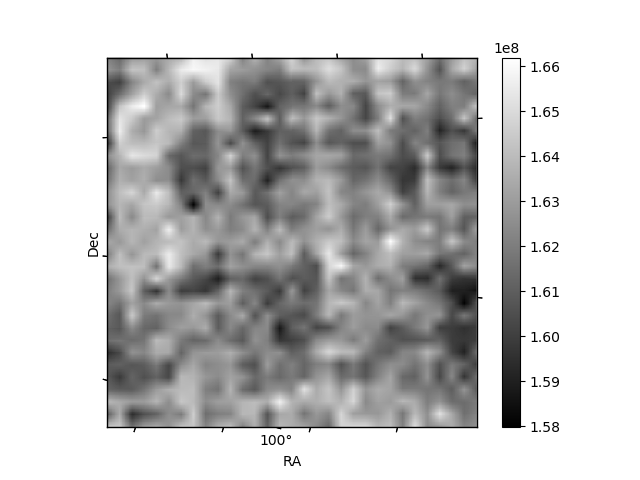 |
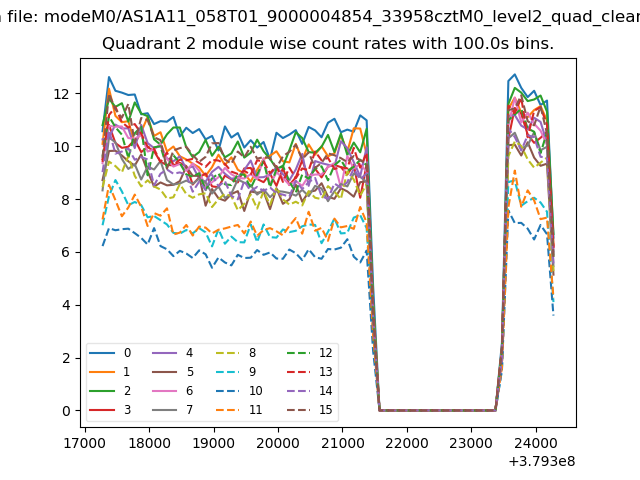
| Module-wise count rates for Quadrant B Data is divided into 100 sec bins |
 |
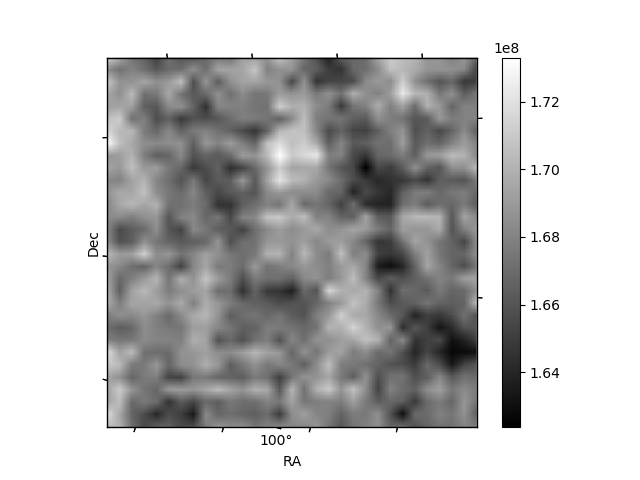 |
| Module-wise count rates for Quadrant C Data is divided into 100 sec bins |
 |
 |
| Module-wise count rates for Quadrant D Data is divided into 100 sec bins |
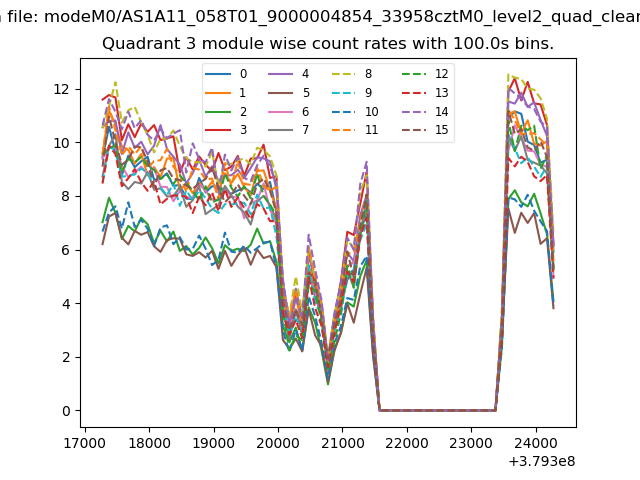 |
 |
| Parameter | Plot |
|---|---|
| CZT HV Monitor | 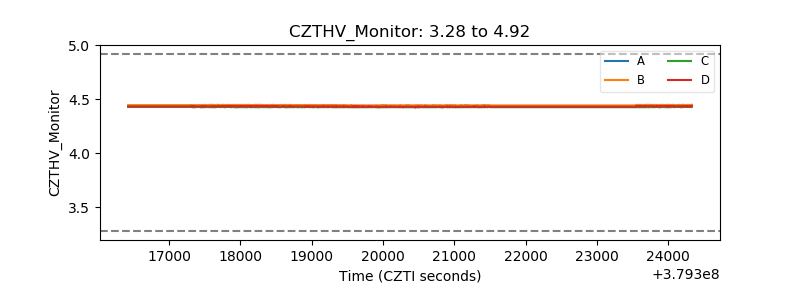 |
| D_VDD | 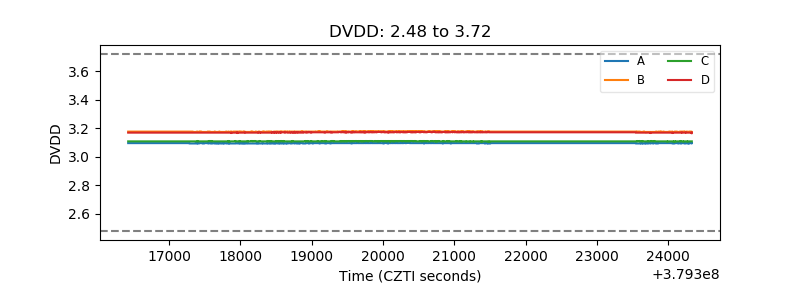 |
| Temperature 1 | 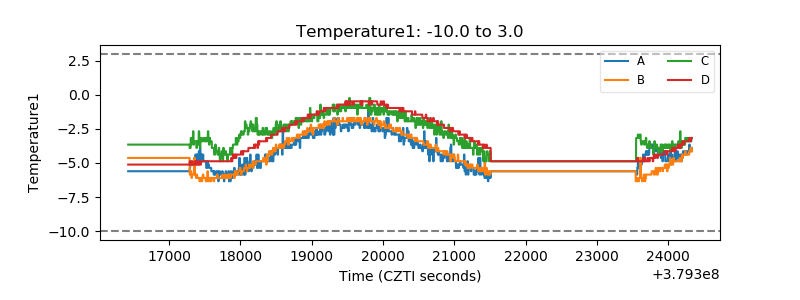 |
| Veto HV Monitor | 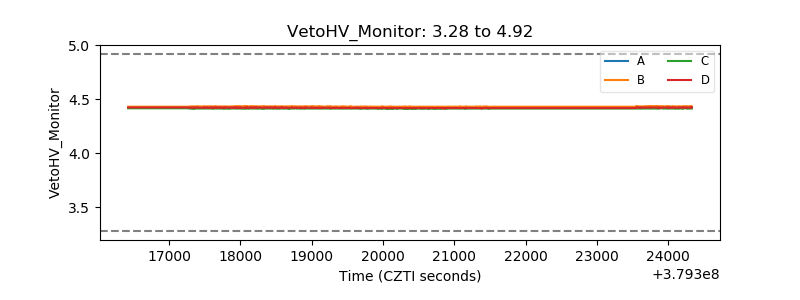 |
| Veto LLD | 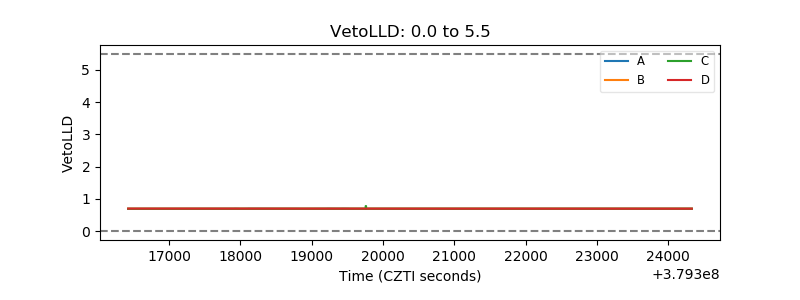 |
| Alpha Counter | 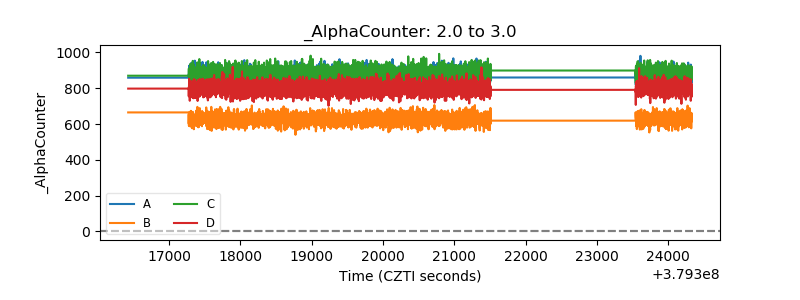 |
| _CPM_Rate | 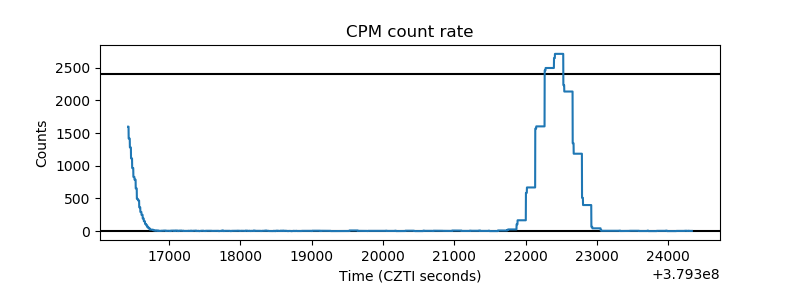 |
| CZT Counter | 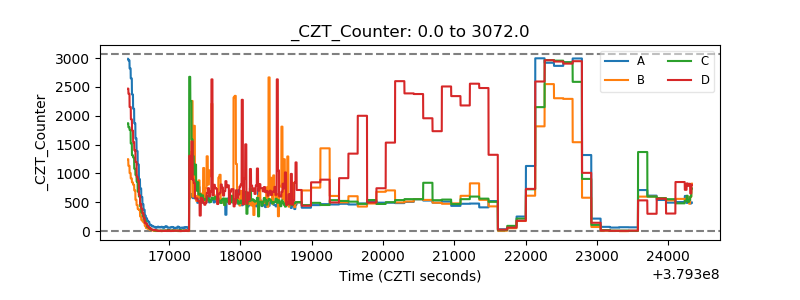 |
| +2.5 Volts monitor |  |
| +5 Volts monitor |  |
| _ROLL_ROT | 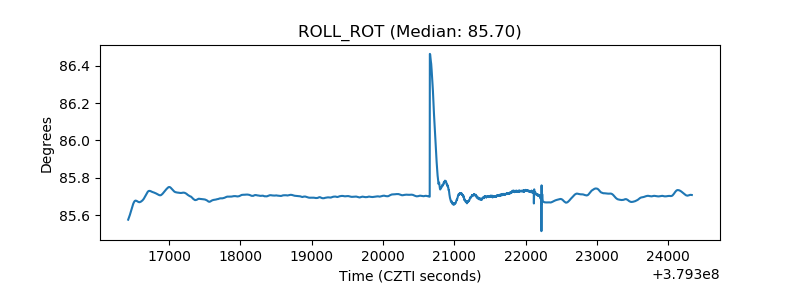 |
| _Roll_DEC | 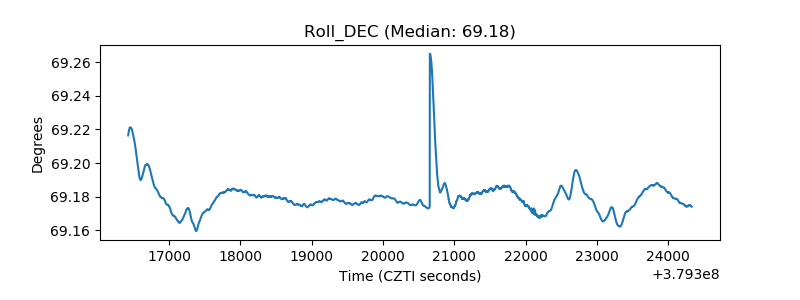 |
| _Roll_RA | 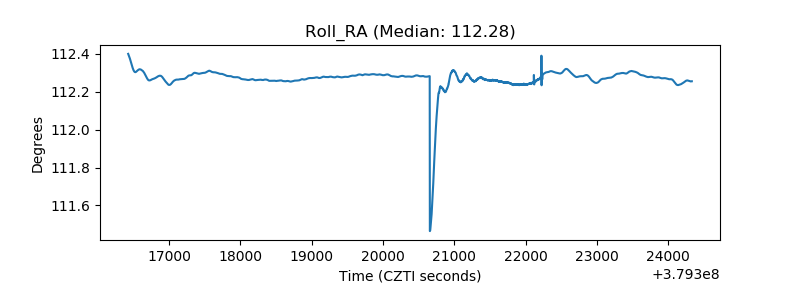 |
| Veto Counter | 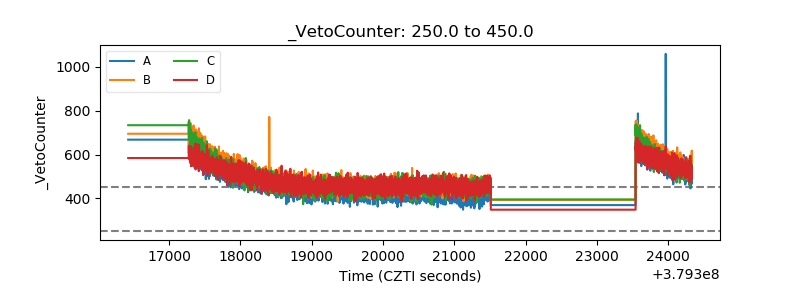 |