| Param | Original file | Final file |
|---|---|---|
| Filename | modeM0/AS1A11_058T01_9000004854_33959cztM0_level2.evt | modeM0/AS1A11_058T01_9000004854_33959cztM0_level2_quad_clean.evt |
| Size (bytes) | 428,817,600 | 108,694,080 |
| Size | 409.0 MB | 103.7 MB |
| Events in quadrant A | 2,519,572 | 768,193 |
| Events in quadrant B | 3,166,354 | 761,697 |
| Events in quadrant C | 2,909,514 | 724,538 |
| Events in quadrant D | 4,057,065 | 692,281 |
| Mode SS | |||
|---|---|---|---|
| Quadrant | BADHDUFLAG | Total packets | Discarded packets |
| A | 0 | 100 | 0 |
| B | 0 | 100 | 0 |
| C | 0 | 100 | 0 |
| D | 0 | 100 | 0 |
| Mode M9 | |||
|---|---|---|---|
| Quadrant | BADHDUFLAG | Total packets | Discarded packets |
| A | 0 | 25 | 0 |
| B | 0 | 25 | 0 |
| C | 0 | 25 | 0 |
| D | 0 | 26 | 0 |
| Mode M0 | |||
|---|---|---|---|
| Quadrant | BADHDUFLAG | Total packets | Discarded packets |
| A | 0 | 10168 | 3 |
| B | 0 | 12338 | 2 |
| C | 0 | 11315 | 2 |
| D | 0 | 15325 | 2 |
| Quadrant | Total seconds | Saturated seconds | Saturation percentage |
|---|---|---|---|
| A | 4925 | 6 | 0.121827% |
| B | 4925 | 122 | 2.477157% |
| C | 4925 | 63 | 1.279188% |
| D | 4925 | 149 | 3.025381% |
Noise dominated data is calculated using 1-second bins in cleaned event files. If a bin has >2000 counts, and if more than 50% of those come from <1% of pixels, then it is considered to be noise-dominated and hence unusable.
| Quadrant | # 1 sec bins | Bins with >0 counts | Bins with >2000 counts | High rate bins dominated by noise | Noise dominated (total time) | Noise dominated (detector-on time) | Marked lightcurve |
|---|---|---|---|---|---|---|---|
| A | 7048 | 4926 | 0 | 0 | 0.00% | 0.00% | 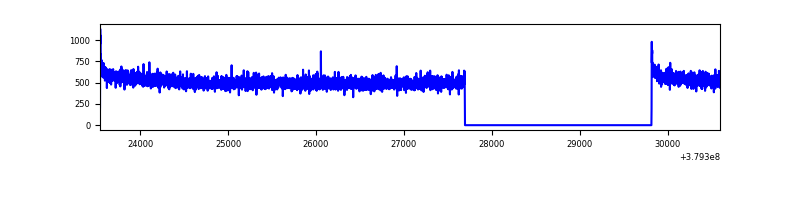 |
| B | 7048 | 4926 | 91 | 91 | 1.29% | 1.85% | 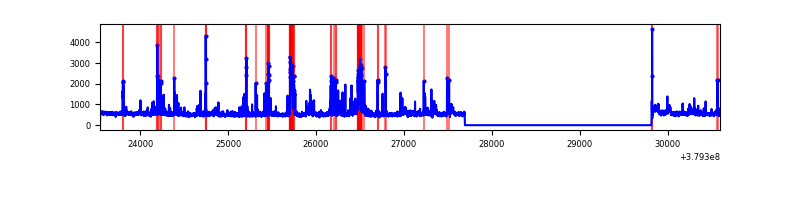 |
| C | 7048 | 4926 | 52 | 52 | 0.74% | 1.06% | 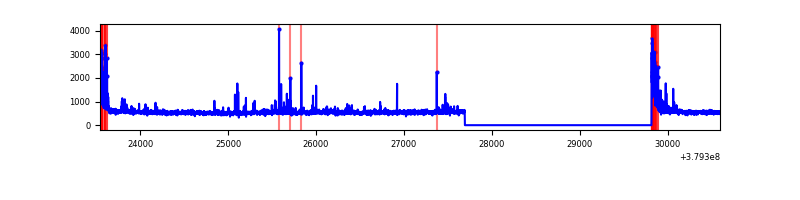 |
| D | 7048 | 4926 | 108 | 108 | 1.53% | 2.19% | 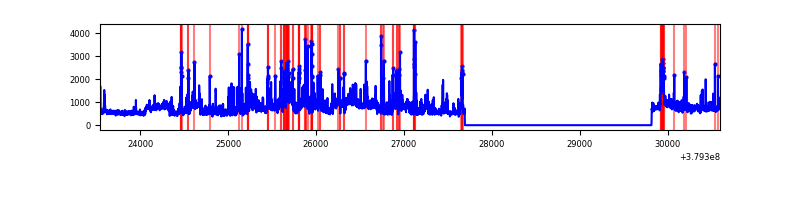 |
Top three noisy pixels from each quadrant. If the there are fewer than three noisy pixels in the level2.evt file, extra rows are filled as -1
| Pixel properties | Quadrant properties | ||||||
|---|---|---|---|---|---|---|---|
| Quadrant | DetID | PixID | Counts | Sigma | Mean | Median | Sigma |
| A | 13 | 6 | 15247 | 115.17 | 645 | 635 | 126.9 |
| A | 10 | 83 | 14738 | 111.16 | 645 | 635 | 126.9 |
| A | 13 | 254 | 8361 | 60.89 | 645 | 635 | 126.9 |
| B | 5 | 172 | 536830 | 4608.99 | 627 | 613 | 116.3 |
| B | 3 | 112 | 52693 | 447.65 | 627 | 613 | 116.3 |
| B | 4 | 232 | 35615 | 300.86 | 627 | 613 | 116.3 |
| C | 0 | 10 | 281954 | 2071.99 | 601 | 607 | 135.8 |
| C | 15 | 214 | 217557 | 1597.74 | 601 | 607 | 135.8 |
| C | 14 | 67 | 29122 | 210.0 | 601 | 607 | 135.8 |
| D | 8 | 195 | 806086 | 5449.85 | 609 | 593 | 147.8 |
| D | 7 | 238 | 185119 | 1248.48 | 609 | 593 | 147.8 |
| D | 2 | 250 | 180217 | 1215.31 | 609 | 593 | 147.8 |
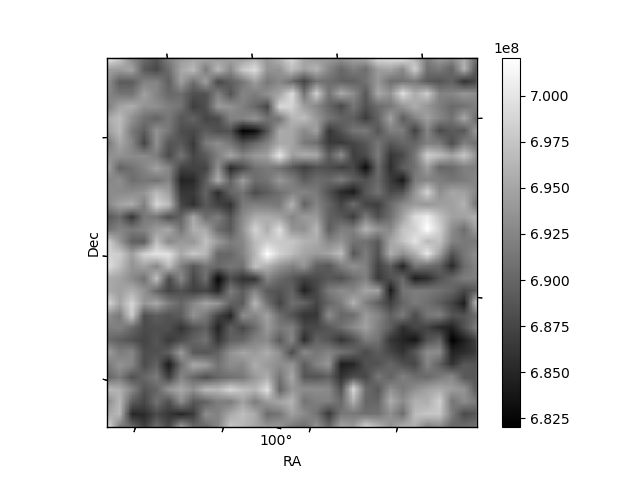
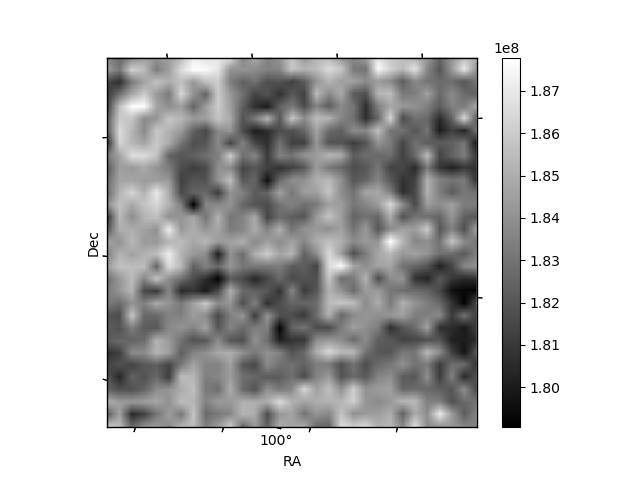
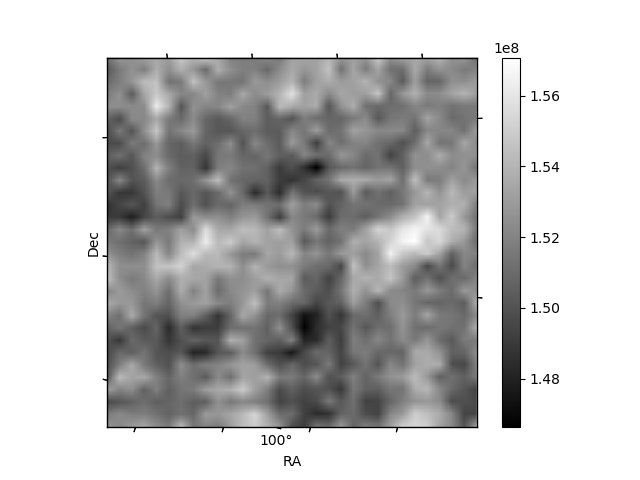
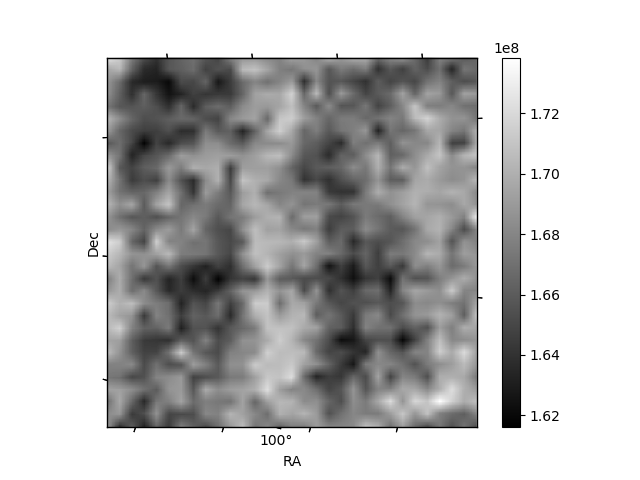
Histogram calculated using DETX and DETY for each event in the final _common_clean file
| Quadrant A | 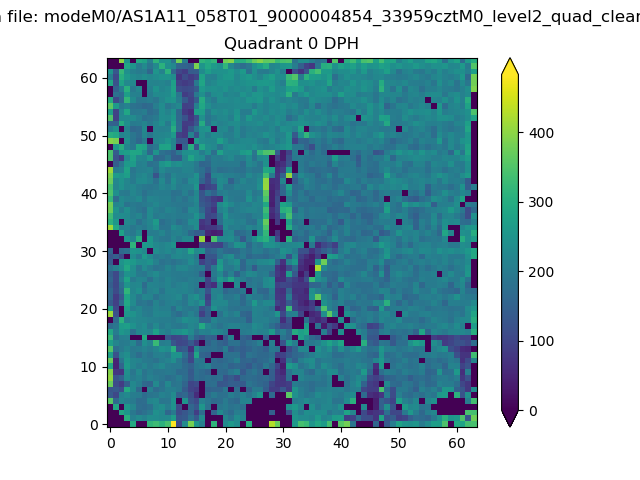 |
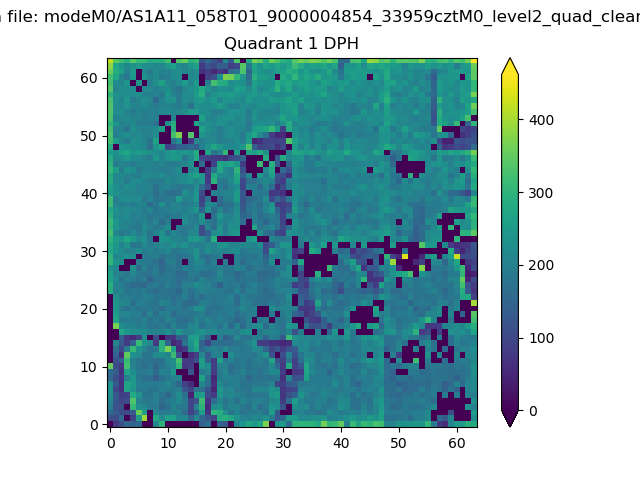 |
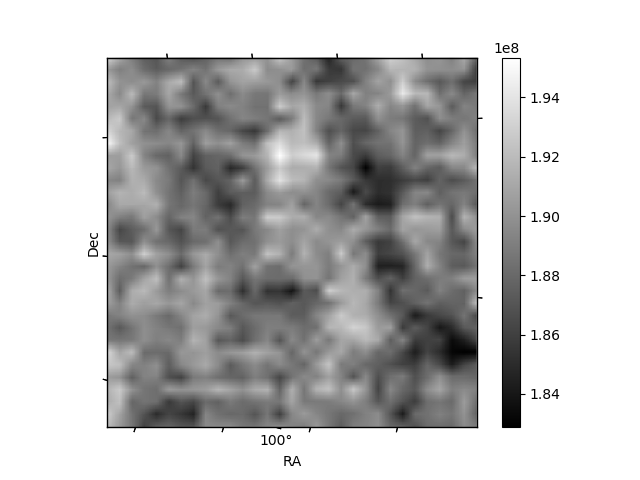
Quadrant B |
|---|---|---|---|
| Quadrant D | 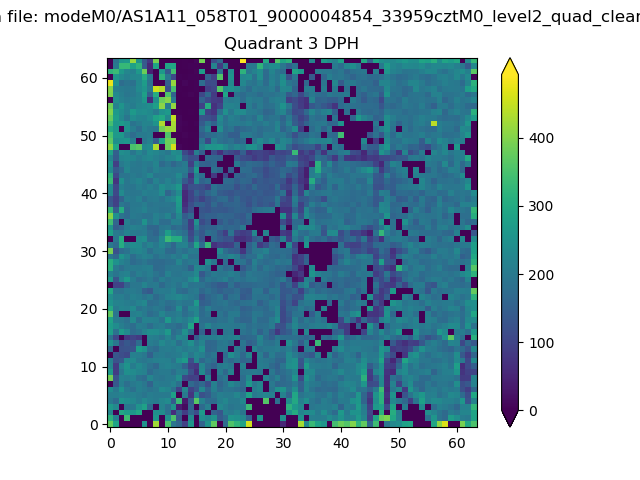 |
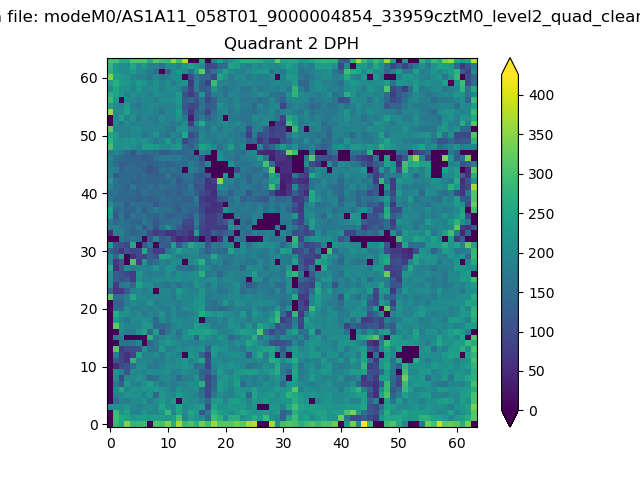 |
Quadrant C |
| Plot type | Count rate plots | Images |
|---|---|---|
| Comparison with Poisson distribution Blue bars denote a histogram of data divided into 1 sec bins. Red curve is a Poisson curve with rate = median count rate of data. |
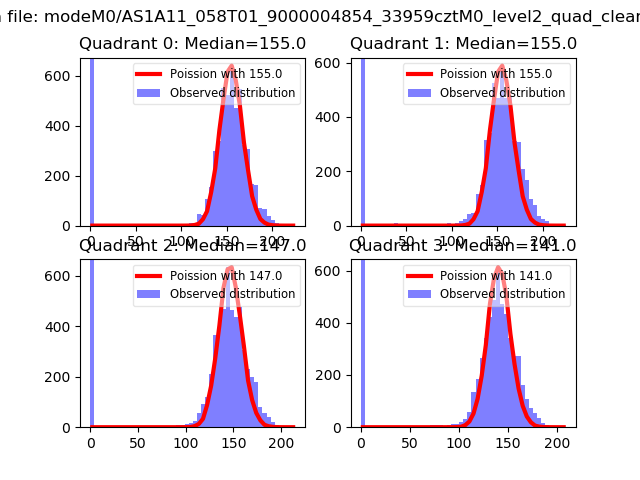 |
 |
| Quadrant-wise count rates Data is divided into 100 sec bins |
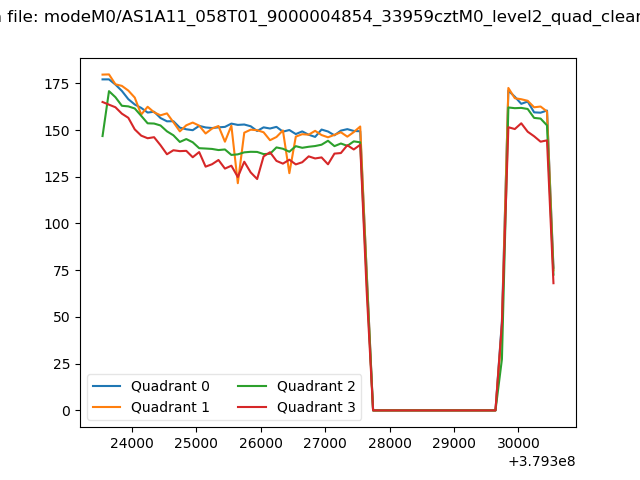 |
|
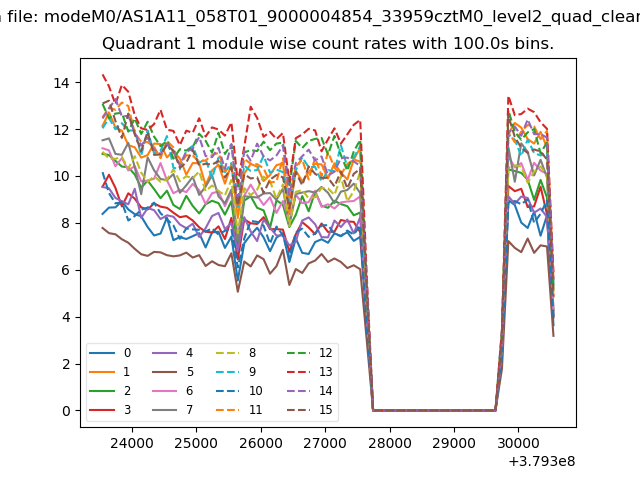
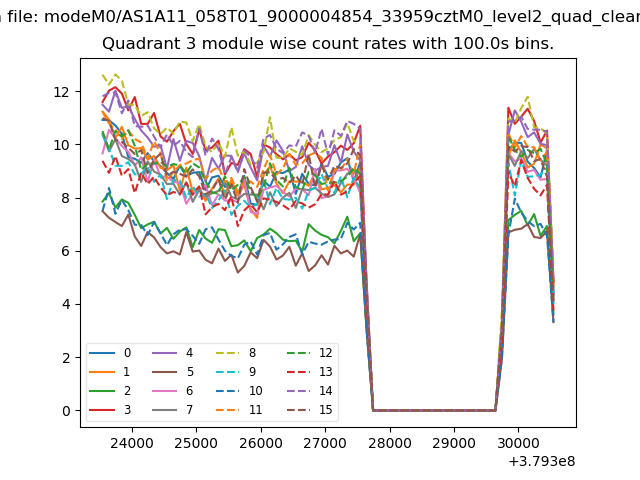
| Module-wise count rates for Quadrant A Data is divided into 100 sec bins |
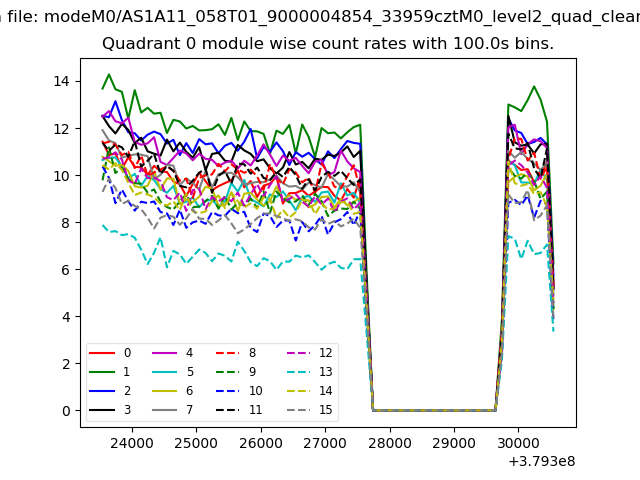 |
 |
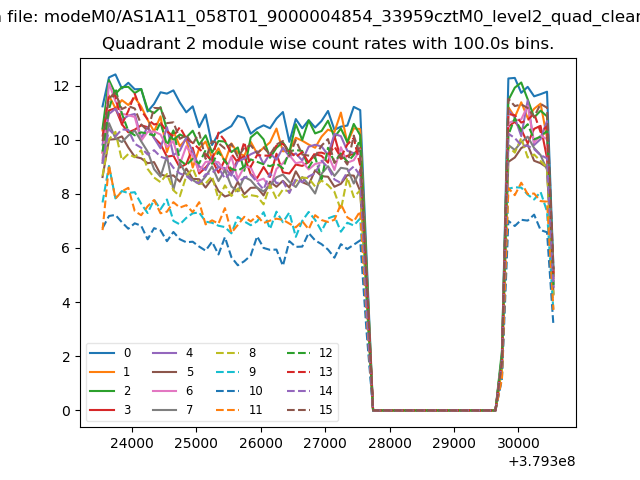
| Module-wise count rates for Quadrant B Data is divided into 100 sec bins |
 |
 |
| Module-wise count rates for Quadrant C Data is divided into 100 sec bins |
 |
 |
| Module-wise count rates for Quadrant D Data is divided into 100 sec bins |
 |
 |
| Parameter | Plot |
|---|---|
| CZT HV Monitor | 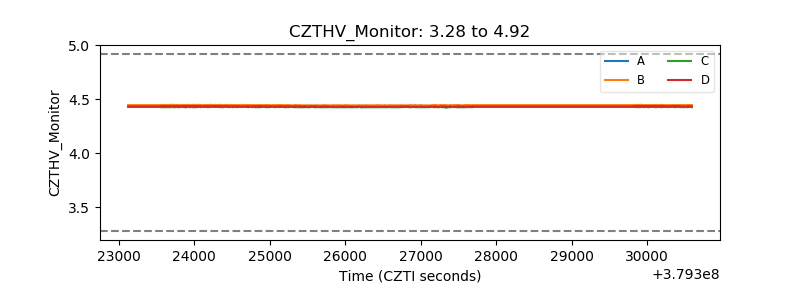 |
| D_VDD | 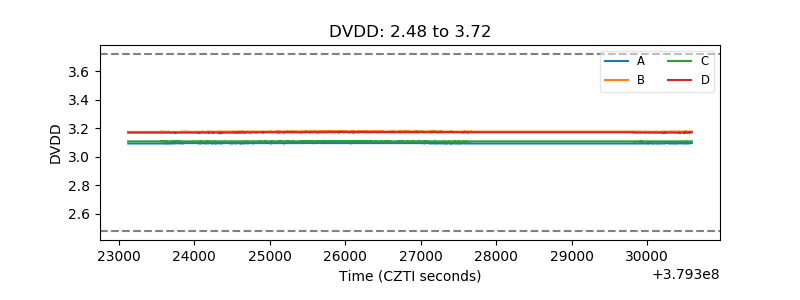 |
| Temperature 1 | 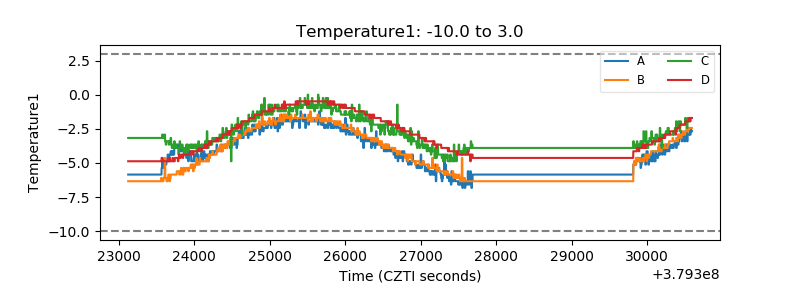 |
| Veto HV Monitor |  |
| Veto LLD | 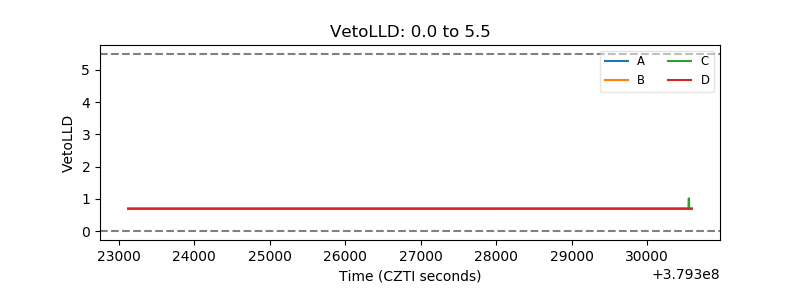 |
| Alpha Counter | 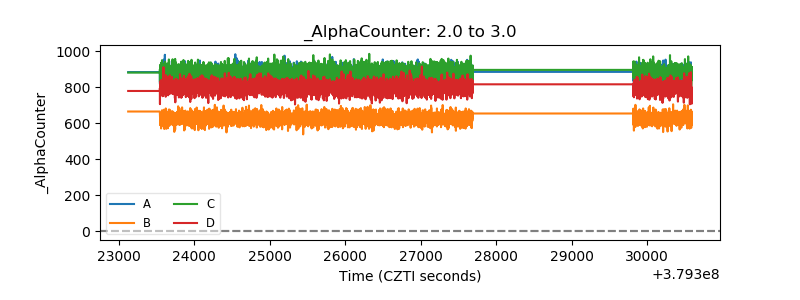 |
| _CPM_Rate | 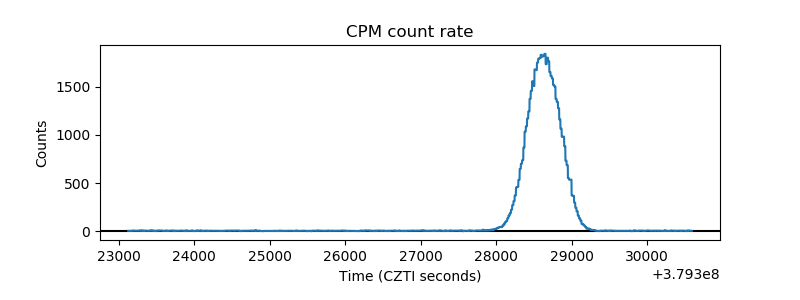 |
| CZT Counter | 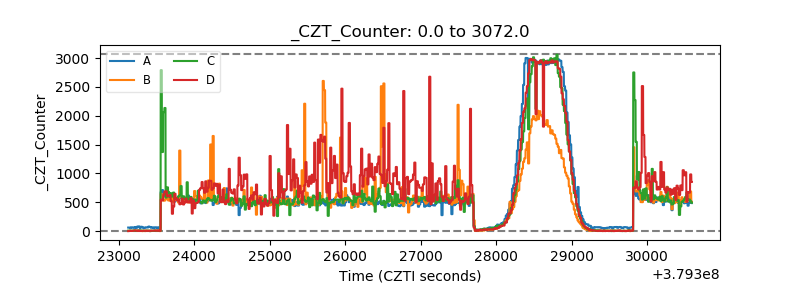 |
| +2.5 Volts monitor | 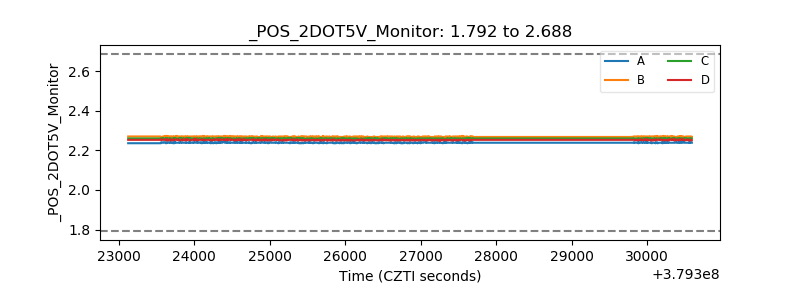 |
| +5 Volts monitor | 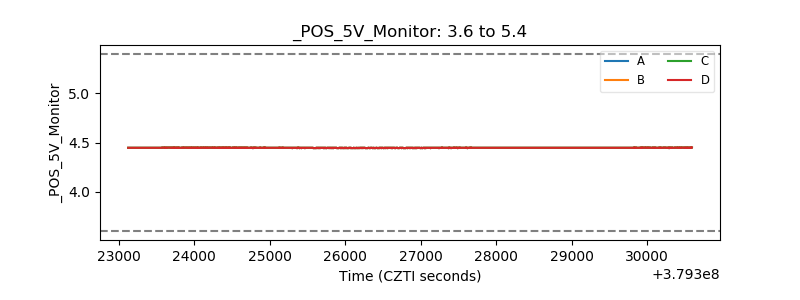 |
| _ROLL_ROT | 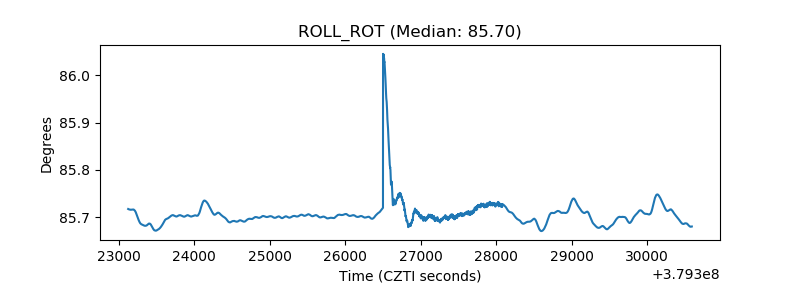 |
| _Roll_DEC | 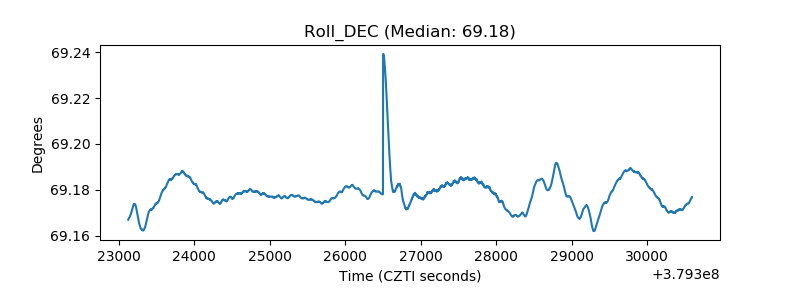 |
| _Roll_RA | 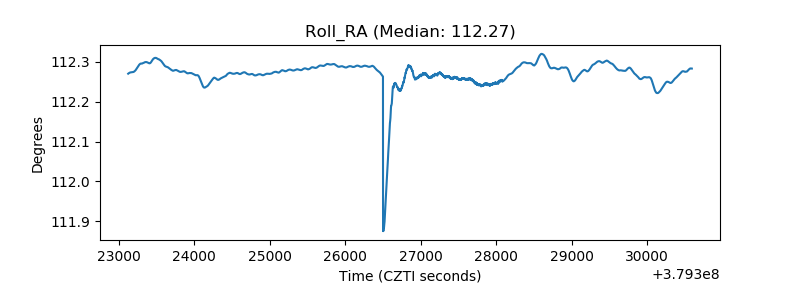 |
| Veto Counter | 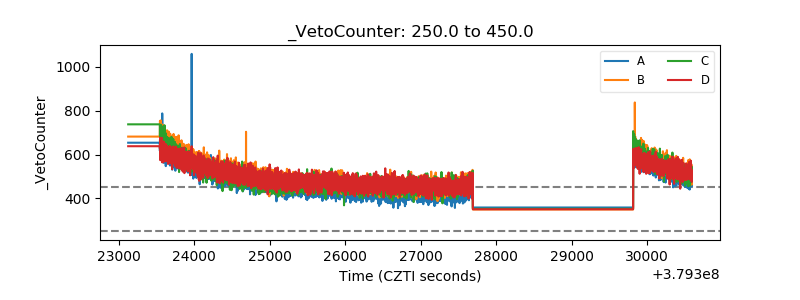 |