| Param | Original file | Final file |
|---|---|---|
| Filename | modeM0/AS1A11_058T01_9000004854_33960cztM0_level2.evt | modeM0/AS1A11_058T01_9000004854_33960cztM0_level2_quad_clean.evt |
| Size (bytes) | 458,406,720 | 105,505,920 |
| Size | 437.2 MB | 100.6 MB |
| Events in quadrant A | 2,457,813 | 750,064 |
| Events in quadrant B | 3,415,573 | 730,860 |
| Events in quadrant C | 2,923,587 | 705,258 |
| Events in quadrant D | 4,750,178 | 661,832 |
| Mode SS | |||
|---|---|---|---|
| Quadrant | BADHDUFLAG | Total packets | Discarded packets |
| A | 0 | 102 | 0 |
| B | 0 | 102 | 0 |
| C | 0 | 102 | 0 |
| D | 0 | 102 | 0 |
| Mode M9 | |||
|---|---|---|---|
| Quadrant | BADHDUFLAG | Total packets | Discarded packets |
| A | 0 | 27 | 0 |
| B | 0 | 27 | 0 |
| C | 0 | 27 | 0 |
| D | 0 | 28 | 0 |
| Mode M0 | |||
|---|---|---|---|
| Quadrant | BADHDUFLAG | Total packets | Discarded packets |
| A | 0 | 10077 | 3 |
| B | 0 | 13136 | 2 |
| C | 0 | 11305 | 2 |
| D | 0 | 17595 | 2 |
| Quadrant | Total seconds | Saturated seconds | Saturation percentage |
|---|---|---|---|
| A | 4947 | 8 | 0.161714% |
| B | 4947 | 210 | 4.244997% |
| C | 4947 | 76 | 1.536285% |
| D | 4947 | 350 | 7.074995% |
Noise dominated data is calculated using 1-second bins in cleaned event files. If a bin has >2000 counts, and if more than 50% of those come from <1% of pixels, then it is considered to be noise-dominated and hence unusable.
| Quadrant | # 1 sec bins | Bins with >0 counts | Bins with >2000 counts | High rate bins dominated by noise | Noise dominated (total time) | Noise dominated (detector-on time) | Marked lightcurve |
|---|---|---|---|---|---|---|---|
| A | 7099 | 4948 | 0 | 0 | 0.00% | 0.00% |  |
| B | 7099 | 4948 | 166 | 166 | 2.34% | 3.35% | 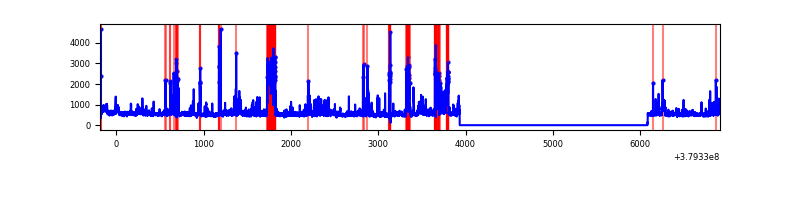 |
| C | 7099 | 4948 | 63 | 63 | 0.89% | 1.27% | 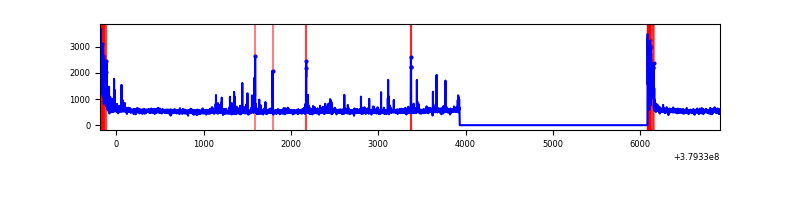 |
| D | 7099 | 4948 | 299 | 299 | 4.21% | 6.04% | 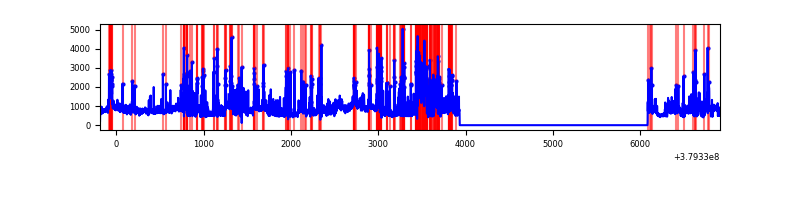 |
Top three noisy pixels from each quadrant. If the there are fewer than three noisy pixels in the level2.evt file, extra rows are filled as -1
| Pixel properties | Quadrant properties | ||||||
|---|---|---|---|---|---|---|---|
| Quadrant | DetID | PixID | Counts | Sigma | Mean | Median | Sigma |
| A | 10 | 83 | 14680 | 113.06 | 632 | 620 | 124.4 |
| A | 13 | 254 | 9350 | 70.2 | 632 | 620 | 124.4 |
| A | 3 | 137 | 5591 | 39.97 | 632 | 620 | 124.4 |
| B | 5 | 172 | 467954 | 4099.76 | 610 | 596 | 114.0 |
| B | 15 | 222 | 210497 | 1841.3 | 610 | 596 | 114.0 |
| B | 3 | 112 | 115450 | 1007.52 | 610 | 596 | 114.0 |
| C | 0 | 10 | 298946 | 2216.78 | 593 | 599 | 134.6 |
| C | 15 | 214 | 219217 | 1624.38 | 593 | 599 | 134.6 |
| C | 3 | 233 | 43340 | 317.57 | 593 | 599 | 134.6 |
| D | 8 | 195 | 849713 | 5340.37 | 584 | 571 | 159.0 |
| D | 12 | 6 | 438784 | 2755.98 | 584 | 571 | 159.0 |
| D | 13 | 249 | 304216 | 1909.66 | 584 | 571 | 159.0 |
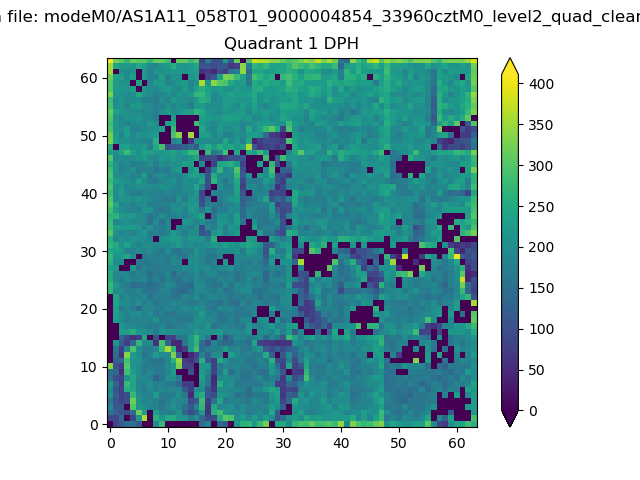
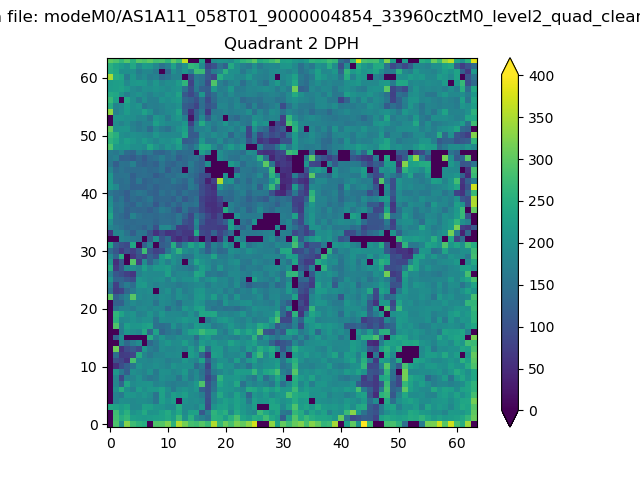
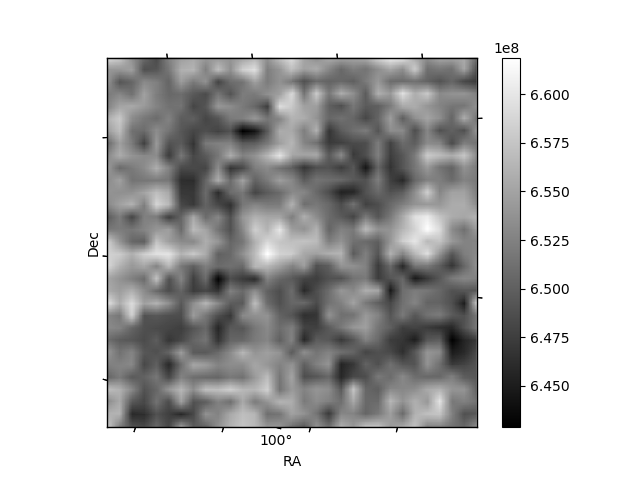
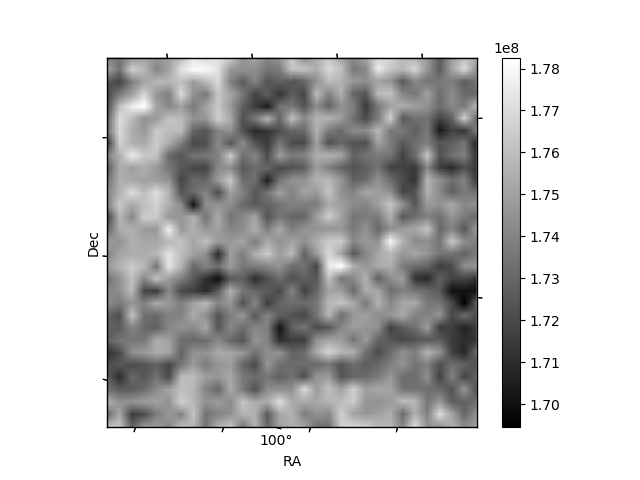
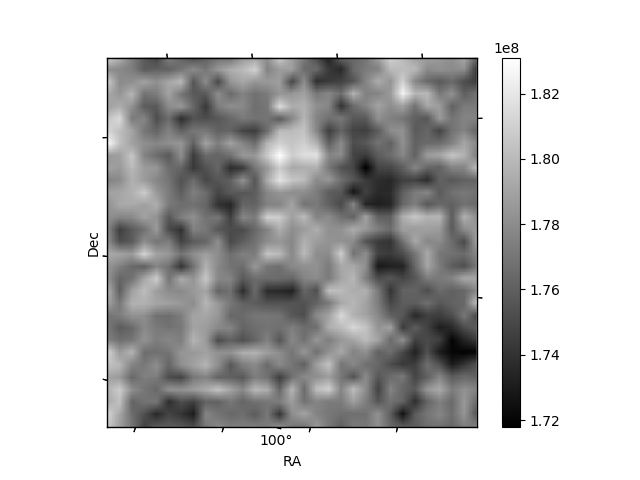
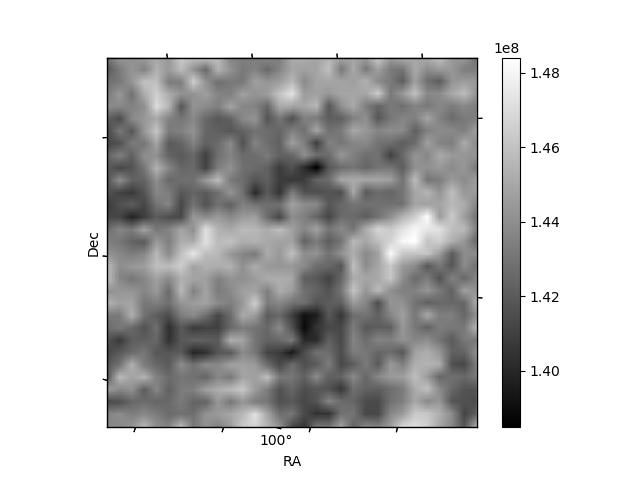
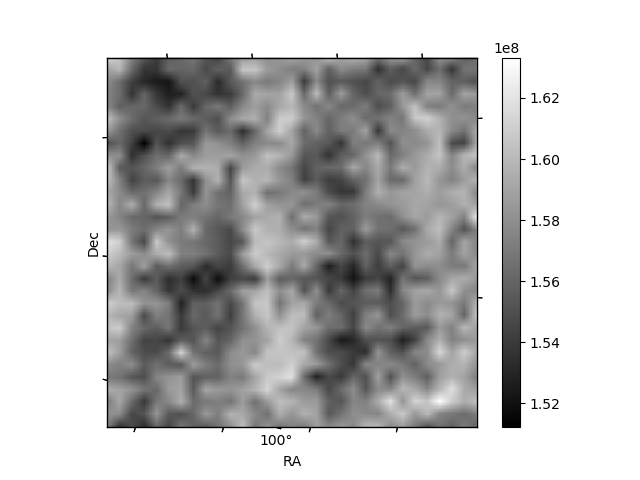
Histogram calculated using DETX and DETY for each event in the final _common_clean file
| Quadrant A | 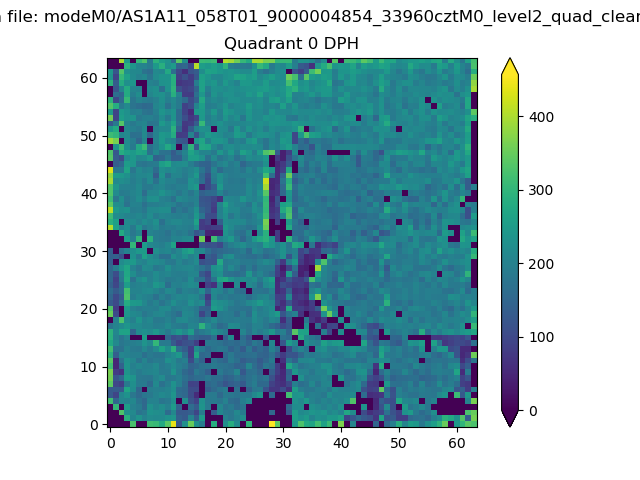 |
 |
Quadrant B |
|---|---|---|---|
| Quadrant D | 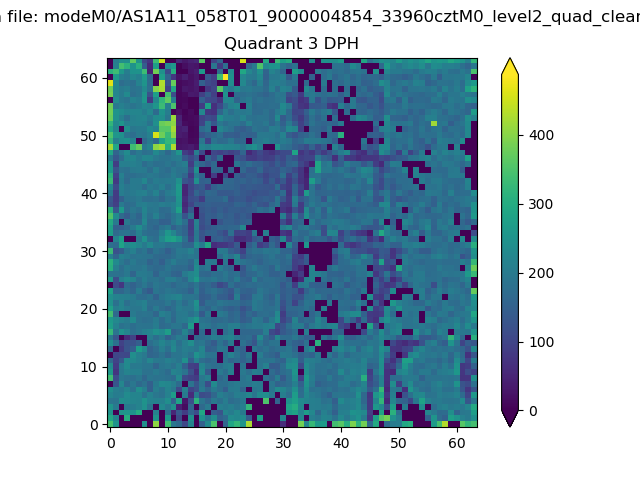 |
 |
Quadrant C |
| Plot type | Count rate plots | Images |
|---|---|---|
| Comparison with Poisson distribution Blue bars denote a histogram of data divided into 1 sec bins. Red curve is a Poisson curve with rate = median count rate of data. |
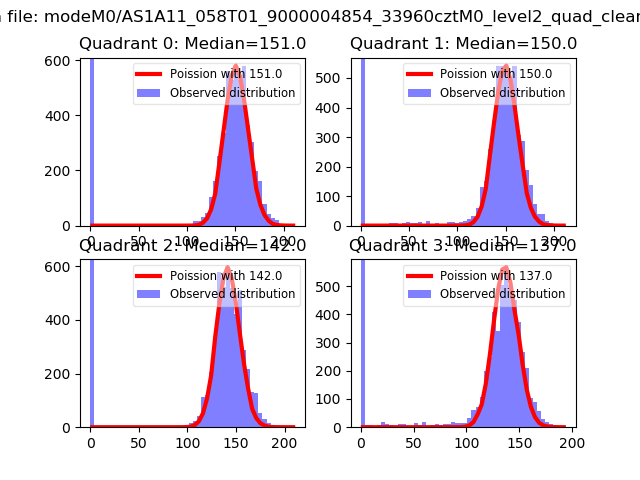 |
 |
| Quadrant-wise count rates Data is divided into 100 sec bins |
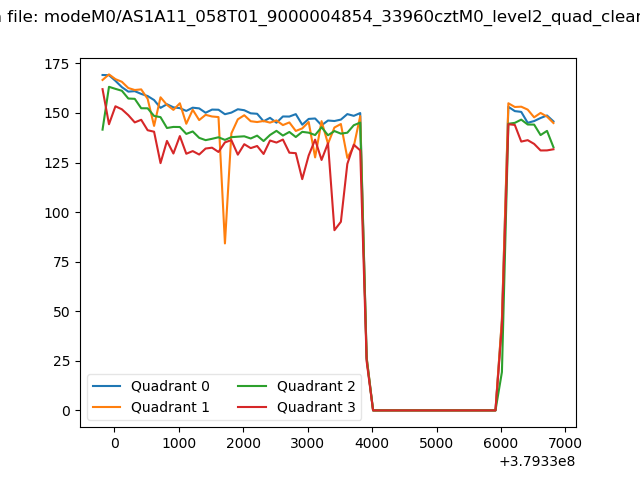 |
|
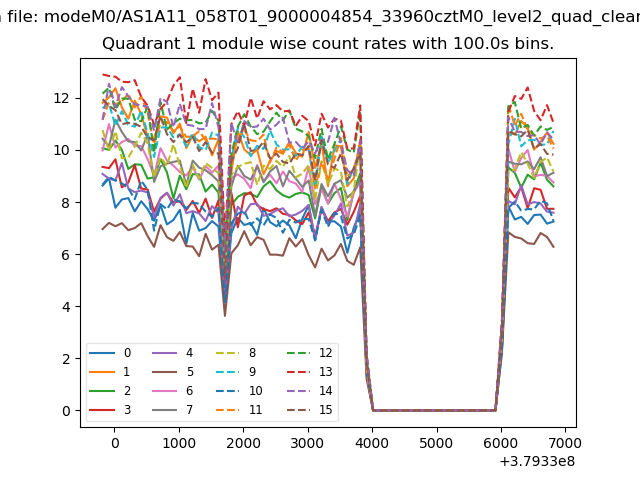
| Module-wise count rates for Quadrant A Data is divided into 100 sec bins |
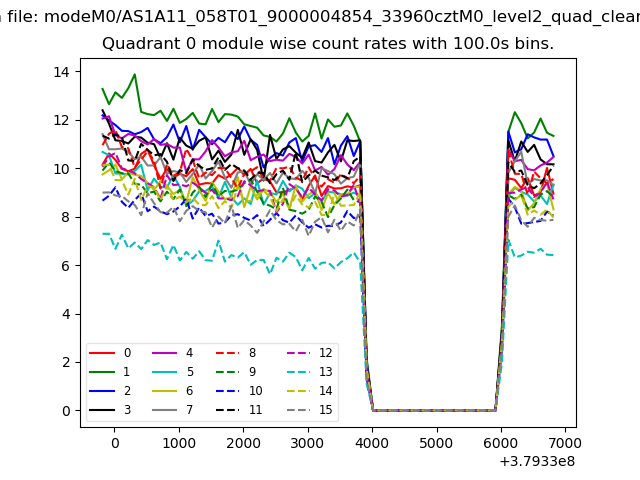 |
 |
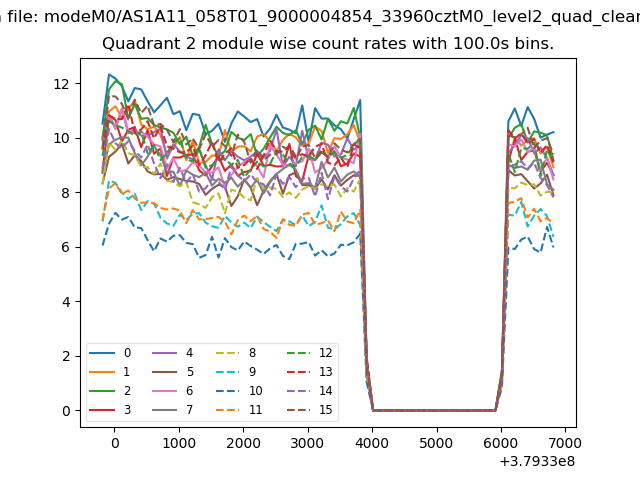
| Module-wise count rates for Quadrant B Data is divided into 100 sec bins |
 |
 |
| Module-wise count rates for Quadrant C Data is divided into 100 sec bins |
 |
 |
| Module-wise count rates for Quadrant D Data is divided into 100 sec bins |
 |
 |
| Parameter | Plot |
|---|---|
| CZT HV Monitor | 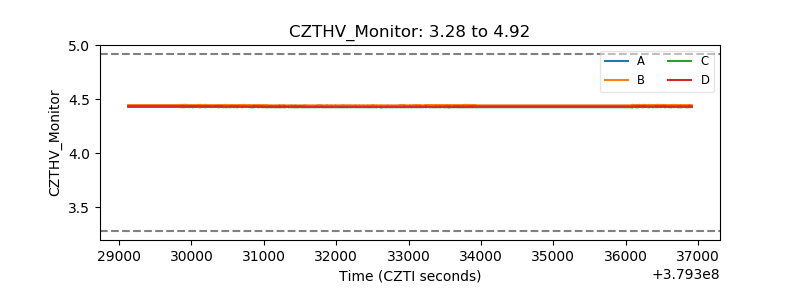 |
| D_VDD | 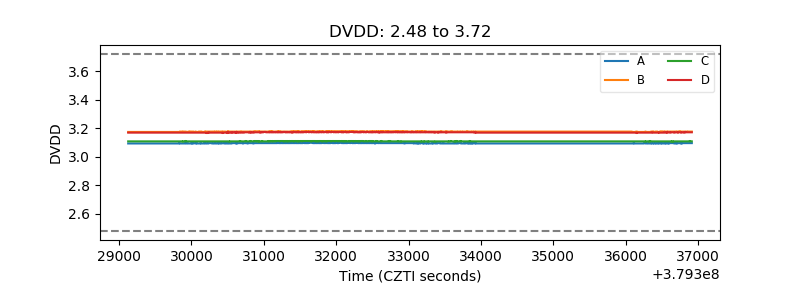 |
| Temperature 1 | 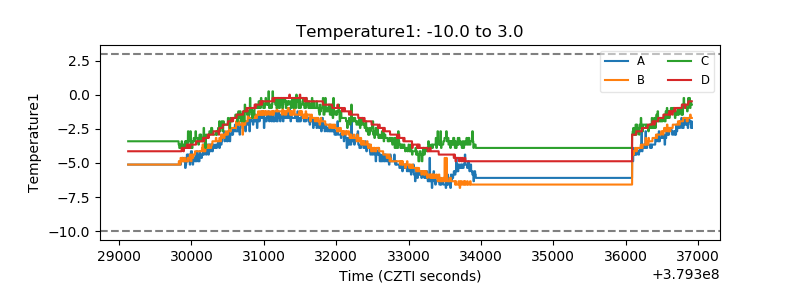 |
| Veto HV Monitor | 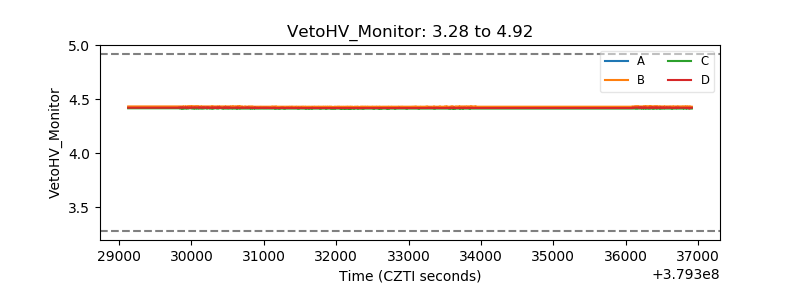 |
| Veto LLD | 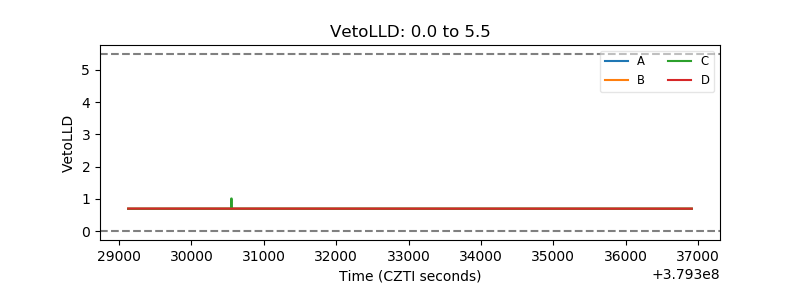 |
| Alpha Counter | 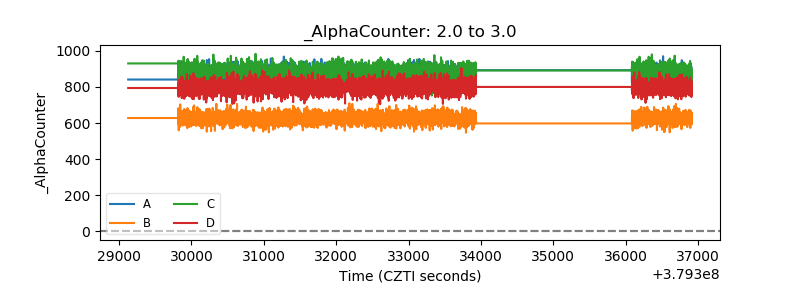 |
| _CPM_Rate | 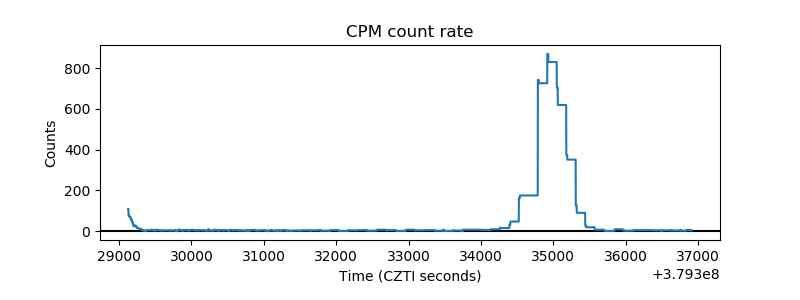 |
| CZT Counter | 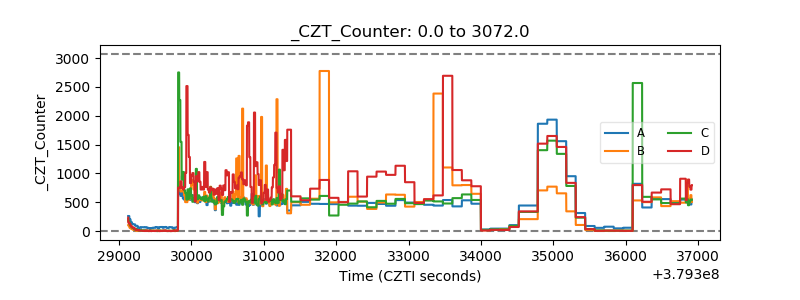 |
| +2.5 Volts monitor | 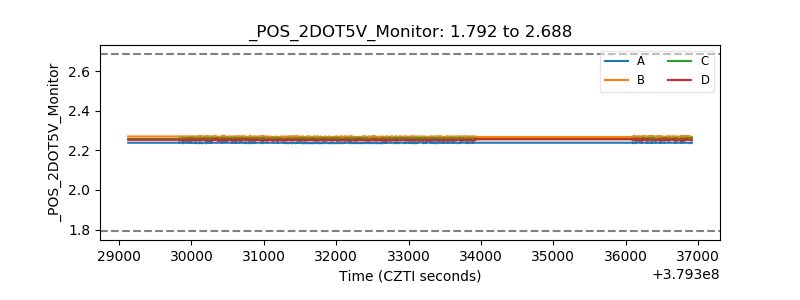 |
| +5 Volts monitor | 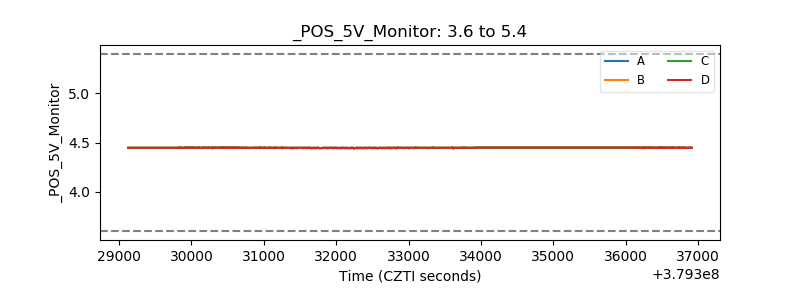 |
| _ROLL_ROT | 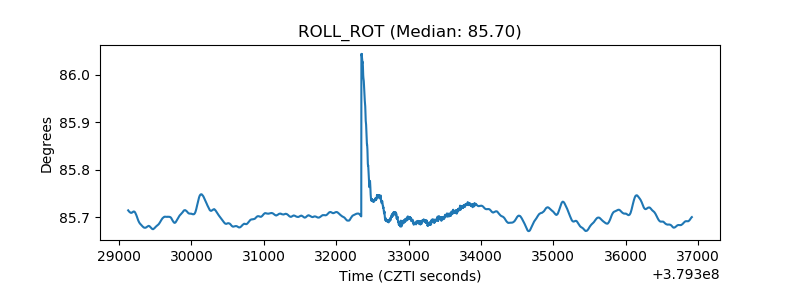 |
| _Roll_DEC | 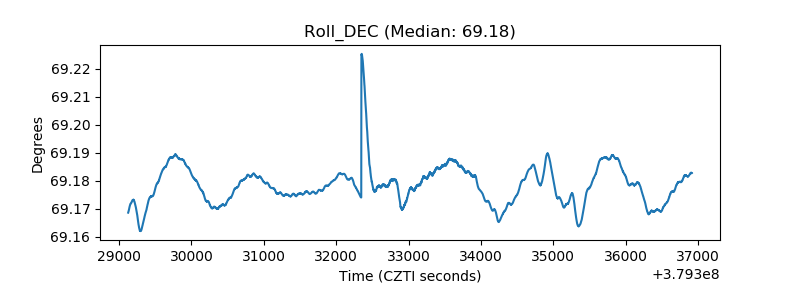 |
| _Roll_RA | 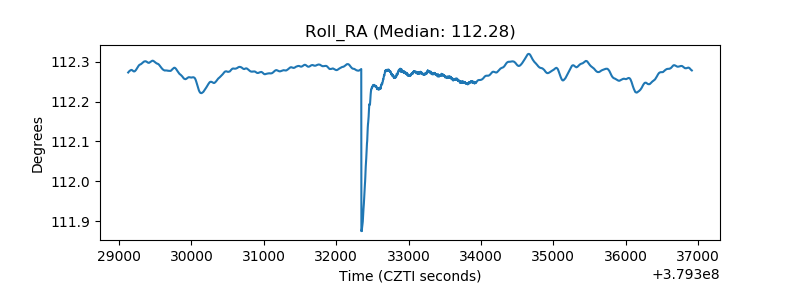 |
| Veto Counter | 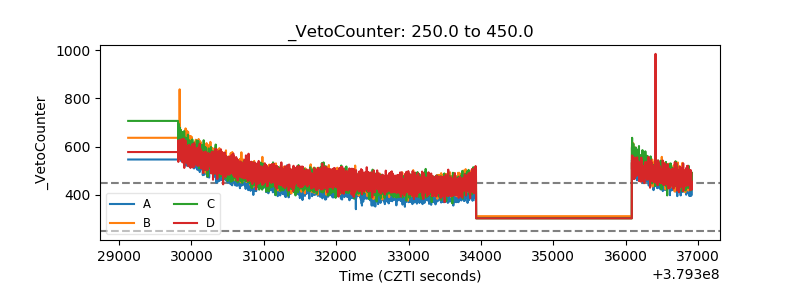 |