| Param | Original file | Final file |
|---|---|---|
| Filename | modeM0/AS1A11_058T01_9000004854_33961cztM0_level2.evt | modeM0/AS1A11_058T01_9000004854_33961cztM0_level2_quad_clean.evt |
| Size (bytes) | 481,590,720 | 106,030,080 |
| Size | 459.3 MB | 101.1 MB |
| Events in quadrant A | 2,602,457 | 747,309 |
| Events in quadrant B | 3,215,641 | 740,092 |
| Events in quadrant C | 3,084,865 | 703,047 |
| Events in quadrant D | 5,324,925 | 651,723 |
| Mode SS | |||
|---|---|---|---|
| Quadrant | BADHDUFLAG | Total packets | Discarded packets |
| A | 0 | 106 | 0 |
| B | 0 | 106 | 0 |
| C | 0 | 106 | 0 |
| D | 0 | 106 | 0 |
| Mode M9 | |||
|---|---|---|---|
| Quadrant | BADHDUFLAG | Total packets | Discarded packets |
| A | 0 | 28 | 0 |
| B | 0 | 28 | 0 |
| C | 0 | 28 | 0 |
| D | 0 | 29 | 0 |
| Mode M0 | |||
|---|---|---|---|
| Quadrant | BADHDUFLAG | Total packets | Discarded packets |
| A | 0 | 10892 | 3 |
| B | 0 | 12714 | 2 |
| C | 0 | 12009 | 2 |
| D | 0 | 19437 | 2 |
| Quadrant | Total seconds | Saturated seconds | Saturation percentage |
|---|---|---|---|
| A | 5274 | 6 | 0.113766% |
| B | 5274 | 119 | 2.256352% |
| C | 5274 | 74 | 1.403110% |
| D | 5274 | 540 | 10.238908% |
Noise dominated data is calculated using 1-second bins in cleaned event files. If a bin has >2000 counts, and if more than 50% of those come from <1% of pixels, then it is considered to be noise-dominated and hence unusable.
| Quadrant | # 1 sec bins | Bins with >0 counts | Bins with >2000 counts | High rate bins dominated by noise | Noise dominated (total time) | Noise dominated (detector-on time) | Marked lightcurve |
|---|---|---|---|---|---|---|---|
| A | 7337 | 5275 | 1 | 1 | 0.01% | 0.02% | 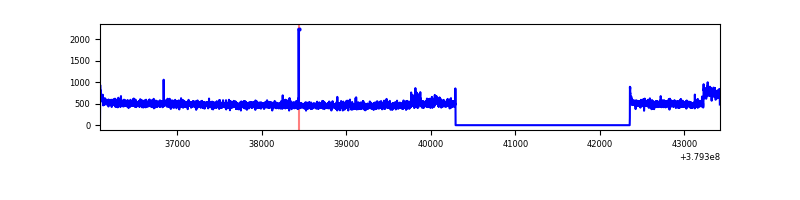 |
| B | 7337 | 5275 | 86 | 86 | 1.17% | 1.63% | 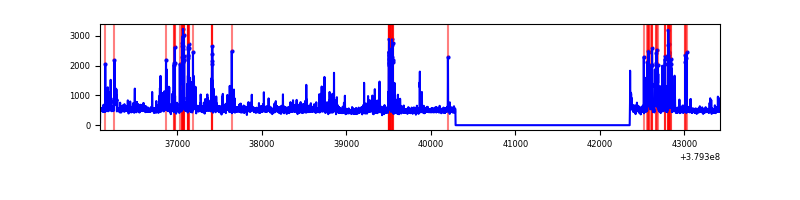 |
| C | 7337 | 5275 | 51 | 51 | 0.70% | 0.97% | 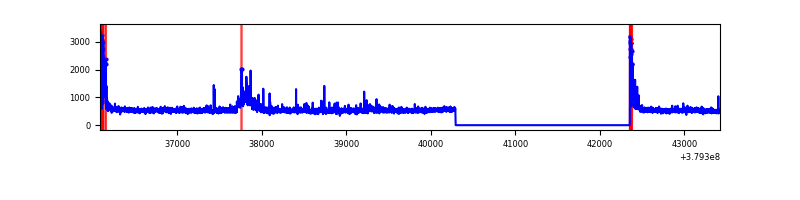 |
| D | 7337 | 5275 | 432 | 432 | 5.89% | 8.19% | 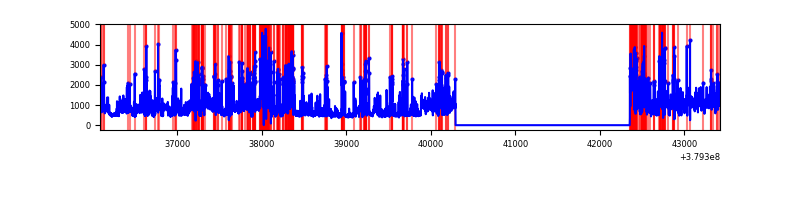 |
Top three noisy pixels from each quadrant. If the there are fewer than three noisy pixels in the level2.evt file, extra rows are filled as -1
| Pixel properties | Quadrant properties | ||||||
|---|---|---|---|---|---|---|---|
| Quadrant | DetID | PixID | Counts | Sigma | Mean | Median | Sigma |
| A | 15 | 169 | 100372 | 780.55 | 642 | 630 | 127.8 |
| A | 10 | 83 | 15045 | 112.81 | 642 | 630 | 127.8 |
| A | 13 | 254 | 9231 | 67.31 | 642 | 630 | 127.8 |
| B | 5 | 172 | 441934 | 3786.04 | 628 | 615 | 116.6 |
| B | 3 | 112 | 116567 | 994.74 | 628 | 615 | 116.6 |
| B | 4 | 232 | 45052 | 381.22 | 628 | 615 | 116.6 |
| C | 3 | 233 | 233276 | 1666.09 | 610 | 613 | 139.6 |
| C | 15 | 214 | 232234 | 1658.63 | 610 | 613 | 139.6 |
| C | 0 | 10 | 218024 | 1556.87 | 610 | 613 | 139.6 |
| D | 7 | 238 | 1043257 | 7013.51 | 597 | 581 | 148.7 |
| D | 8 | 195 | 886404 | 5958.45 | 597 | 581 | 148.7 |
| D | 13 | 249 | 460616 | 3094.4 | 597 | 581 | 148.7 |
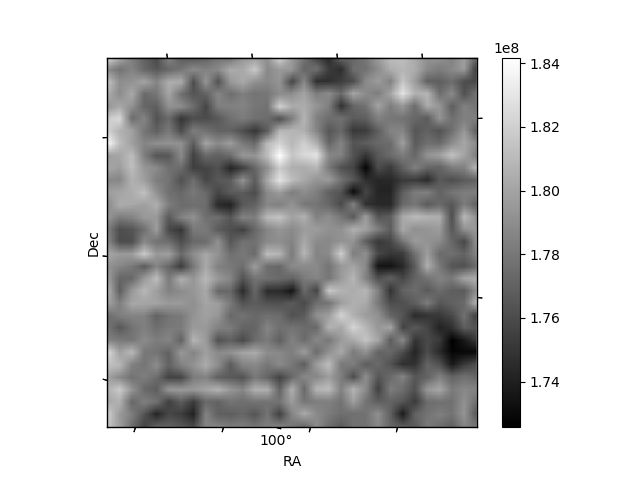
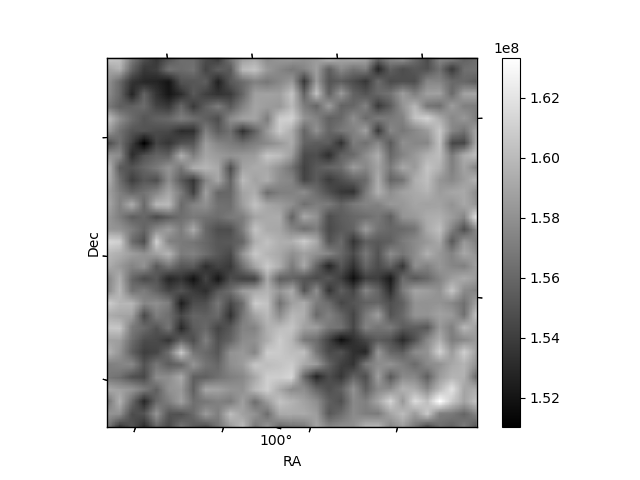
Histogram calculated using DETX and DETY for each event in the final _common_clean file
| Quadrant A | 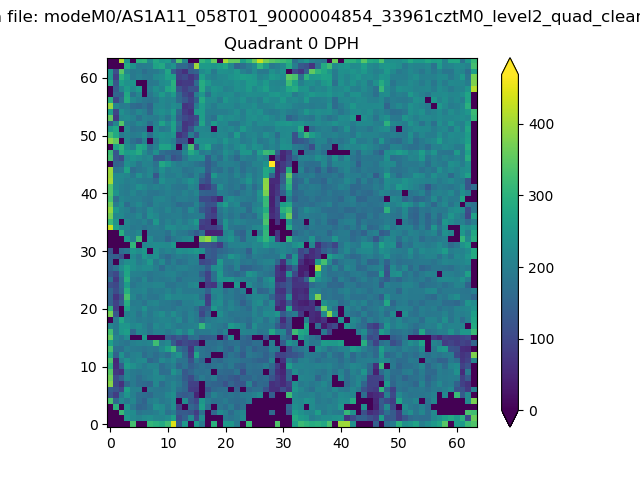 |
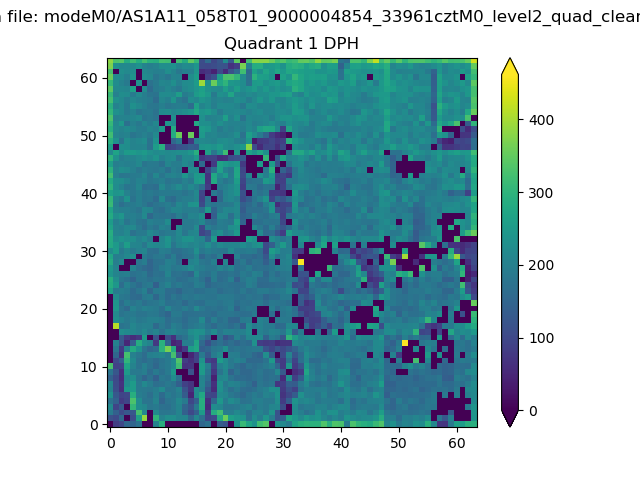 |
Quadrant B |
|---|---|---|---|
| Quadrant D |  |
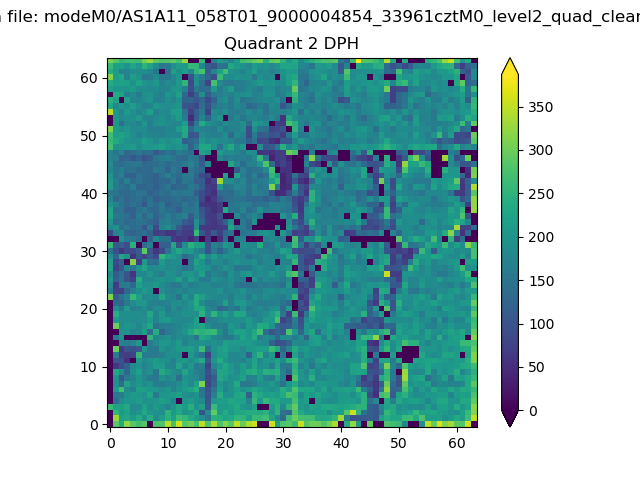 |
Quadrant C |
| Plot type | Count rate plots | Images |
|---|---|---|
| Comparison with Poisson distribution Blue bars denote a histogram of data divided into 1 sec bins. Red curve is a Poisson curve with rate = median count rate of data. |
 |
 |
| Quadrant-wise count rates Data is divided into 100 sec bins |
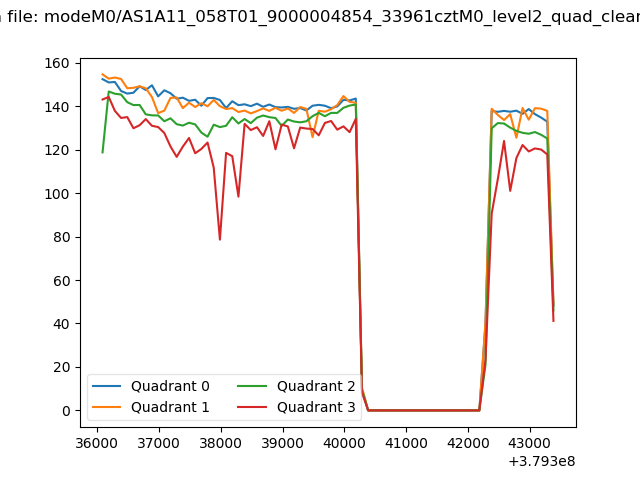 |
|
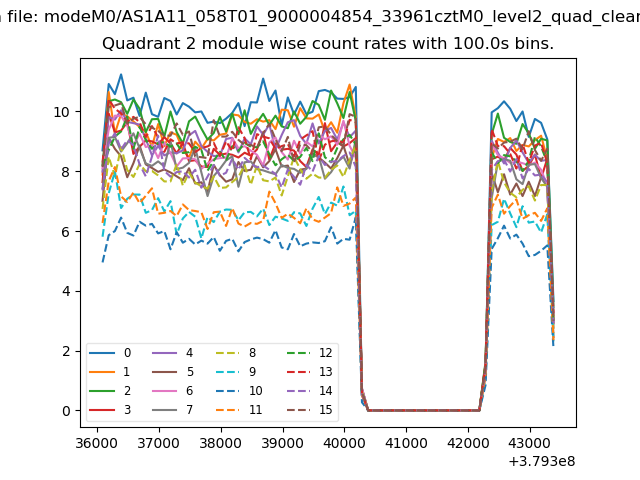
| Module-wise count rates for Quadrant A Data is divided into 100 sec bins |
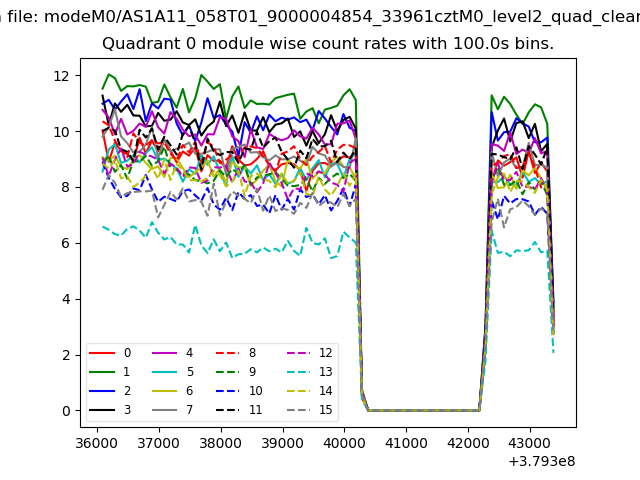 |
 |
| Module-wise count rates for Quadrant B Data is divided into 100 sec bins |
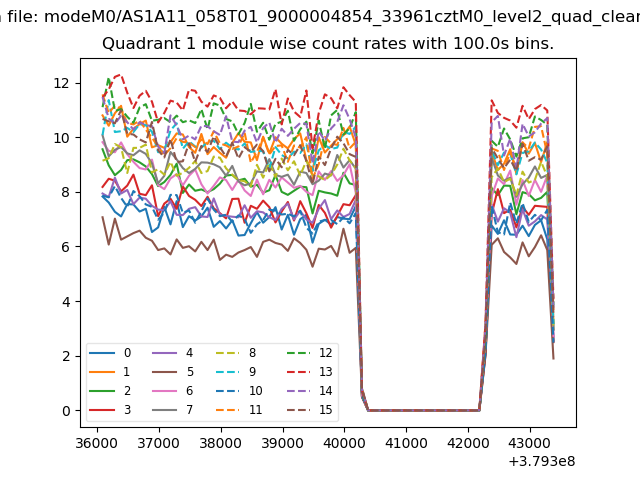 |
 |
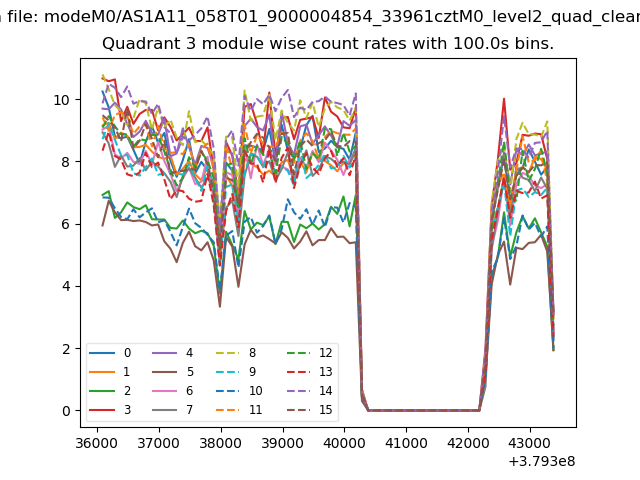
| Module-wise count rates for Quadrant C Data is divided into 100 sec bins |
 |
 |
| Module-wise count rates for Quadrant D Data is divided into 100 sec bins |
 |
 |
| Parameter | Plot |
|---|---|
| CZT HV Monitor | 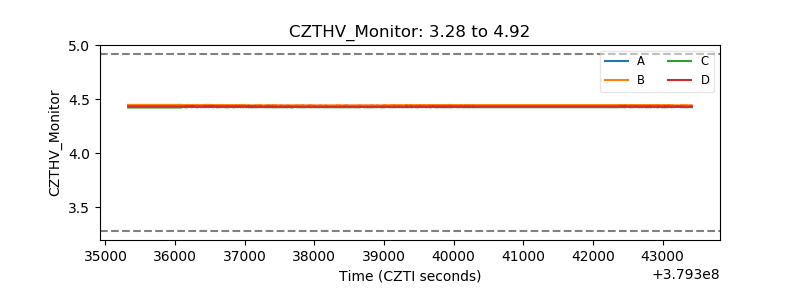 |
| D_VDD | 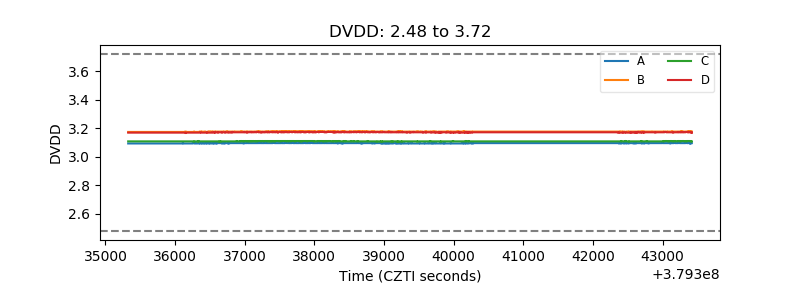 |
| Temperature 1 | 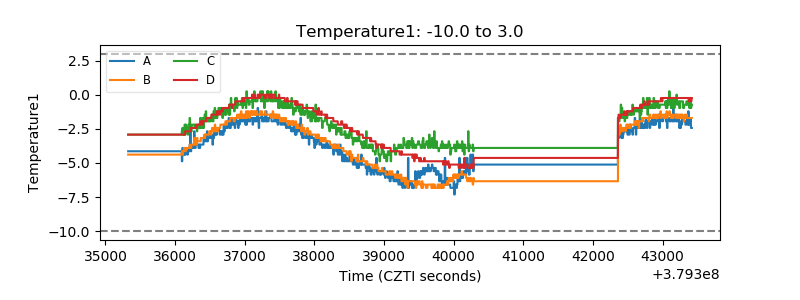 |
| Veto HV Monitor | 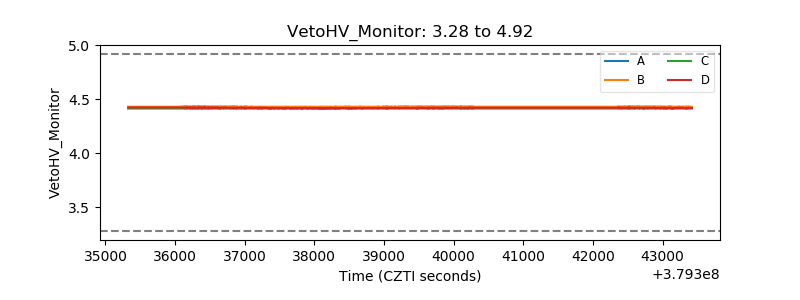 |
| Veto LLD | 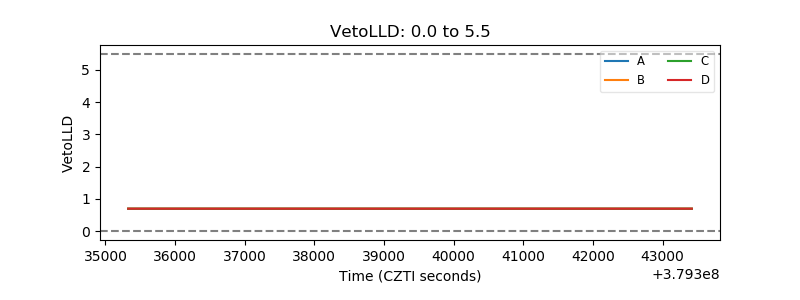 |
| Alpha Counter | 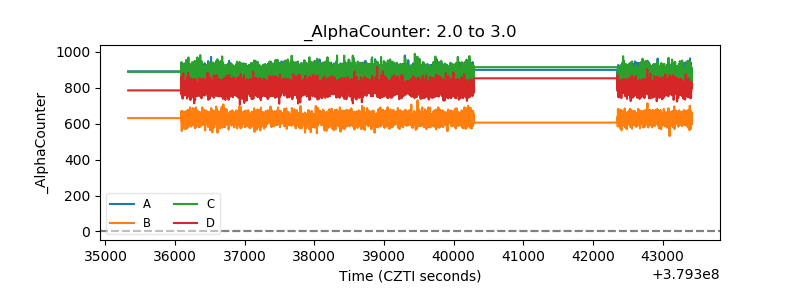 |
| _CPM_Rate | 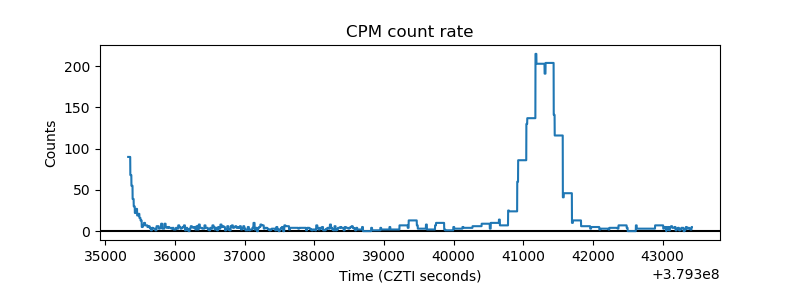 |
| CZT Counter | 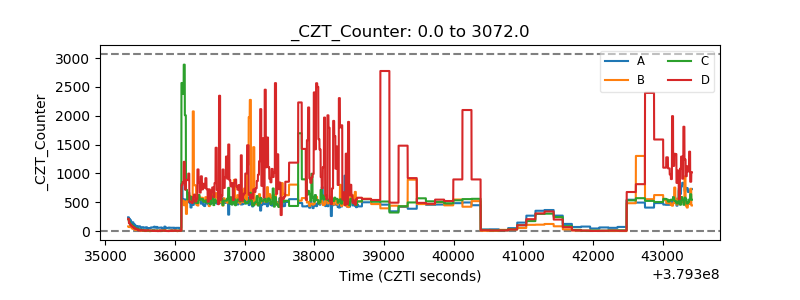 |
| +2.5 Volts monitor |  |
| +5 Volts monitor |  |
| _ROLL_ROT | 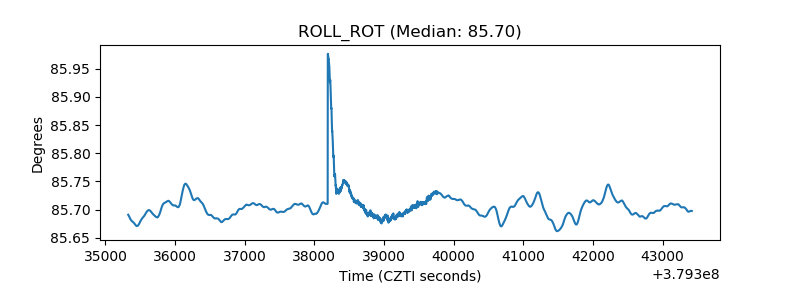 |
| _Roll_DEC | 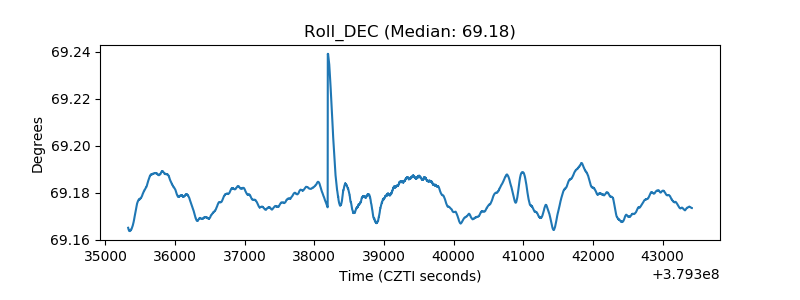 |
| _Roll_RA | 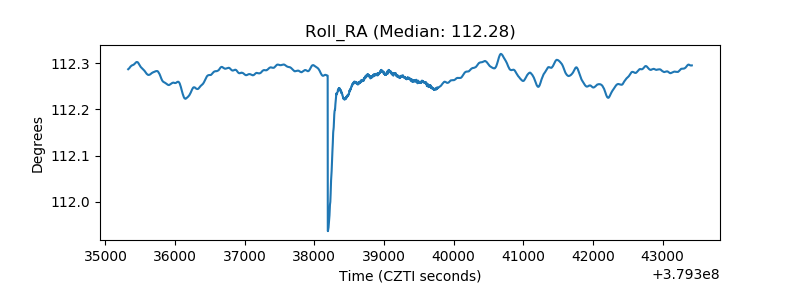 |
| Veto Counter | 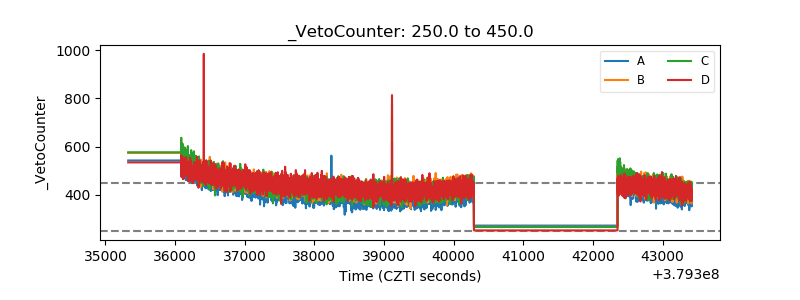 |