| Param | Original file | Final file |
|---|---|---|
| Filename | modeM0/AS1A11_058T01_9000004854_33962cztM0_level2.evt | modeM0/AS1A11_058T01_9000004854_33962cztM0_level2_quad_clean.evt |
| Size (bytes) | 546,935,040 | 99,293,760 |
| Size | 521.6 MB | 94.7 MB |
| Events in quadrant A | 4,447,380 | 681,717 |
| Events in quadrant B | 3,187,364 | 689,901 |
| Events in quadrant C | 2,811,987 | 665,292 |
| Events in quadrant D | 5,762,686 | 602,528 |
| Mode SS | |||
|---|---|---|---|
| Quadrant | BADHDUFLAG | Total packets | Discarded packets |
| A | 0 | 110 | 0 |
| B | 0 | 110 | 0 |
| C | 0 | 110 | 0 |
| D | 0 | 110 | 0 |
| Mode M9 | |||
|---|---|---|---|
| Quadrant | BADHDUFLAG | Total packets | Discarded packets |
| A | 0 | 17 | 0 |
| B | 0 | 17 | 0 |
| C | 0 | 17 | 0 |
| D | 0 | 17 | 0 |
| Mode M0 | |||
|---|---|---|---|
| Quadrant | BADHDUFLAG | Total packets | Discarded packets |
| A | 0 | 16870 | 2 |
| B | 0 | 12753 | 1 |
| C | 0 | 11257 | 1 |
| D | 0 | 20740 | 1 |
| Quadrant | Total seconds | Saturated seconds | Saturation percentage |
|---|---|---|---|
| A | 5232 | 140 | 2.675841% |
| B | 5232 | 154 | 2.943425% |
| C | 5232 | 53 | 1.012997% |
| D | 5232 | 652 | 12.461774% |
Noise dominated data is calculated using 1-second bins in cleaned event files. If a bin has >2000 counts, and if more than 50% of those come from <1% of pixels, then it is considered to be noise-dominated and hence unusable.
| Quadrant | # 1 sec bins | Bins with >0 counts | Bins with >2000 counts | High rate bins dominated by noise | Noise dominated (total time) | Noise dominated (detector-on time) | Marked lightcurve |
|---|---|---|---|---|---|---|---|
| A | 7023 | 5232 | 142 | 142 | 2.02% | 2.71% | 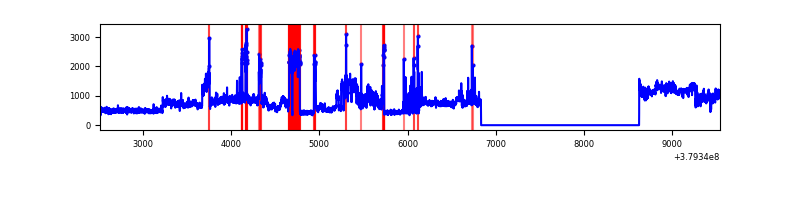 |
| B | 7023 | 5232 | 113 | 113 | 1.61% | 2.16% | 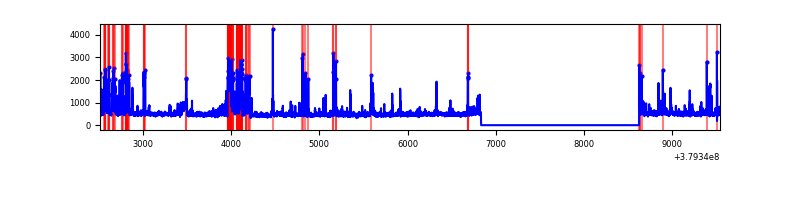 |
| C | 7023 | 5232 | 34 | 34 | 0.48% | 0.65% | 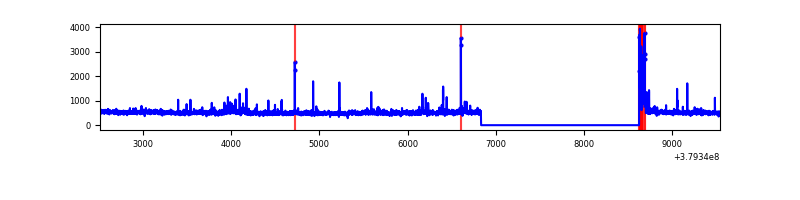 |
| D | 7023 | 5232 | 538 | 538 | 7.66% | 10.28% | 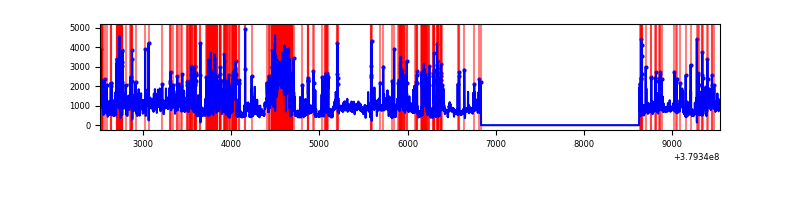 |
Top three noisy pixels from each quadrant. If the there are fewer than three noisy pixels in the level2.evt file, extra rows are filled as -1
| Pixel properties | Quadrant properties | ||||||
|---|---|---|---|---|---|---|---|
| Quadrant | DetID | PixID | Counts | Sigma | Mean | Median | Sigma |
| A | 15 | 169 | 2002687 | 16621.85 | 605 | 594 | 120.4 |
| A | 14 | 238 | 91341 | 753.4 | 605 | 594 | 120.4 |
| A | 10 | 83 | 10178 | 79.57 | 605 | 594 | 120.4 |
| B | 5 | 172 | 613305 | 5378.65 | 602 | 588 | 113.9 |
| B | 3 | 112 | 64466 | 560.74 | 602 | 588 | 113.9 |
| B | 0 | 229 | 41228 | 356.75 | 602 | 588 | 113.9 |
| C | 15 | 214 | 229670 | 1695.12 | 586 | 590 | 135.1 |
| C | 0 | 10 | 173616 | 1280.34 | 586 | 590 | 135.1 |
| C | 3 | 233 | 82147 | 603.5 | 586 | 590 | 135.1 |
| D | 8 | 195 | 1343983 | 8819.45 | 558 | 544 | 152.3 |
| D | 7 | 238 | 812967 | 5333.42 | 558 | 544 | 152.3 |
| D | 13 | 249 | 484984 | 3180.27 | 558 | 544 | 152.3 |
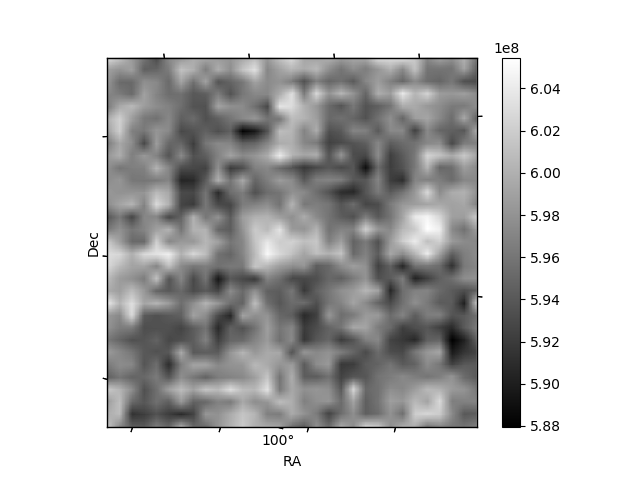
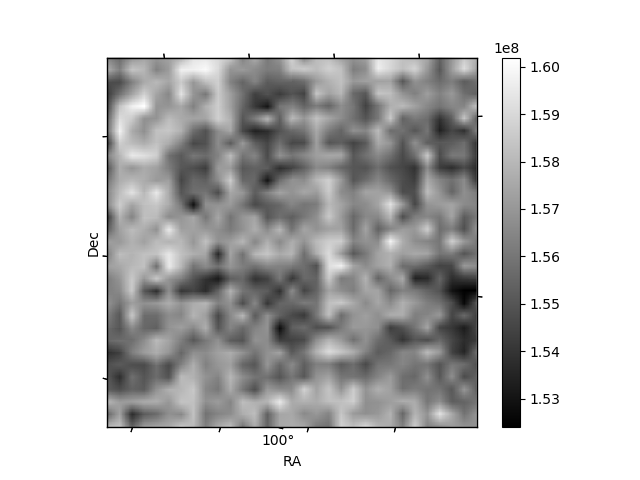
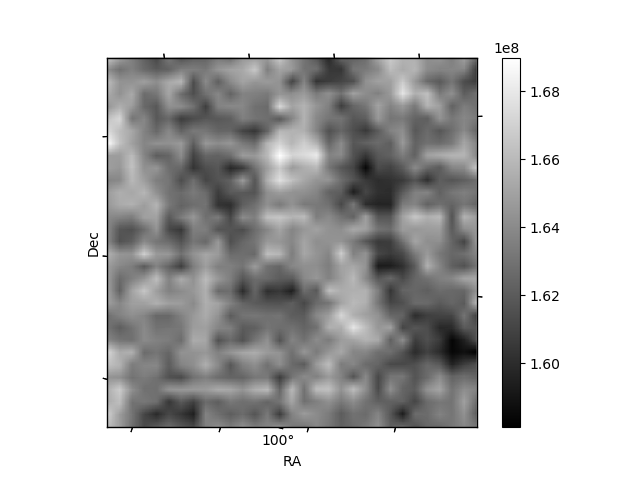
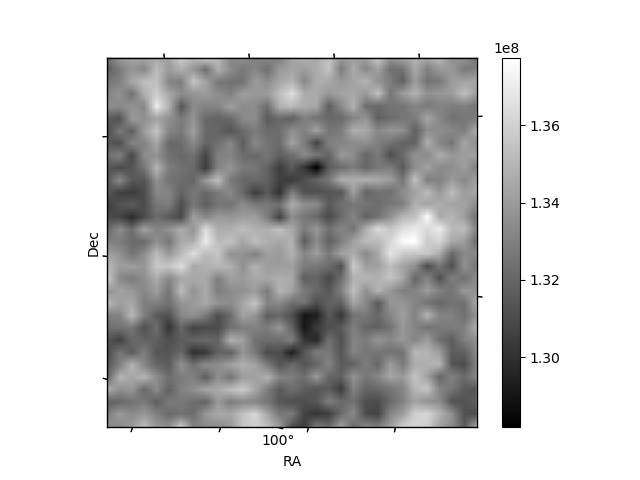
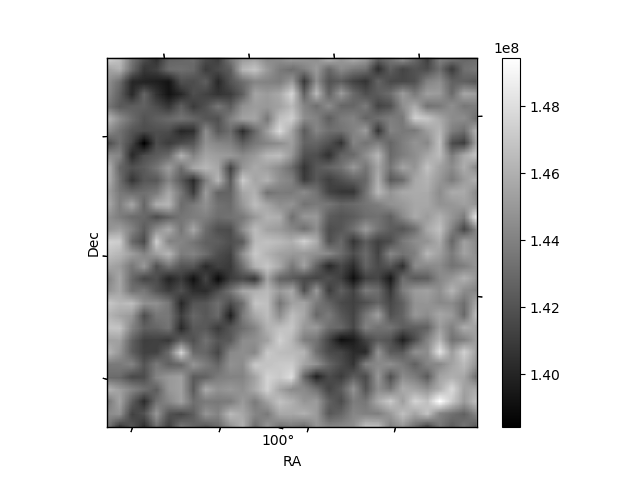
Histogram calculated using DETX and DETY for each event in the final _common_clean file
| Quadrant A | 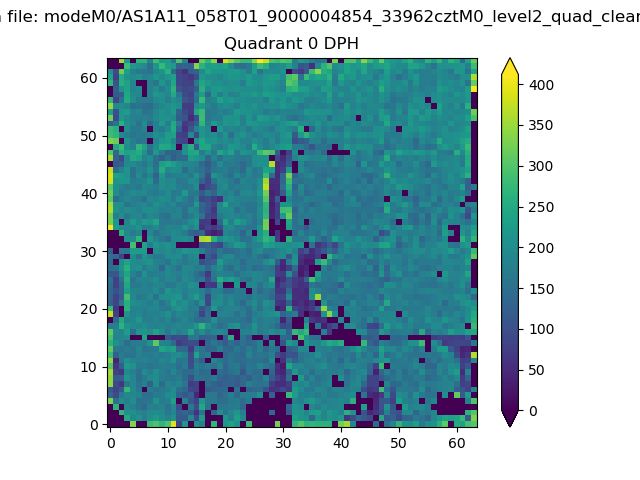 |
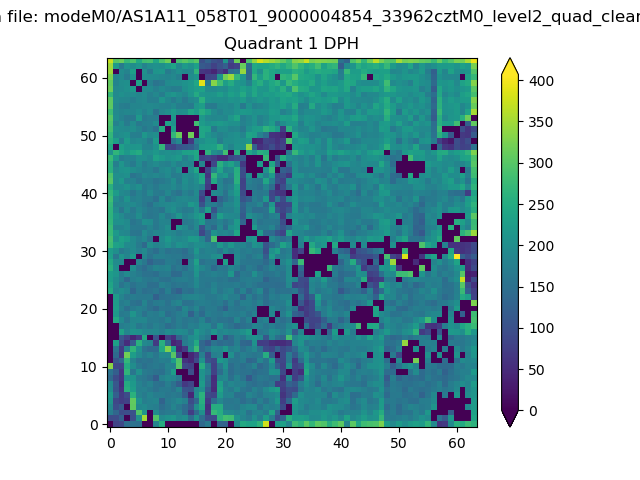 |
Quadrant B |
|---|---|---|---|
| Quadrant D | 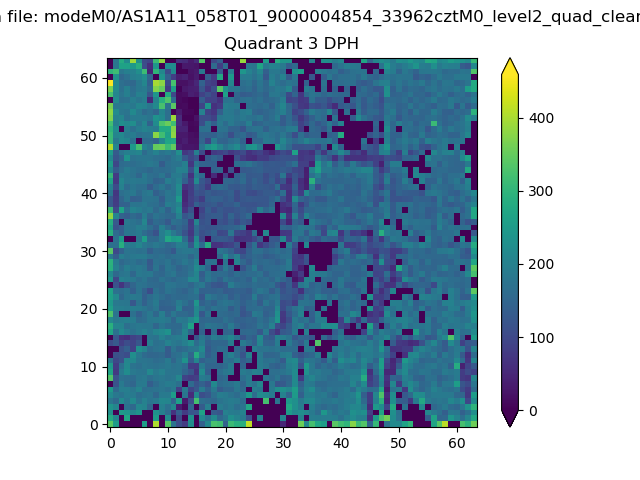 |
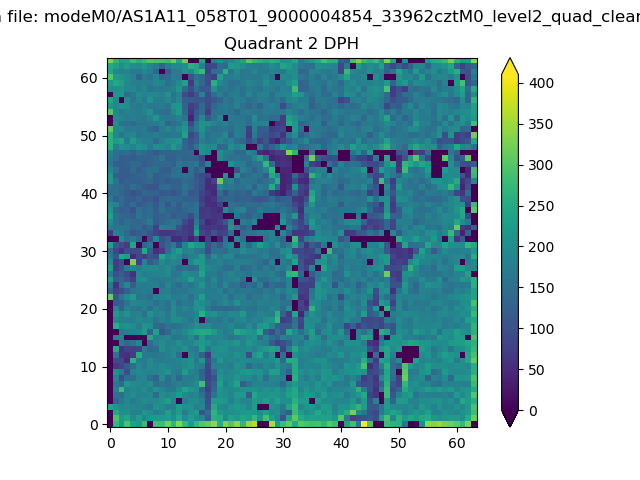 |
Quadrant C |
| Plot type | Count rate plots | Images |
|---|---|---|
| Comparison with Poisson distribution Blue bars denote a histogram of data divided into 1 sec bins. Red curve is a Poisson curve with rate = median count rate of data. |
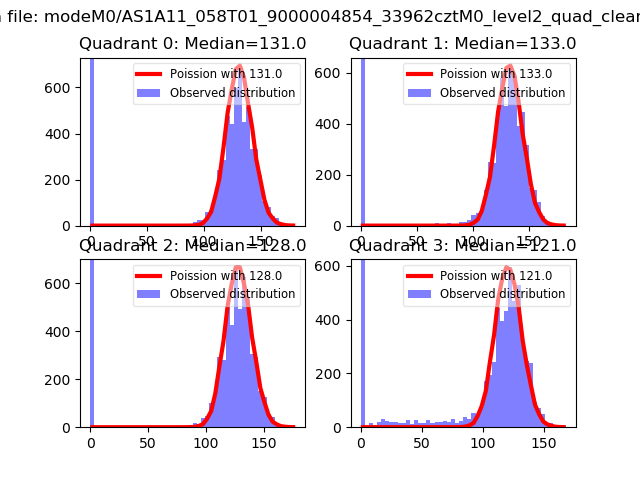 |
 |
| Quadrant-wise count rates Data is divided into 100 sec bins |
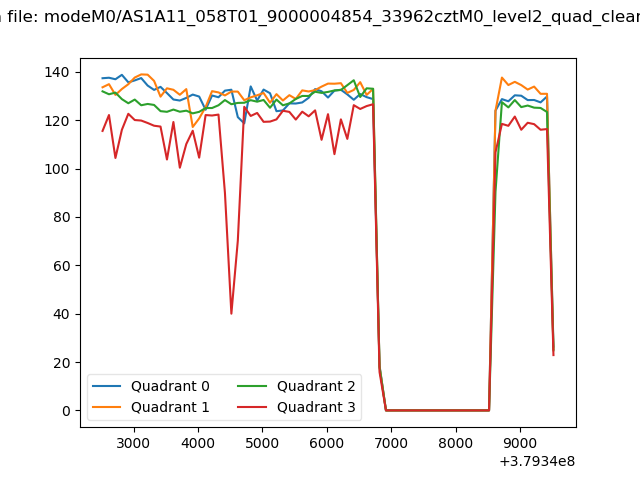 |
|
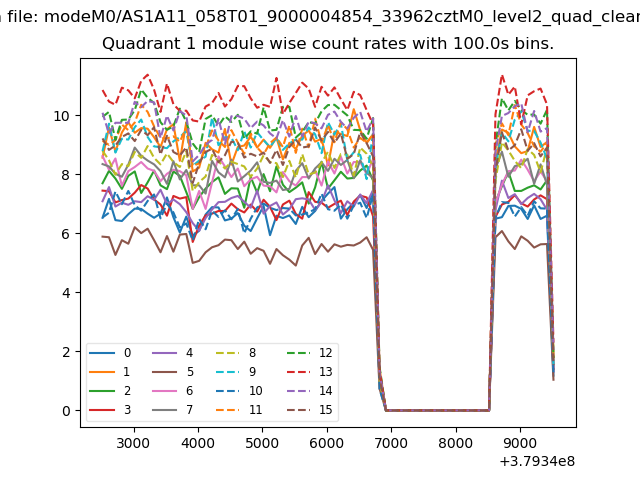
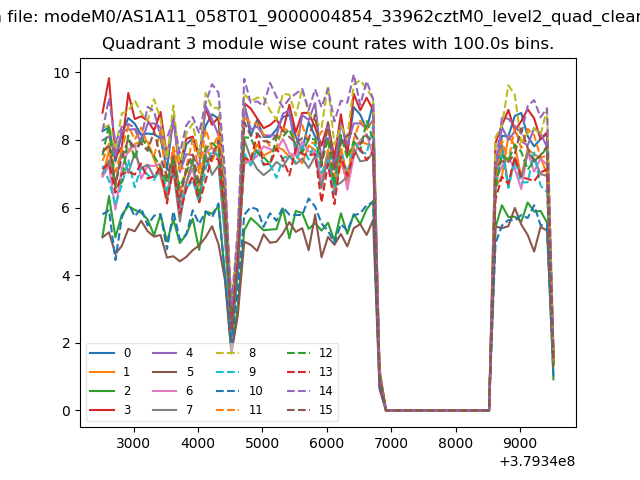
| Module-wise count rates for Quadrant A Data is divided into 100 sec bins |
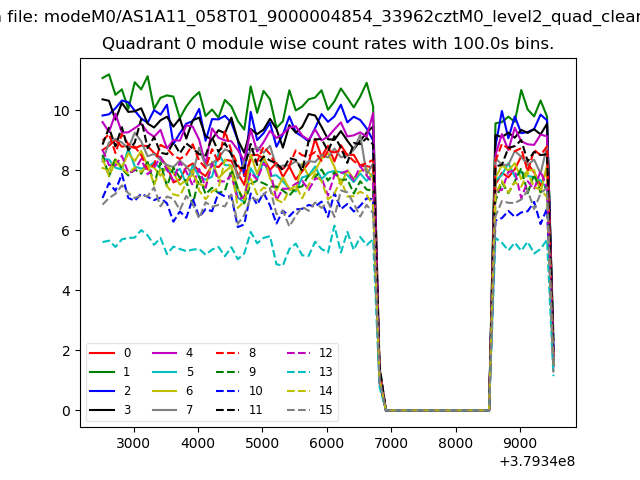 |
 |
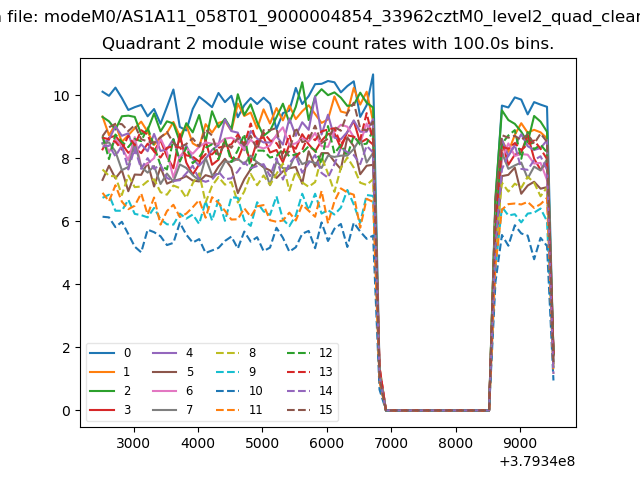
| Module-wise count rates for Quadrant B Data is divided into 100 sec bins |
 |
 |
| Module-wise count rates for Quadrant C Data is divided into 100 sec bins |
 |
 |
| Module-wise count rates for Quadrant D Data is divided into 100 sec bins |
 |
 |
| Parameter | Plot |
|---|---|
| CZT HV Monitor | 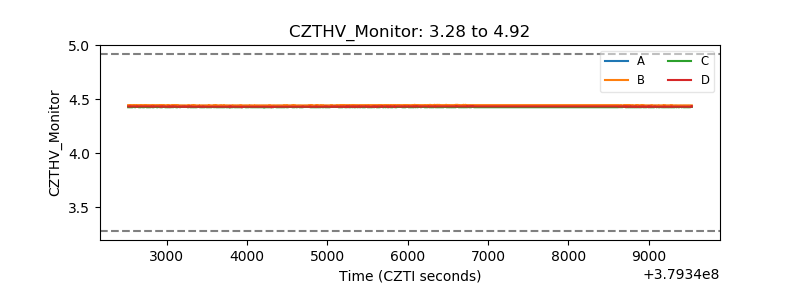 |
| D_VDD | 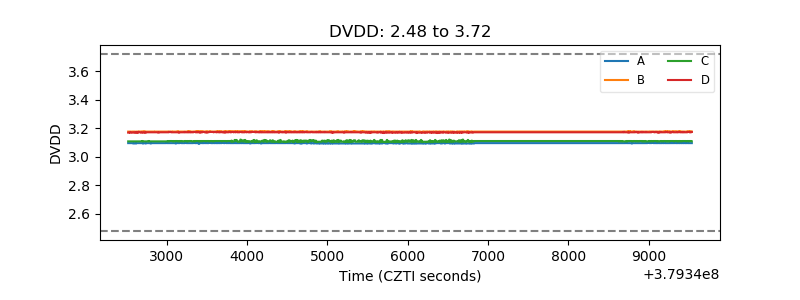 |
| Temperature 1 | 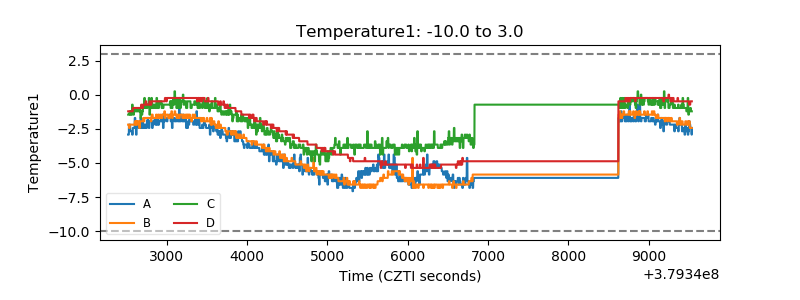 |
| Veto HV Monitor | 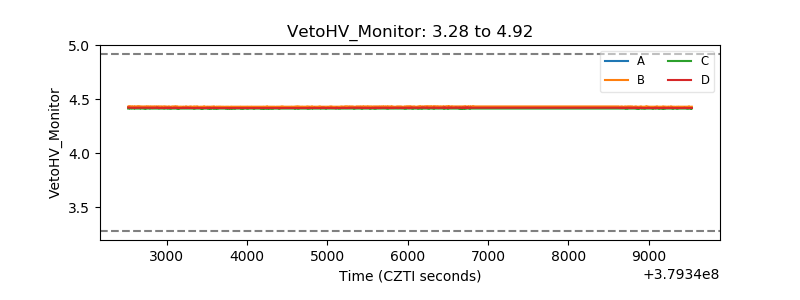 |
| Veto LLD | 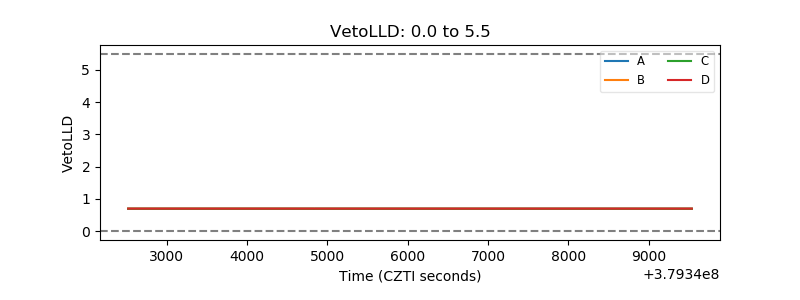 |
| Alpha Counter | 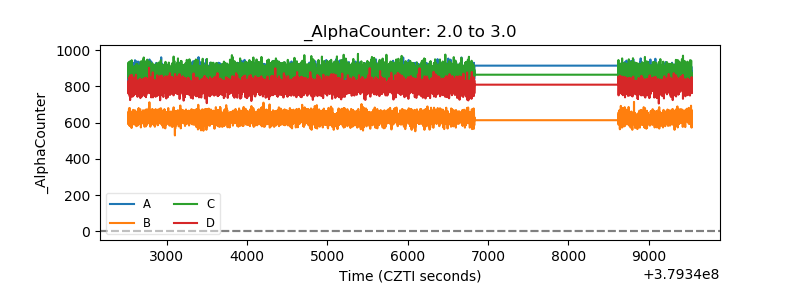 |
| _CPM_Rate | 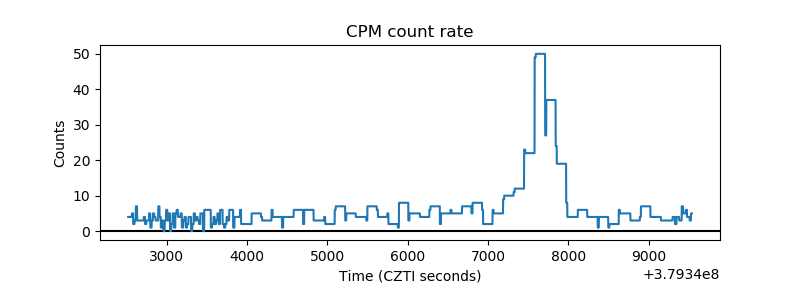 |
| CZT Counter | 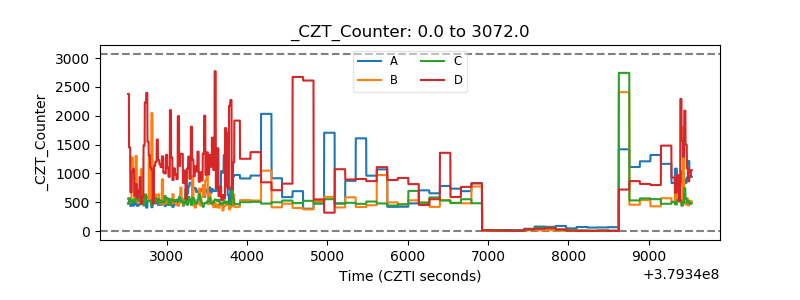 |
| +2.5 Volts monitor |  |
| +5 Volts monitor |  |
| _ROLL_ROT | 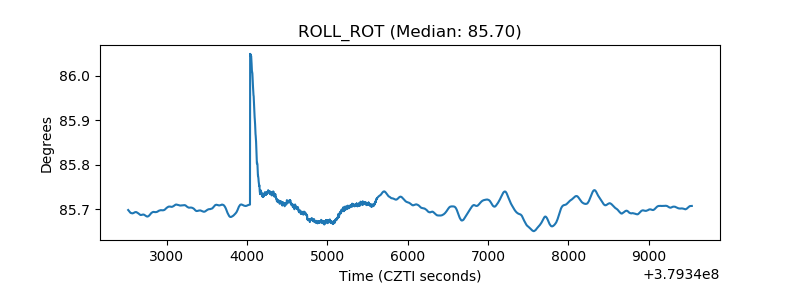 |
| _Roll_DEC | 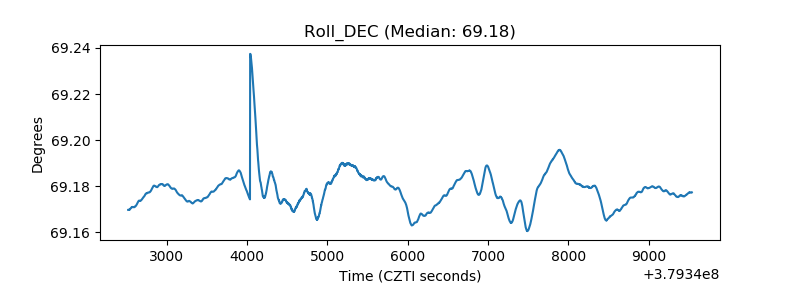 |
| _Roll_RA | 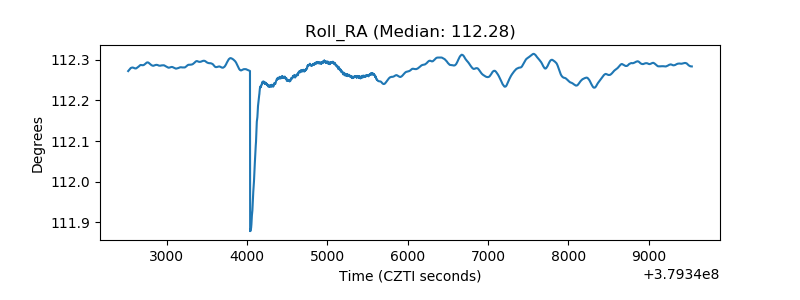 |
| Veto Counter | 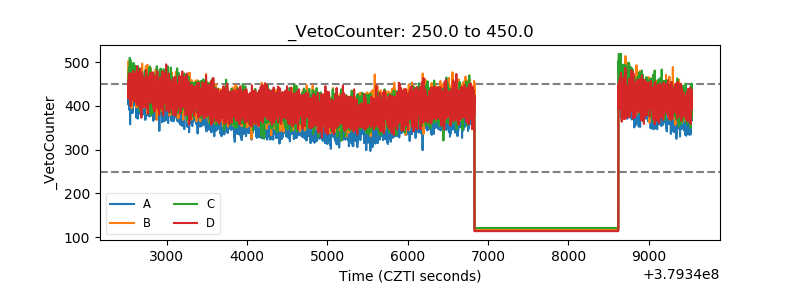 |