| Param | Original file | Final file |
|---|---|---|
| Filename | modeM0/AS1A11_058T01_9000004854_33963cztM0_level2.evt | modeM0/AS1A11_058T01_9000004854_33963cztM0_level2_quad_clean.evt |
| Size (bytes) | 196,925,760 | 38,344,320 |
| Size | 187.8 MB | 36.6 MB |
| Events in quadrant A | 1,831,681 | 260,282 |
| Events in quadrant B | 1,277,810 | 261,771 |
| Events in quadrant C | 1,114,595 | 249,965 |
| Events in quadrant D | 1,599,615 | 240,815 |
| Mode SS | |||
|---|---|---|---|
| Quadrant | BADHDUFLAG | Total packets | Discarded packets |
| A | 0 | 40 | 0 |
| B | 0 | 40 | 0 |
| C | 0 | 40 | 0 |
| D | 0 | 40 | 0 |
| Mode M0 | |||
|---|---|---|---|
| Quadrant | BADHDUFLAG | Total packets | Discarded packets |
| A | 0 | 6884 | 0 |
| B | 0 | 5070 | 0 |
| C | 0 | 4496 | 0 |
| D | 0 | 6132 | 0 |
| Quadrant | Total seconds | Saturated seconds | Saturation percentage |
|---|---|---|---|
| A | 2040 | 26 | 1.274510% |
| B | 2040 | 66 | 3.235294% |
| C | 2040 | 45 | 2.205882% |
| D | 2040 | 86 | 4.215686% |
Noise dominated data is calculated using 1-second bins in cleaned event files. If a bin has >2000 counts, and if more than 50% of those come from <1% of pixels, then it is considered to be noise-dominated and hence unusable.
| Quadrant | # 1 sec bins | Bins with >0 counts | Bins with >2000 counts | High rate bins dominated by noise | Noise dominated (total time) | Noise dominated (detector-on time) | Marked lightcurve |
|---|---|---|---|---|---|---|---|
| A | 2040 | 2040 | 7 | 7 | 0.34% | 0.34% | 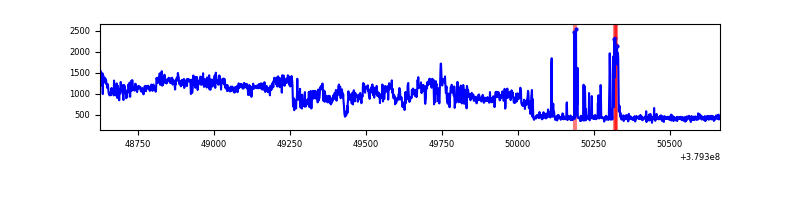 |
| B | 2040 | 2040 | 39 | 39 | 1.91% | 1.91% | 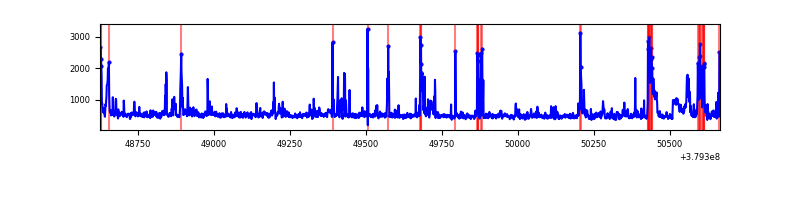 |
| C | 2040 | 2040 | 30 | 30 | 1.47% | 1.47% | 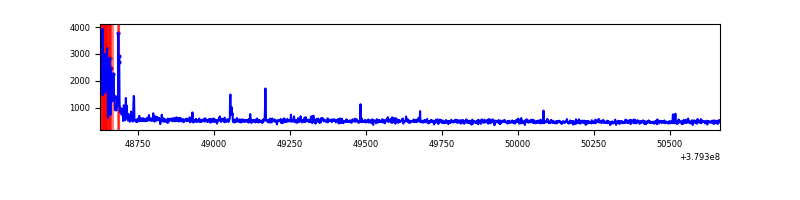 |
| D | 2040 | 2040 | 59 | 59 | 2.89% | 2.89% | 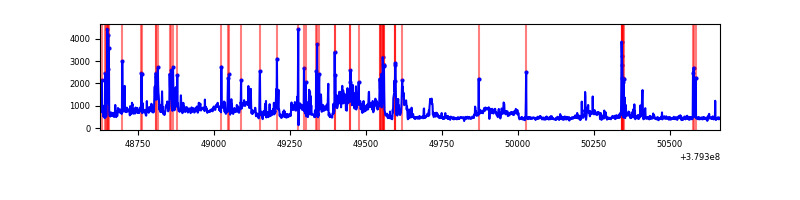 |
Top three noisy pixels from each quadrant. If the there are fewer than three noisy pixels in the level2.evt file, extra rows are filled as -1
| Pixel properties | Quadrant properties | ||||||
|---|---|---|---|---|---|---|---|
| Quadrant | DetID | PixID | Counts | Sigma | Mean | Median | Sigma |
| A | 15 | 169 | 911848 | 18952.01 | 234 | 229 | 48.1 |
| A | 10 | 83 | 7970 | 160.93 | 234 | 229 | 48.1 |
| A | 13 | 6 | 4930 | 97.73 | 234 | 229 | 48.1 |
| B | 0 | 229 | 156238 | 3471.18 | 231 | 226 | 44.9 |
| B | 5 | 172 | 100061 | 2221.27 | 231 | 226 | 44.9 |
| B | 3 | 112 | 46047 | 1019.49 | 231 | 226 | 44.9 |
| C | 0 | 10 | 125475 | 2345.97 | 226 | 227 | 53.4 |
| C | 15 | 214 | 90997 | 1700.17 | 226 | 227 | 53.4 |
| C | 12 | 250 | 7345 | 133.32 | 226 | 227 | 53.4 |
| D | 8 | 195 | 290789 | 4603.15 | 226 | 221 | 63.1 |
| D | 13 | 249 | 181635 | 2873.94 | 226 | 221 | 63.1 |
| D | 12 | 233 | 66649 | 1052.35 | 226 | 221 | 63.1 |
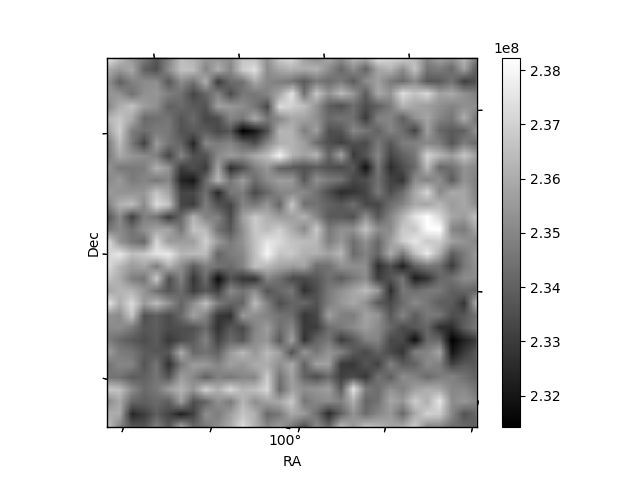
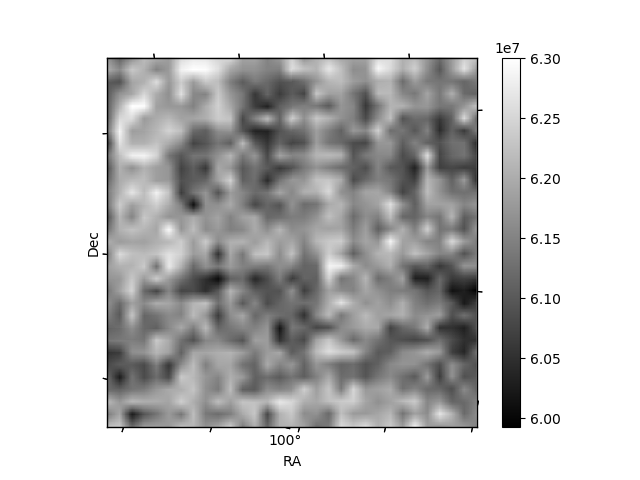
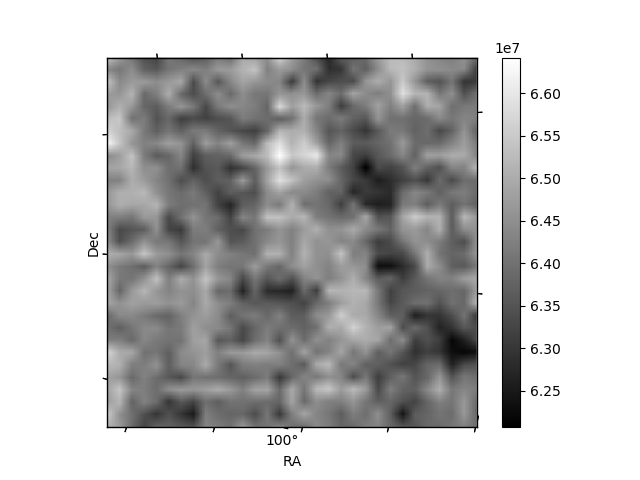
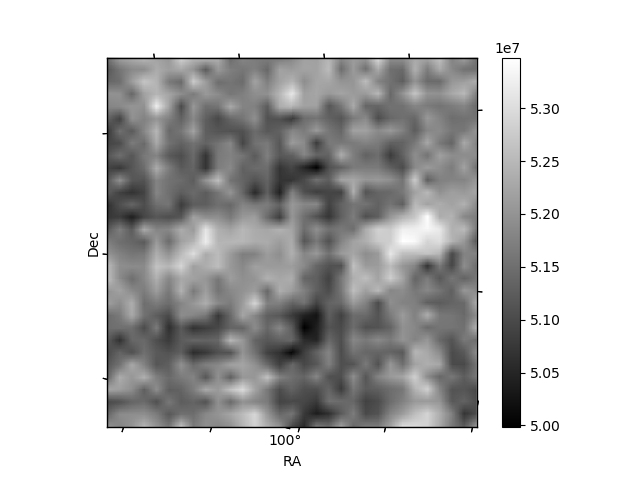
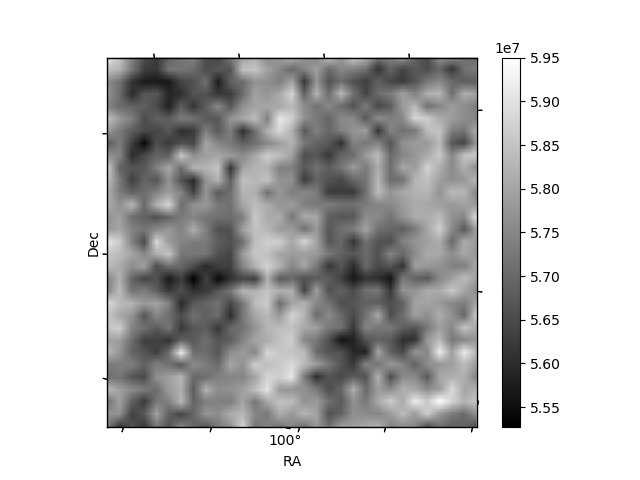
Histogram calculated using DETX and DETY for each event in the final _common_clean file
| Quadrant A | 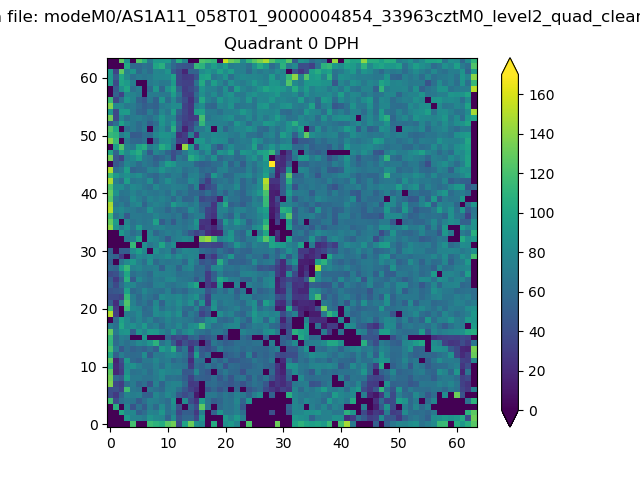 |
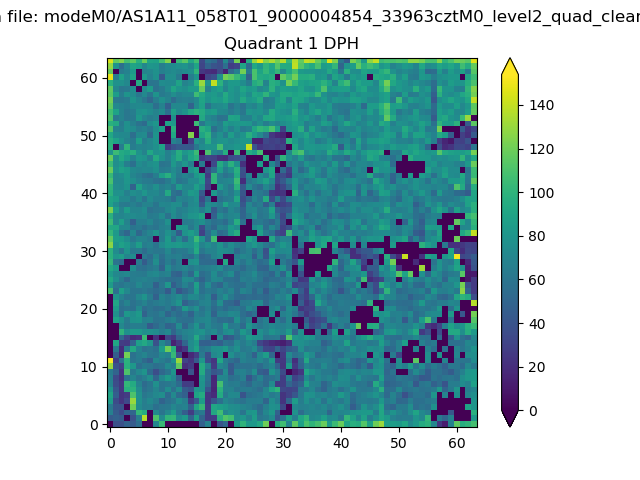 |
Quadrant B |
|---|---|---|---|
| Quadrant D | 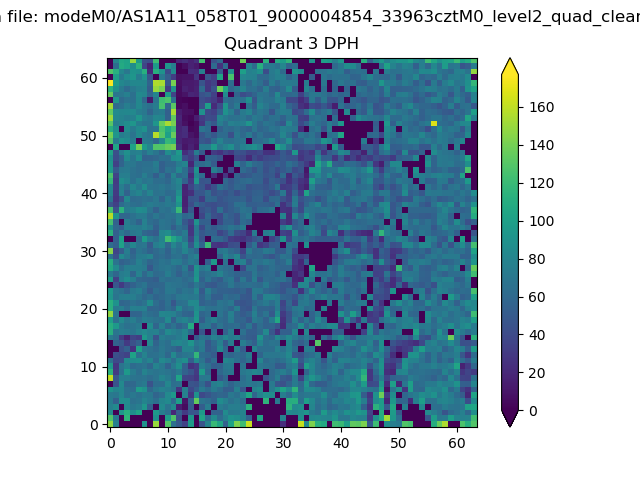 |
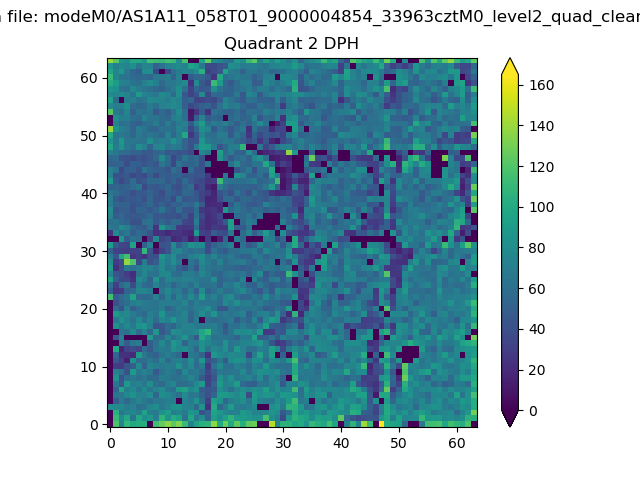 |
Quadrant C |
| Plot type | Count rate plots | Images |
|---|---|---|
| Comparison with Poisson distribution Blue bars denote a histogram of data divided into 1 sec bins. Red curve is a Poisson curve with rate = median count rate of data. |
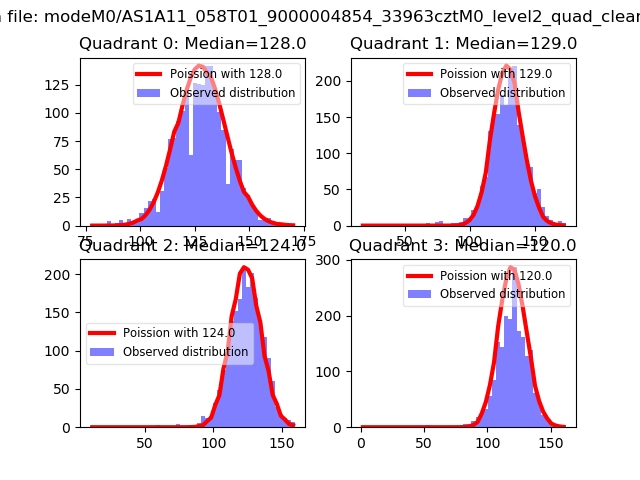 |
 |
| Quadrant-wise count rates Data is divided into 100 sec bins |
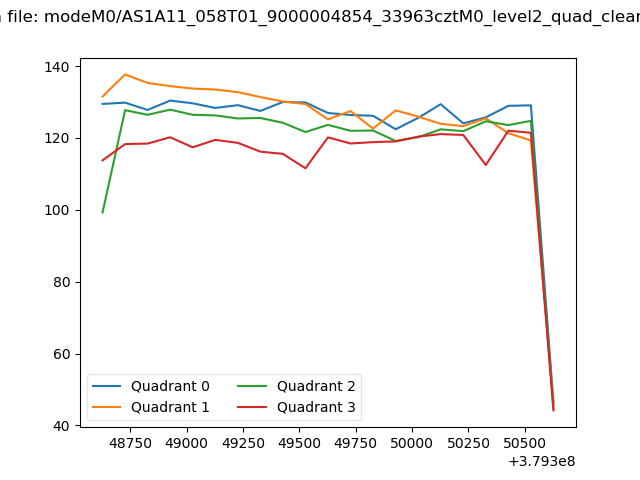 |
|
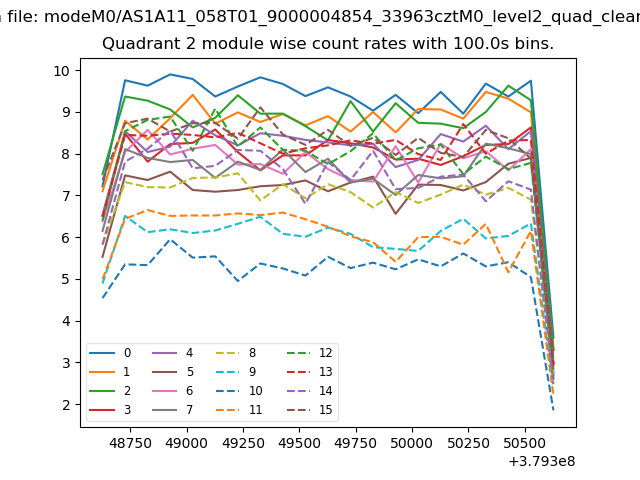
| Module-wise count rates for Quadrant A Data is divided into 100 sec bins |
 |
 |
| Module-wise count rates for Quadrant B Data is divided into 100 sec bins |
 |
 |
| Module-wise count rates for Quadrant C Data is divided into 100 sec bins |
 |
 |
| Module-wise count rates for Quadrant D Data is divided into 100 sec bins |
 |
 |
| Parameter | Plot |
|---|---|
| CZT HV Monitor |  |
| D_VDD |  |
| Temperature 1 | 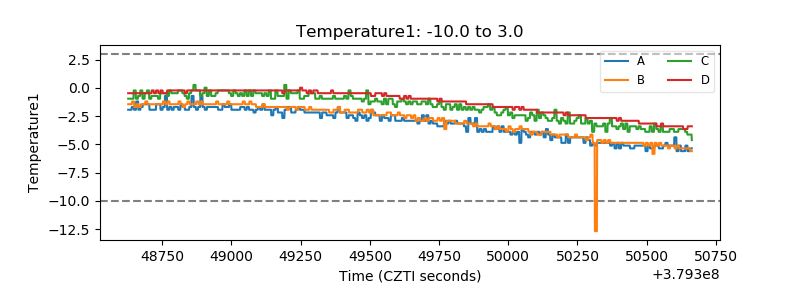 |
| Veto HV Monitor | 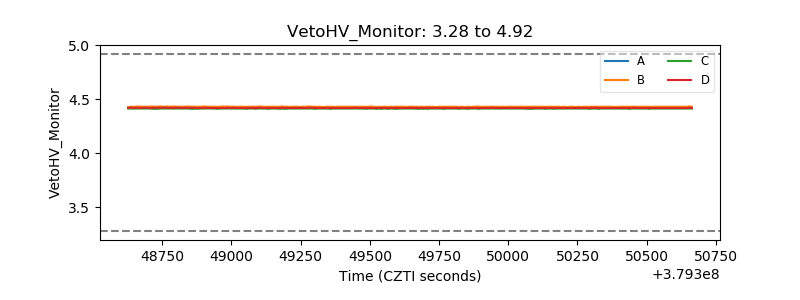 |
| Veto LLD |  |
| Alpha Counter | 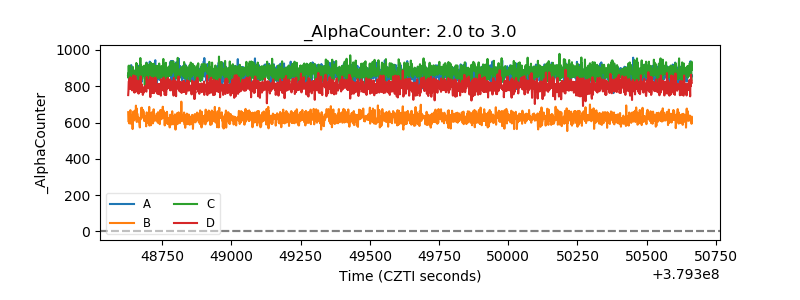 |
| _CPM_Rate | 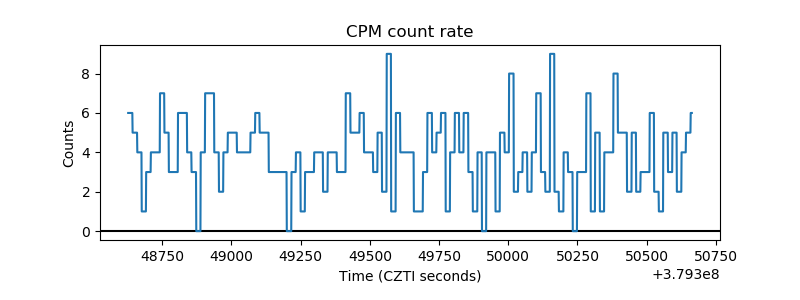 |
| CZT Counter | 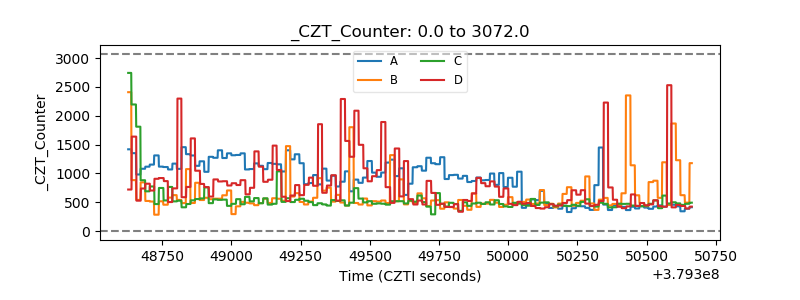 |
| +2.5 Volts monitor |  |
| +5 Volts monitor | 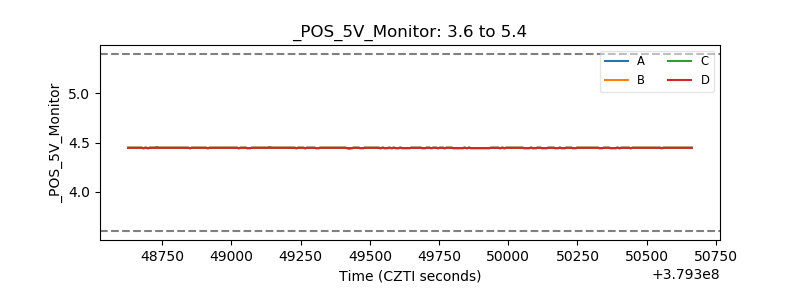 |
| _ROLL_ROT |  |
| _Roll_DEC | 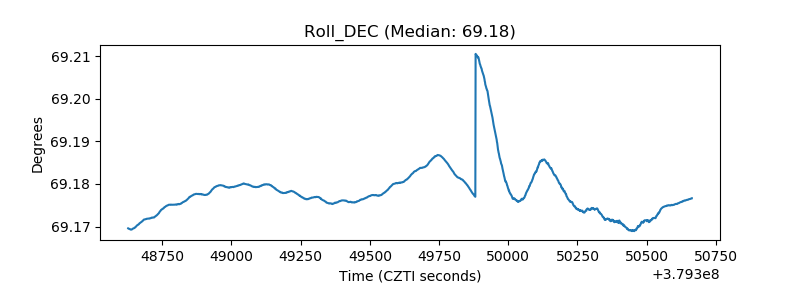 |
| _Roll_RA | 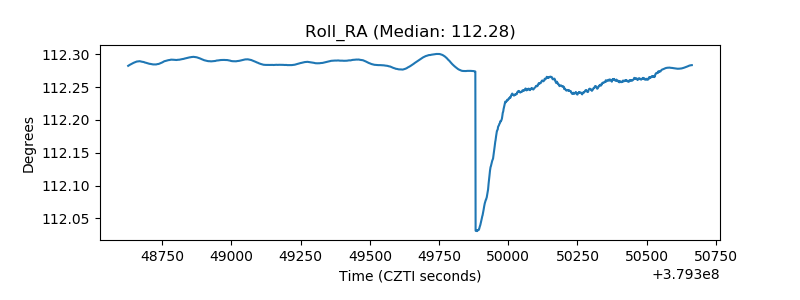 |
| Veto Counter |  |