| Param | Original file | Final file |
|---|---|---|
| Filename | modeM0/AS1A11_034T07_9000004860_33974cztM0_level2.evt | modeM0/AS1A11_034T07_9000004860_33974cztM0_level2_quad_clean.evt |
| Size (bytes) | 125,732,160 | 4,772,160 |
| Size | 119.9 MB | 4.6 MB |
| Events in quadrant A | 1,882,169 | 5,407 |
| Events in quadrant B | 503,225 | 25,766 |
| Events in quadrant C | 639,884 | 25,112 |
| Events in quadrant D | 724,838 | 23,797 |
| Mode SS | |||
|---|---|---|---|
| Quadrant | BADHDUFLAG | Total packets | Discarded packets |
| A | 0 | 16 | 0 |
| B | 0 | 16 | 0 |
| C | 0 | 16 | 0 |
| D | 0 | 16 | 0 |
| Mode M0 | |||
|---|---|---|---|
| Quadrant | BADHDUFLAG | Total packets | Discarded packets |
| A | 0 | 6134 | 2 |
| B | 0 | 1936 | 1 |
| C | 0 | 2510 | 1 |
| D | 0 | 2738 | 1 |
| Mode M9 | |||
|---|---|---|---|
| Quadrant | BADHDUFLAG | Total packets | Discarded packets |
| A | 0 | 16 | 0 |
| B | 0 | 16 | 0 |
| C | 0 | 16 | 0 |
| D | 0 | 16 | 0 |
| Quadrant | Total seconds | Saturated seconds | Saturation percentage |
|---|---|---|---|
| A | 806 | 806 | 100.000000% |
| B | 806 | 14 | 1.736973% |
| C | 806 | 34 | 4.218362% |
| D | 806 | 85 | 10.545906% |
Noise dominated data is calculated using 1-second bins in cleaned event files. If a bin has >2000 counts, and if more than 50% of those come from <1% of pixels, then it is considered to be noise-dominated and hence unusable.
| Quadrant | # 1 sec bins | Bins with >0 counts | Bins with >2000 counts | High rate bins dominated by noise | Noise dominated (total time) | Noise dominated (detector-on time) | Marked lightcurve |
|---|---|---|---|---|---|---|---|
| A | 806 | 806 | 624 | 624 | 77.42% | 77.42% | 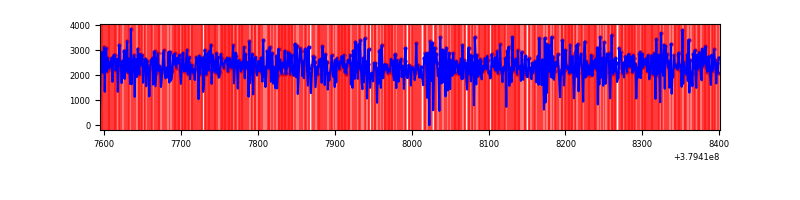 |
| B | 806 | 806 | 5 | 5 | 0.62% | 0.62% | 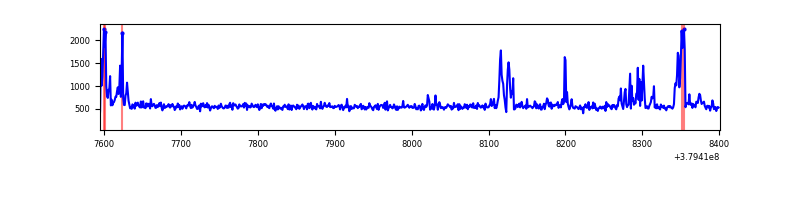 |
| C | 806 | 806 | 24 | 24 | 2.98% | 2.98% |  |
| D | 806 | 806 | 76 | 76 | 9.43% | 9.43% | 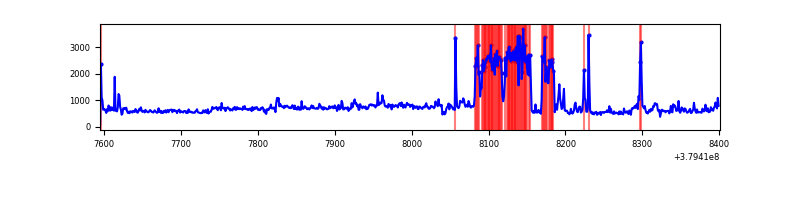 |
Top three noisy pixels from each quadrant. If the there are fewer than three noisy pixels in the level2.evt file, extra rows are filled as -1
| Pixel properties | Quadrant properties | ||||||
|---|---|---|---|---|---|---|---|
| Quadrant | DetID | PixID | Counts | Sigma | Mean | Median | Sigma |
| A | 15 | 169 | 1763901 | 233638.8 | 29 | 28 | 7.5 |
| A | 10 | 83 | 2080 | 271.8 | 29 | 28 | 7.5 |
| A | 13 | 6 | 640 | 81.06 | 29 | 28 | 7.5 |
| B | 5 | 172 | 37704 | 1630.0 | 111 | 109 | 23.1 |
| B | 4 | 232 | 25341 | 1093.98 | 111 | 109 | 23.1 |
| B | 3 | 112 | 3617 | 152.1 | 111 | 109 | 23.1 |
| C | 0 | 10 | 96944 | 3748.85 | 106 | 107 | 25.8 |
| C | 4 | 254 | 64706 | 2500.82 | 106 | 107 | 25.8 |
| C | 15 | 214 | 39804 | 1536.79 | 106 | 107 | 25.8 |
| D | 7 | 238 | 196742 | 7284.59 | 102 | 99 | 27.0 |
| D | 8 | 195 | 86991 | 3218.89 | 102 | 99 | 27.0 |
| D | 12 | 6 | 12900 | 474.21 | 102 | 99 | 27.0 |
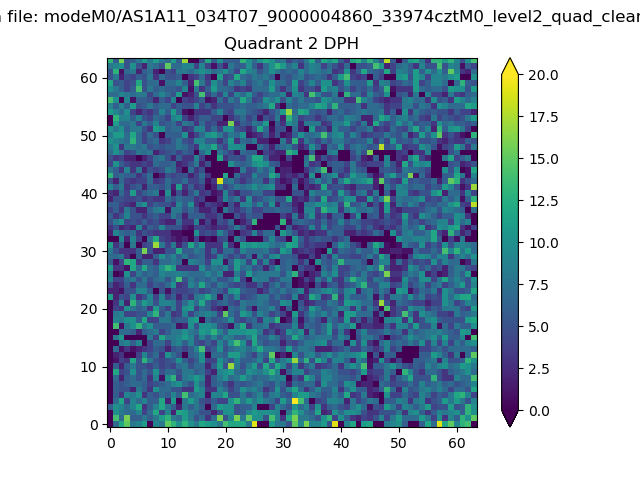
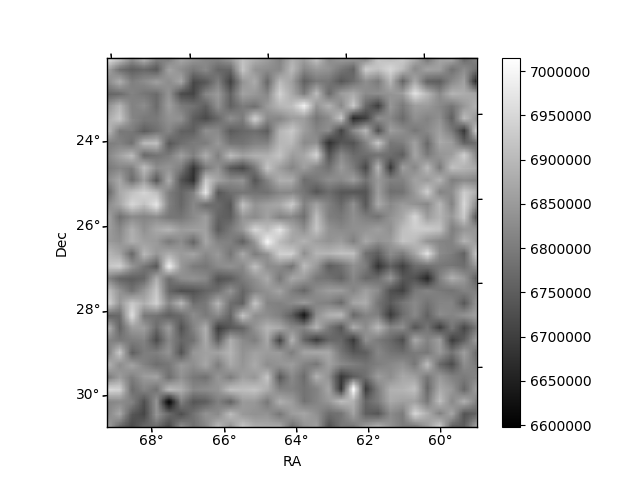
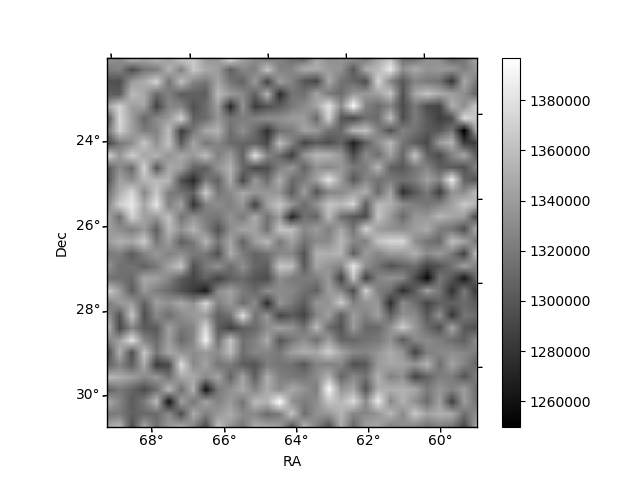
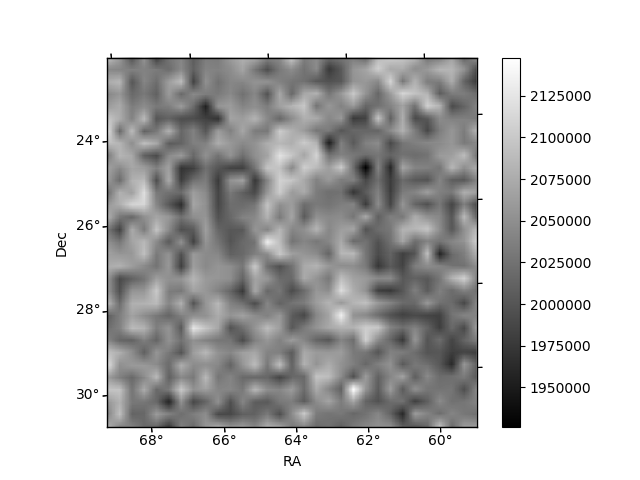
Histogram calculated using DETX and DETY for each event in the final _common_clean file
| Quadrant A | 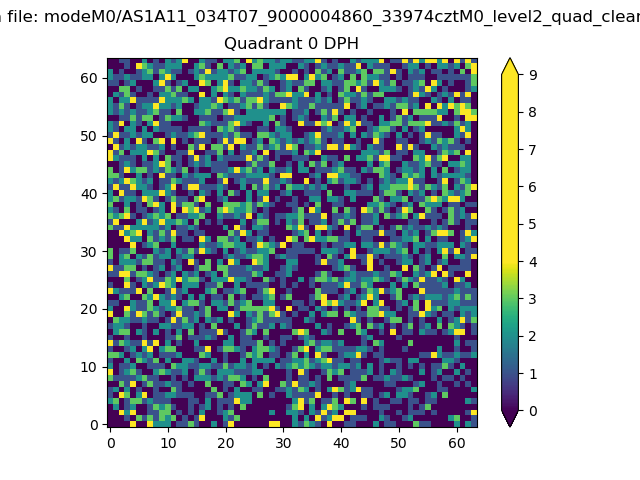 |
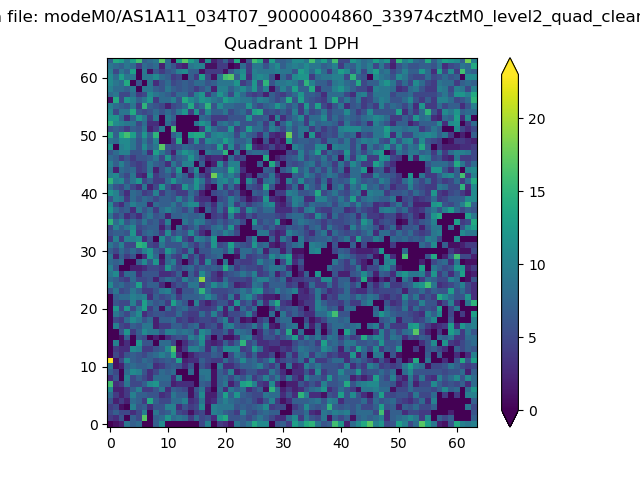 |
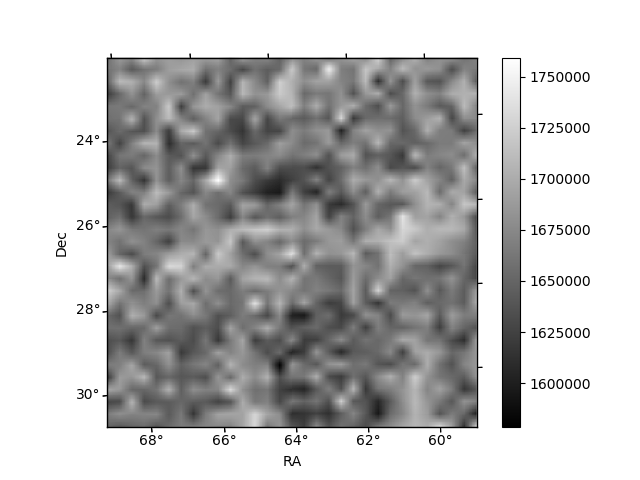
Quadrant B |
|---|---|---|---|
| Quadrant D | 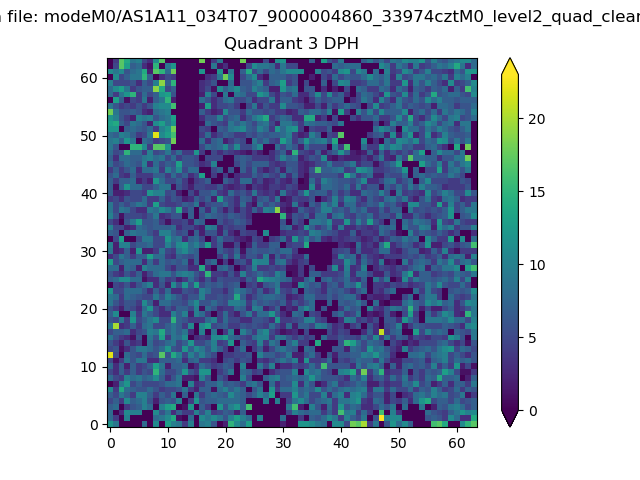 |
 |
Quadrant C |
| Plot type | Count rate plots | Images |
|---|---|---|
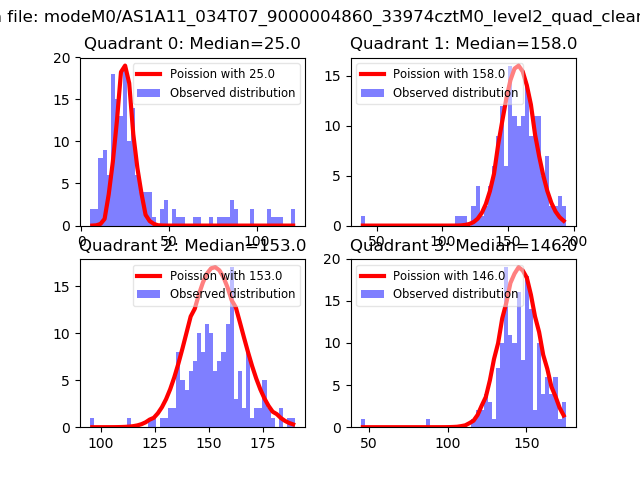
| Comparison with Poisson distribution Blue bars denote a histogram of data divided into 1 sec bins. Red curve is a Poisson curve with rate = median count rate of data. |
 |
 |
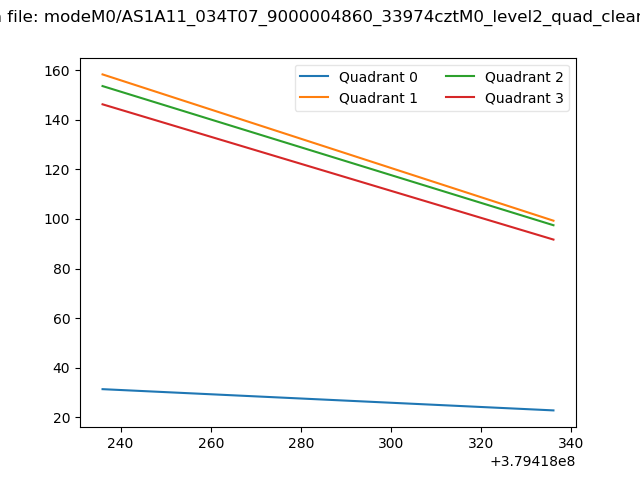
| Quadrant-wise count rates Data is divided into 100 sec bins |
 |
|
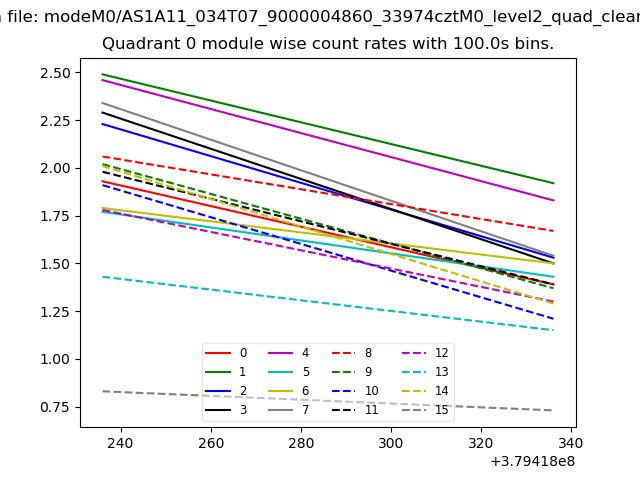
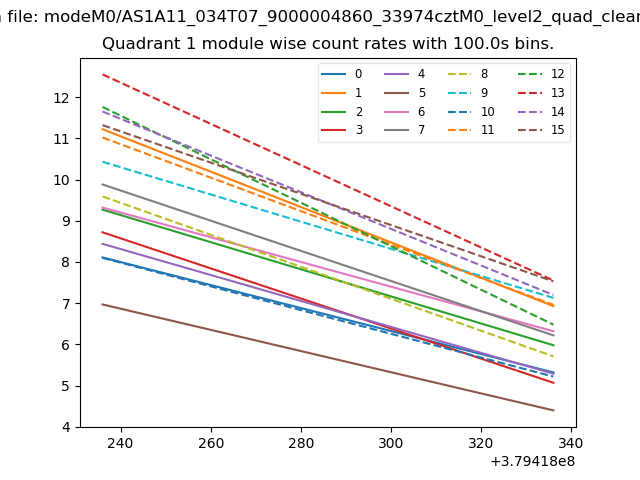
| Module-wise count rates for Quadrant A Data is divided into 100 sec bins |
 |
 |
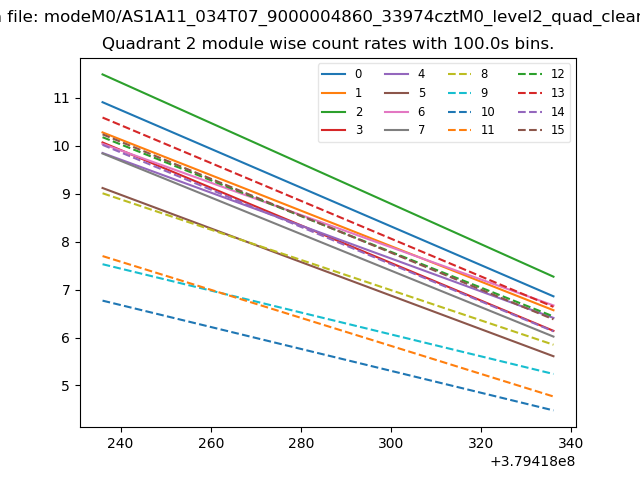
| Module-wise count rates for Quadrant B Data is divided into 100 sec bins |
 |
 |
| Module-wise count rates for Quadrant C Data is divided into 100 sec bins |
 |
 |
| Module-wise count rates for Quadrant D Data is divided into 100 sec bins |
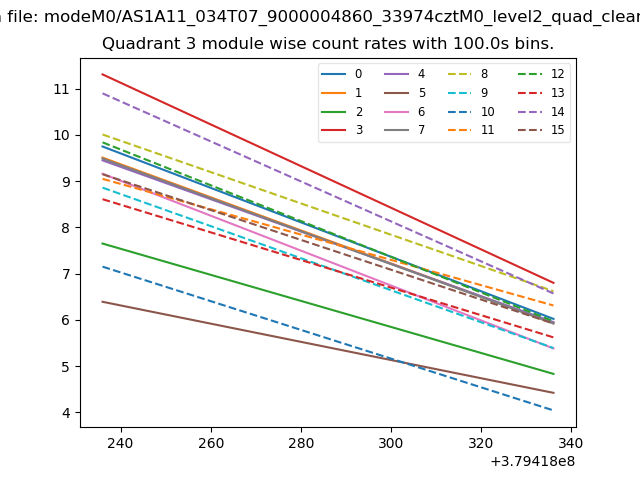 |
 |
| Parameter | Plot |
|---|---|
| CZT HV Monitor | 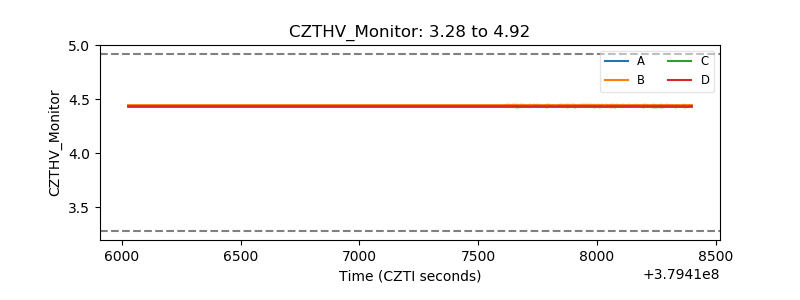 |
| D_VDD | 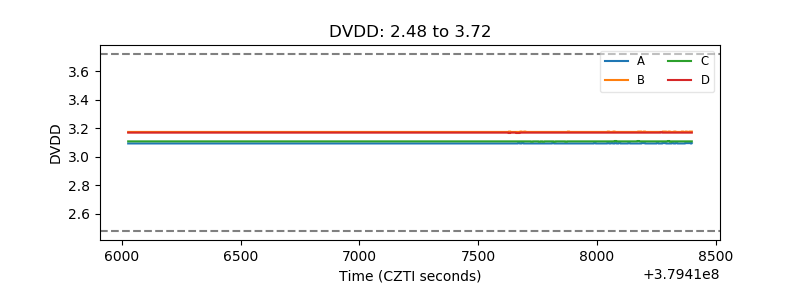 |
| Temperature 1 |  |
| Veto HV Monitor |  |
| Veto LLD | 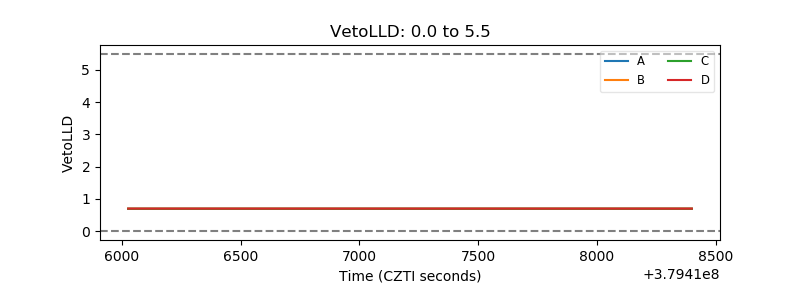 |
| Alpha Counter | 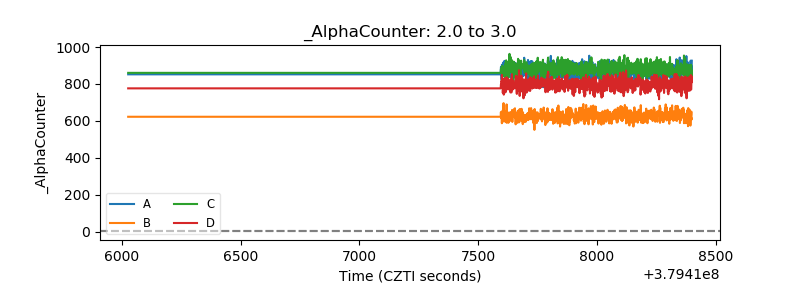 |
| _CPM_Rate | 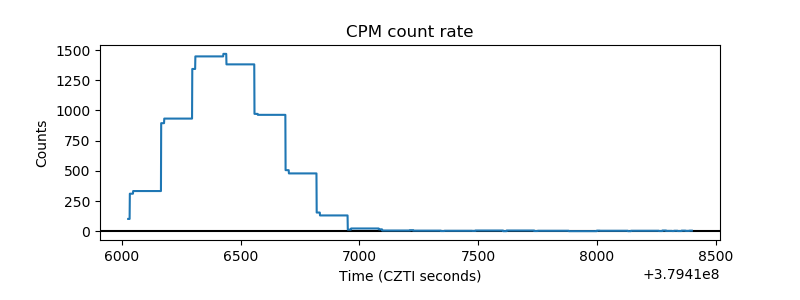 |
| CZT Counter | 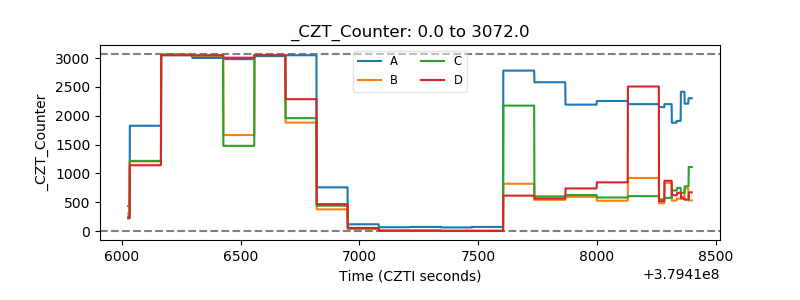 |
| +2.5 Volts monitor |  |
| +5 Volts monitor |  |
| _ROLL_ROT | 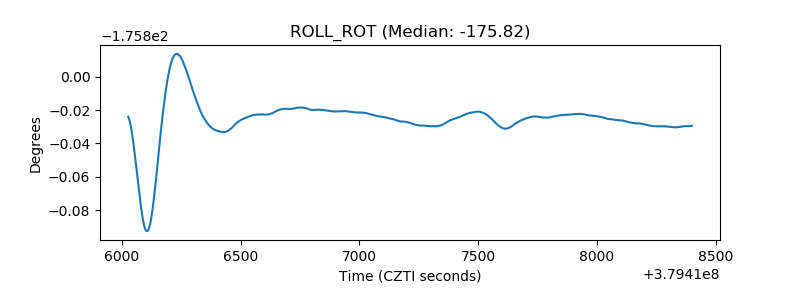 |
| _Roll_DEC | 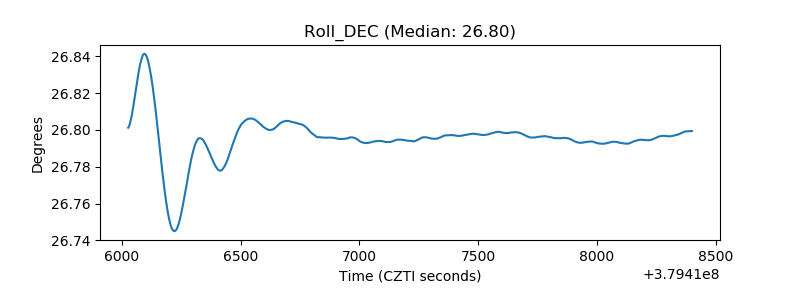 |
| _Roll_RA | 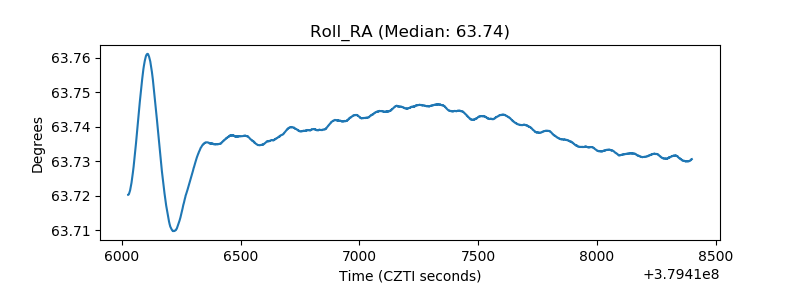 |
| Veto Counter |  |