| Param | Original file | Final file |
|---|---|---|
| Filename | modeM0/AS1A11_034T07_9000004860_33975cztM0_level2.evt | modeM0/AS1A11_034T07_9000004860_33975cztM0_level2_quad_clean.evt |
| Size (bytes) | 687,591,360 | 70,479,360 |
| Size | 655.7 MB | 67.2 MB |
| Events in quadrant A | 9,540,788 | 77,734 |
| Events in quadrant B | 3,073,029 | 590,499 |
| Events in quadrant C | 3,239,915 | 578,873 |
| Events in quadrant D | 4,635,538 | 539,197 |
| Mode SS | |||
|---|---|---|---|
| Quadrant | BADHDUFLAG | Total packets | Discarded packets |
| A | 0 | 102 | 0 |
| B | 0 | 102 | 0 |
| C | 0 | 102 | 0 |
| D | 0 | 102 | 0 |
| Mode M0 | |||
|---|---|---|---|
| Quadrant | BADHDUFLAG | Total packets | Discarded packets |
| A | 0 | 31658 | 3 |
| B | 0 | 12087 | 2 |
| C | 0 | 12598 | 2 |
| D | 0 | 17102 | 2 |
| Mode M9 | |||
|---|---|---|---|
| Quadrant | BADHDUFLAG | Total packets | Discarded packets |
| A | 0 | 32 | 0 |
| B | 0 | 32 | 0 |
| C | 0 | 32 | 0 |
| D | 0 | 33 | 0 |
| Quadrant | Total seconds | Saturated seconds | Saturation percentage |
|---|---|---|---|
| A | 4925 | 4923 | 99.959391% |
| B | 4925 | 94 | 1.908629% |
| C | 4925 | 117 | 2.375635% |
| D | 4925 | 306 | 6.213198% |
Noise dominated data is calculated using 1-second bins in cleaned event files. If a bin has >2000 counts, and if more than 50% of those come from <1% of pixels, then it is considered to be noise-dominated and hence unusable.
| Quadrant | # 1 sec bins | Bins with >0 counts | Bins with >2000 counts | High rate bins dominated by noise | Noise dominated (total time) | Noise dominated (detector-on time) | Marked lightcurve |
|---|---|---|---|---|---|---|---|
| A | 7046 | 4925 | 2720 | 2720 | 38.60% | 55.23% |  |
| B | 7047 | 4926 | 61 | 61 | 0.87% | 1.24% | 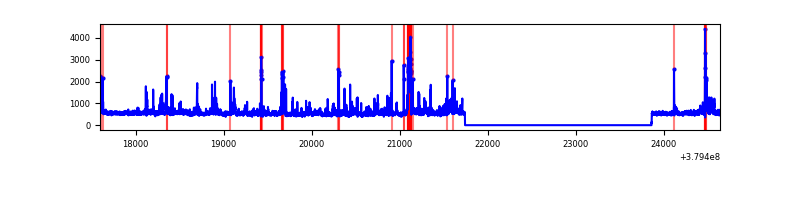 |
| C | 7047 | 4926 | 95 | 95 | 1.35% | 1.93% | 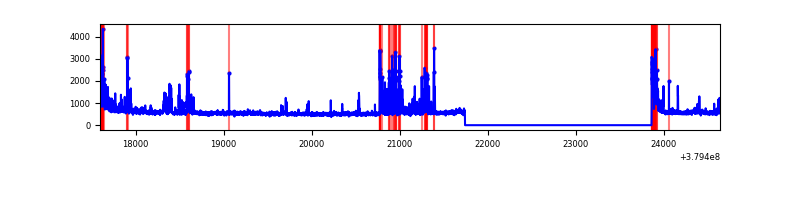 |
| D | 7047 | 4926 | 313 | 313 | 4.44% | 6.35% | 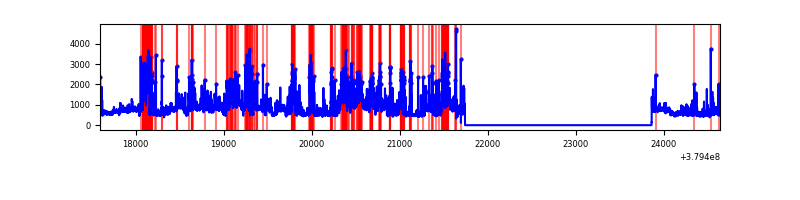 |
Top three noisy pixels from each quadrant. If the there are fewer than three noisy pixels in the level2.evt file, extra rows are filled as -1
| Pixel properties | Quadrant properties | ||||||
|---|---|---|---|---|---|---|---|
| Quadrant | DetID | PixID | Counts | Sigma | Mean | Median | Sigma |
| A | 15 | 169 | 9079028 | 360458.47 | 117 | 115 | 25.2 |
| A | 13 | 6 | 3756 | 144.56 | 117 | 115 | 25.2 |
| A | 10 | 83 | 2757 | 104.89 | 117 | 115 | 25.2 |
| B | 5 | 172 | 355920 | 3009.13 | 622 | 609 | 118.1 |
| B | 0 | 190 | 90314 | 759.71 | 622 | 609 | 118.1 |
| B | 3 | 112 | 63515 | 532.75 | 622 | 609 | 118.1 |
| C | 4 | 254 | 333932 | 2427.9 | 602 | 608 | 137.3 |
| C | 0 | 10 | 241938 | 1757.82 | 602 | 608 | 137.3 |
| C | 15 | 214 | 219983 | 1597.9 | 602 | 608 | 137.3 |
| D | 8 | 195 | 740800 | 4996.54 | 600 | 584 | 148.1 |
| D | 7 | 223 | 427291 | 2880.32 | 600 | 584 | 148.1 |
| D | 7 | 238 | 360211 | 2427.52 | 600 | 584 | 148.1 |
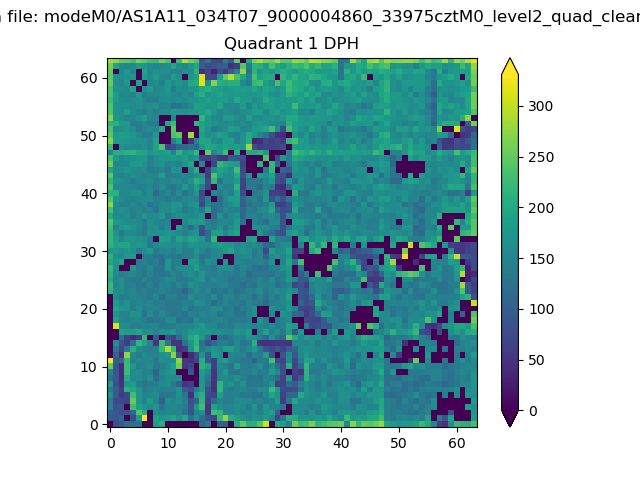
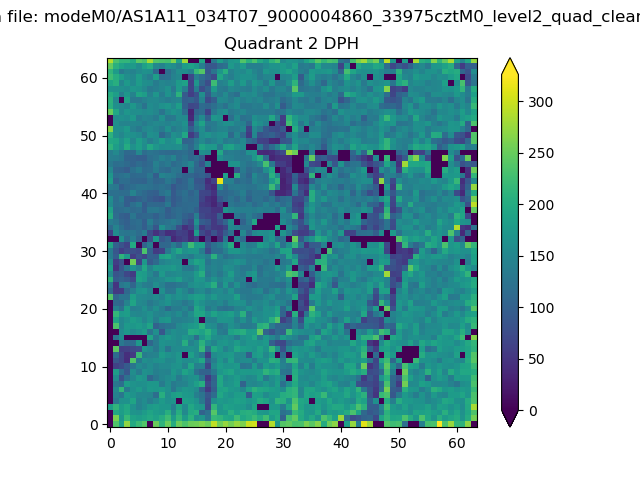
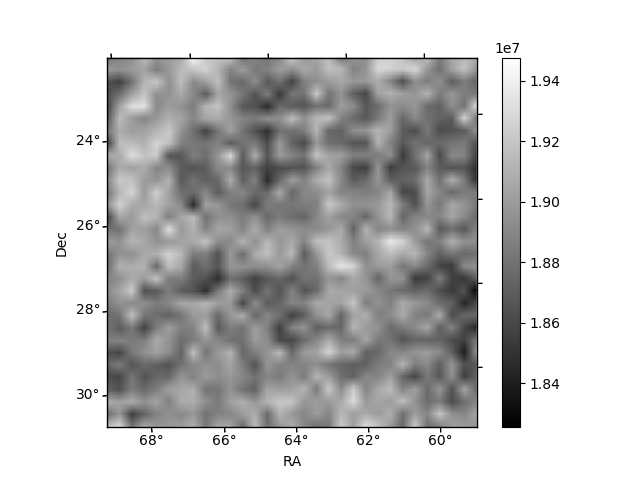
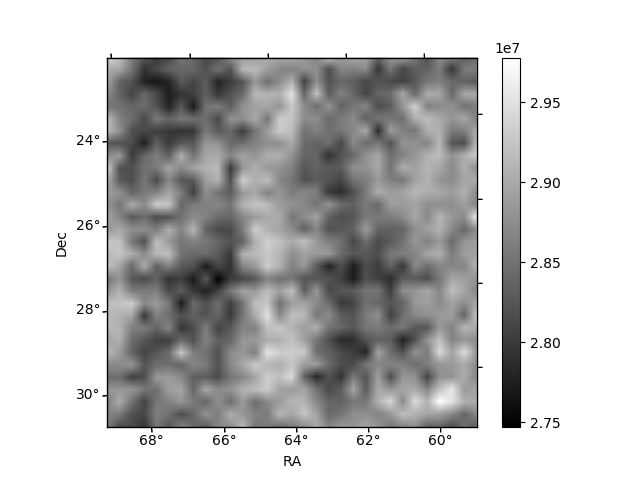
Histogram calculated using DETX and DETY for each event in the final _common_clean file
| Quadrant A |  |
 |
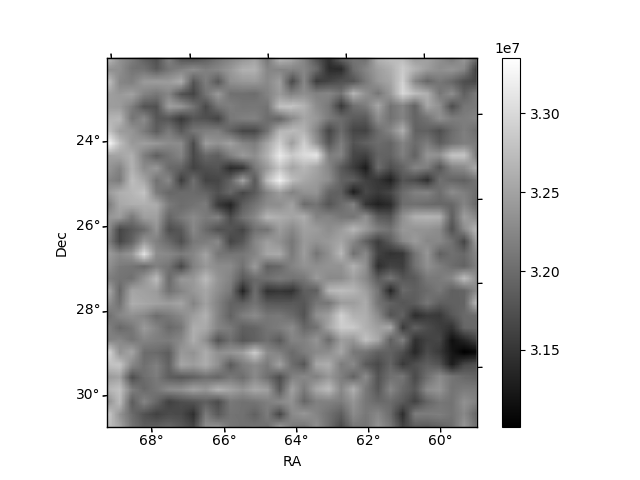
Quadrant B |
|---|---|---|---|
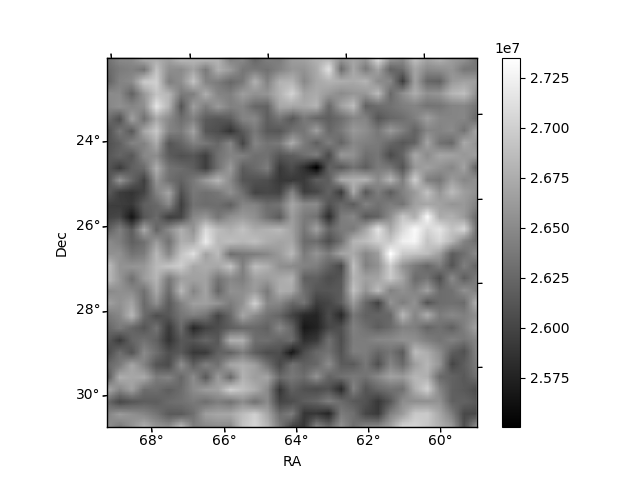
| Quadrant D |  |
 |
Quadrant C |
| Plot type | Count rate plots | Images |
|---|---|---|
| Comparison with Poisson distribution Blue bars denote a histogram of data divided into 1 sec bins. Red curve is a Poisson curve with rate = median count rate of data. |
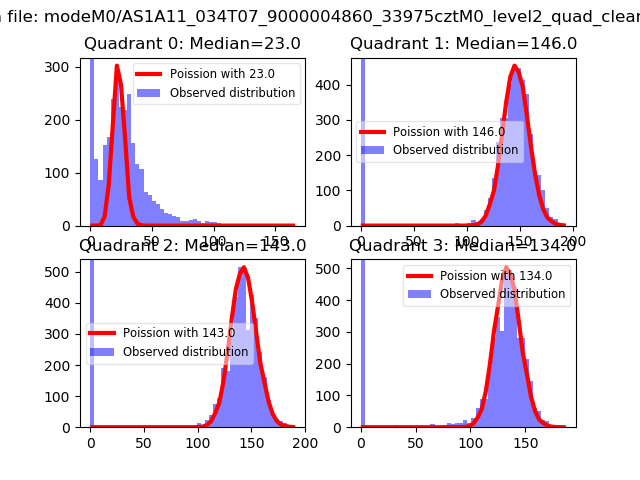 |
 |
| Quadrant-wise count rates Data is divided into 100 sec bins |
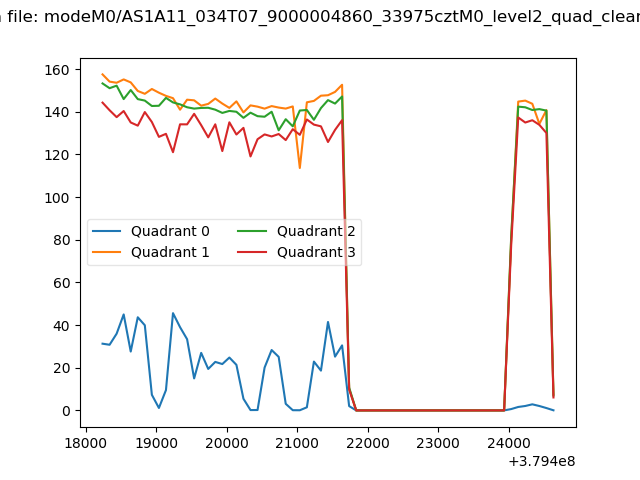 |
|
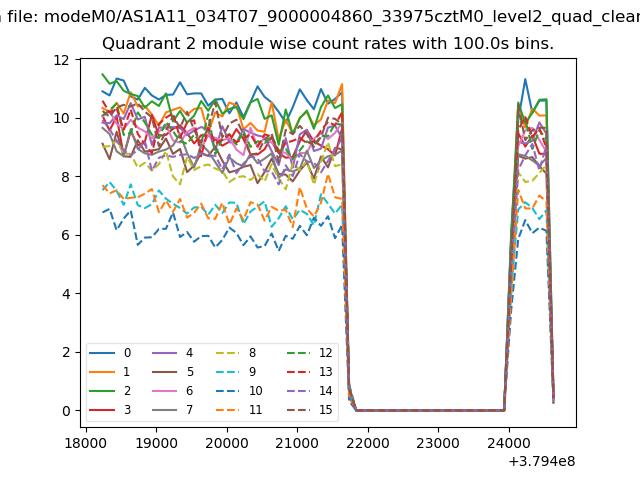
| Module-wise count rates for Quadrant A Data is divided into 100 sec bins |
 |
 |
| Module-wise count rates for Quadrant B Data is divided into 100 sec bins |
 |
 |
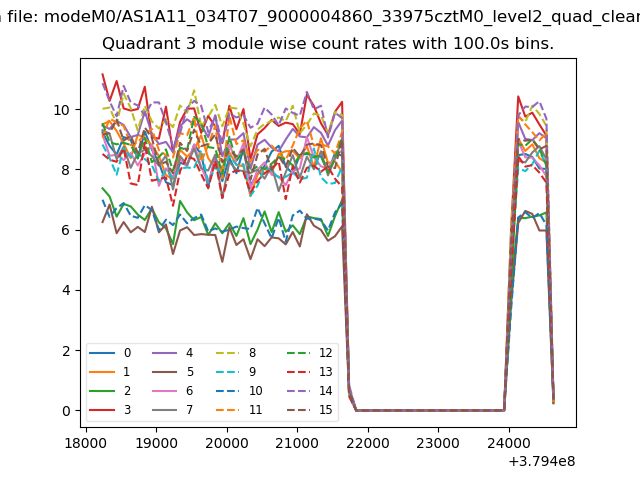
| Module-wise count rates for Quadrant C Data is divided into 100 sec bins |
 |
 |
| Module-wise count rates for Quadrant D Data is divided into 100 sec bins |
 |
 |
| Parameter | Plot |
|---|---|
| CZT HV Monitor |  |
| D_VDD | 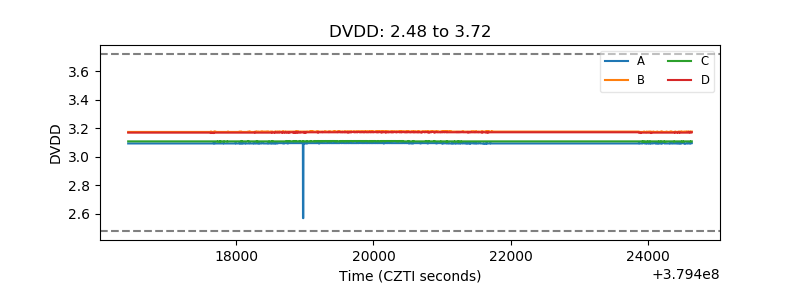 |
| Temperature 1 | 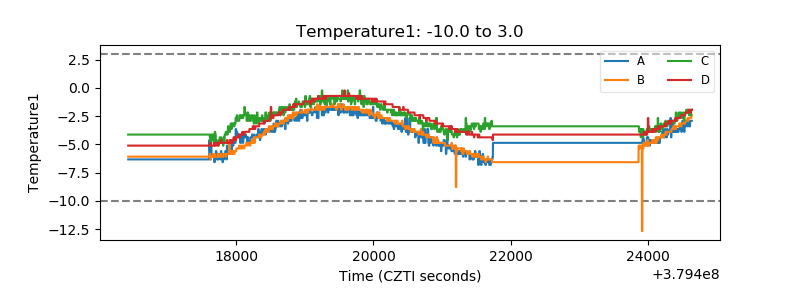 |
| Veto HV Monitor | 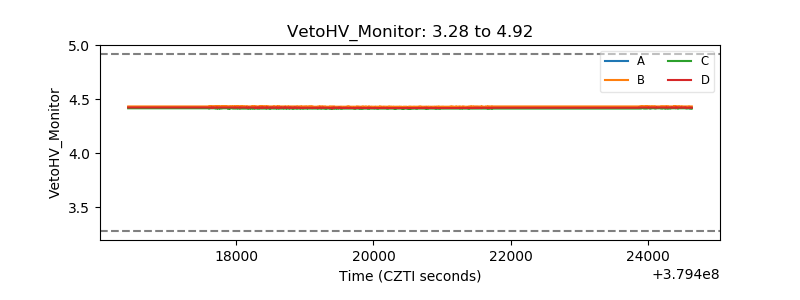 |
| Veto LLD | 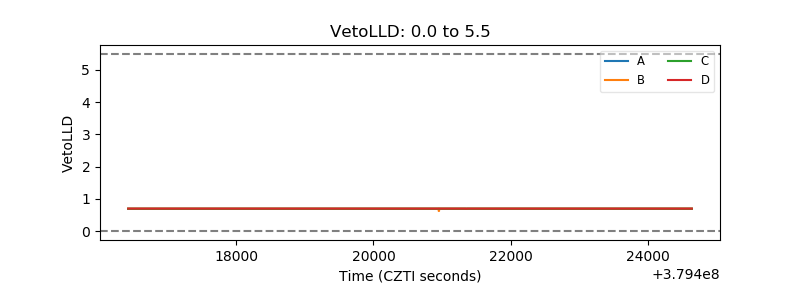 |
| Alpha Counter | 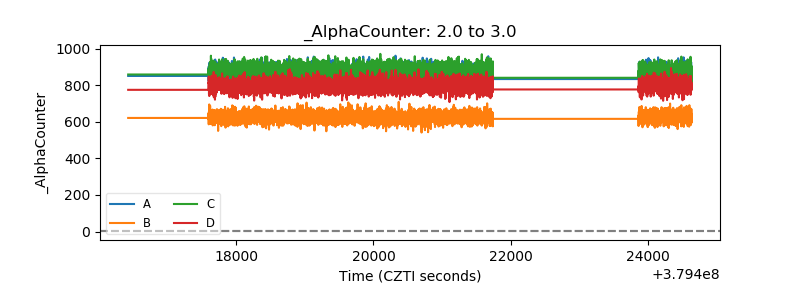 |
| _CPM_Rate | 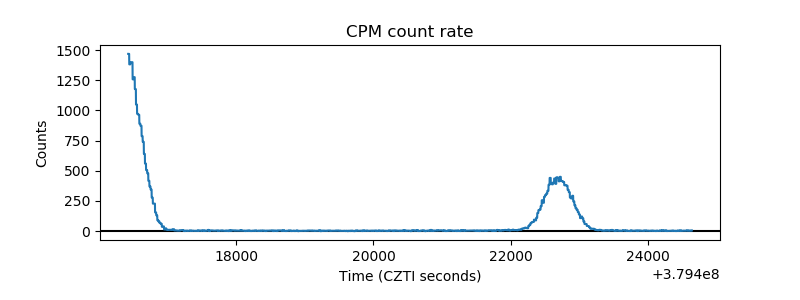 |
| CZT Counter | 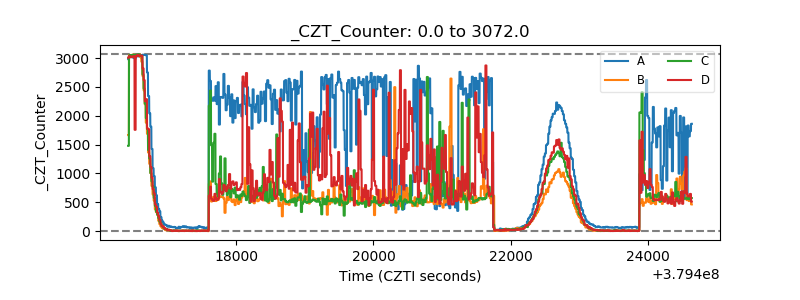 |
| +2.5 Volts monitor |  |
| +5 Volts monitor | 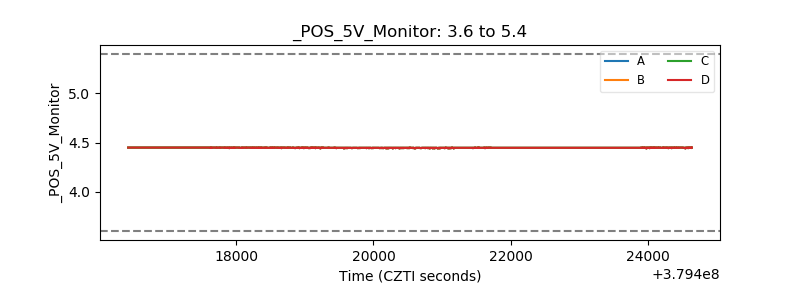 |
| _ROLL_ROT | 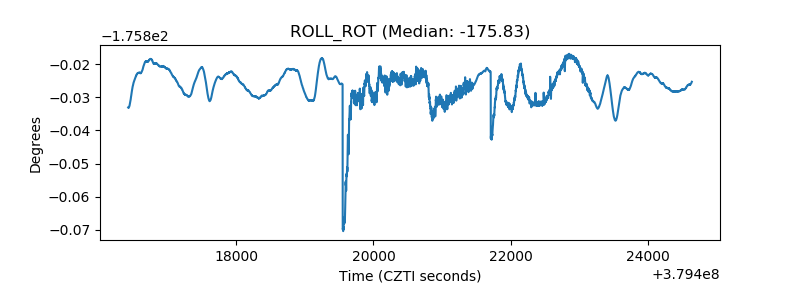 |
| _Roll_DEC | 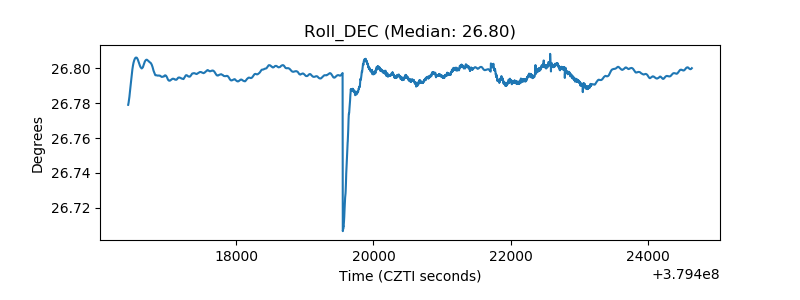 |
| _Roll_RA | 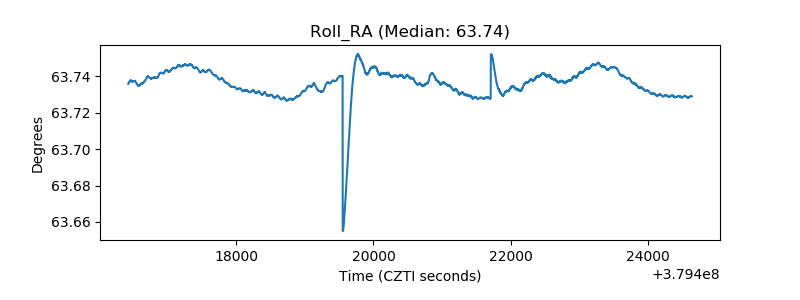 |
| Veto Counter | 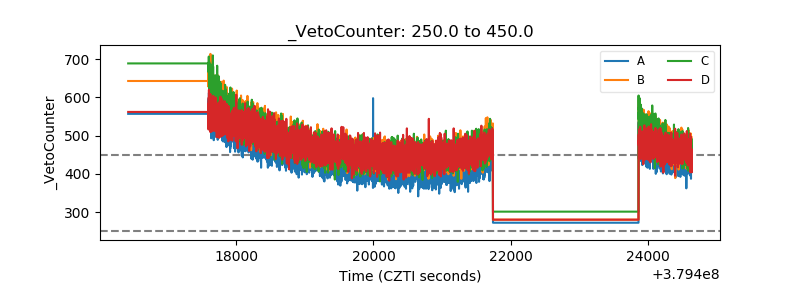 |