| Param | Original file | Final file |
|---|---|---|
| Filename | modeM0/AS1A11_034T07_9000004860_33977cztM0_level2.evt | modeM0/AS1A11_034T07_9000004860_33977cztM0_level2_quad_clean.evt |
| Size (bytes) | 211,832,640 | 27,120,960 |
| Size | 202.0 MB | 25.9 MB |
| Events in quadrant A | 1,701,079 | 1,444 |
| Events in quadrant B | 1,340,085 | 235,599 |
| Events in quadrant C | 1,591,836 | 226,613 |
| Events in quadrant D | 1,654,388 | 221,926 |
| Mode SS | |||
|---|---|---|---|
| Quadrant | BADHDUFLAG | Total packets | Discarded packets |
| A | 0 | 36 | 0 |
| B | 0 | 36 | 0 |
| C | 0 | 36 | 0 |
| D | 0 | 36 | 0 |
| Mode M0 | |||
|---|---|---|---|
| Quadrant | BADHDUFLAG | Total packets | Discarded packets |
| A | 0 | 6315 | 1 |
| B | 0 | 5224 | 1 |
| C | 0 | 5889 | 1 |
| D | 0 | 6220 | 1 |
| Mode M9 | |||
|---|---|---|---|
| Quadrant | BADHDUFLAG | Total packets | Discarded packets |
| A | 0 | 10 | 0 |
| B | 0 | 10 | 0 |
| C | 0 | 10 | 0 |
| D | 0 | 11 | 0 |
| Quadrant | Total seconds | Saturated seconds | Saturation percentage |
|---|---|---|---|
| A | 1839 | 1839 | 100.000000% |
| B | 1839 | 79 | 4.295813% |
| C | 1839 | 179 | 9.733551% |
| D | 1839 | 65 | 3.534530% |
Noise dominated data is calculated using 1-second bins in cleaned event files. If a bin has >2000 counts, and if more than 50% of those come from <1% of pixels, then it is considered to be noise-dominated and hence unusable.
| Quadrant | # 1 sec bins | Bins with >0 counts | Bins with >2000 counts | High rate bins dominated by noise | Noise dominated (total time) | Noise dominated (detector-on time) | Marked lightcurve |
|---|---|---|---|---|---|---|---|
| A | 1838 | 1838 | 100 | 100 | 5.44% | 5.44% | 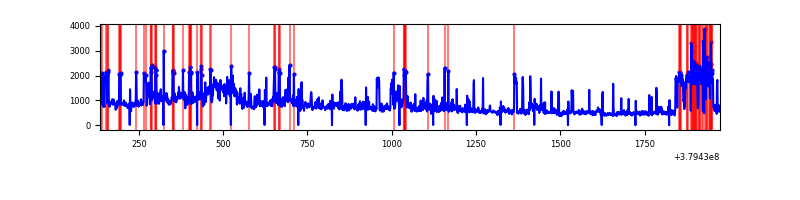 |
| B | 1839 | 1839 | 45 | 45 | 2.45% | 2.45% | 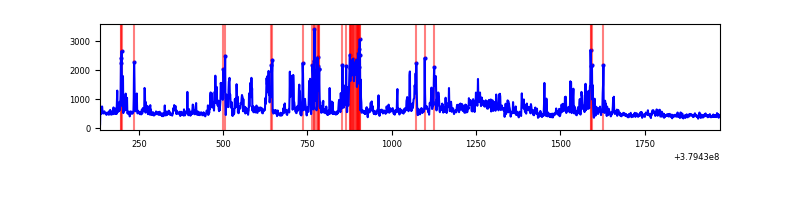 |
| C | 1839 | 1839 | 160 | 160 | 8.70% | 8.70% | 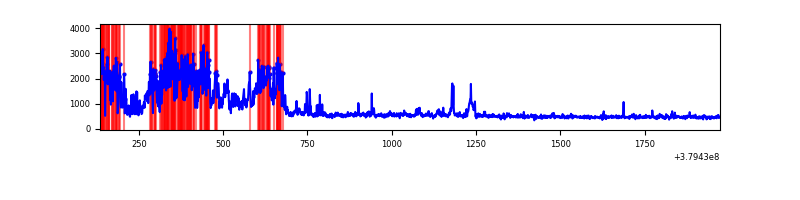 |
| D | 1839 | 1839 | 54 | 54 | 2.94% | 2.94% | 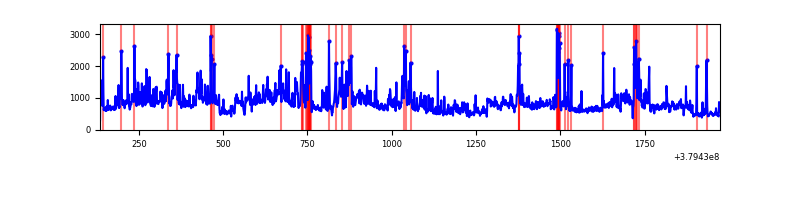 |
Top three noisy pixels from each quadrant. If the there are fewer than three noisy pixels in the level2.evt file, extra rows are filled as -1
| Pixel properties | Quadrant properties | ||||||
|---|---|---|---|---|---|---|---|
| Quadrant | DetID | PixID | Counts | Sigma | Mean | Median | Sigma |
| A | 15 | 169 | 1683763 | 822065.3 | 4 | 4 | 2.0 |
| A | 10 | 83 | 212 | 101.55 | 4 | 4 | 2.0 |
| A | 14 | 238 | 174 | 83.0 | 4 | 4 | 2.0 |
| B | 5 | 172 | 292382 | 6828.78 | 211 | 206 | 42.8 |
| B | 0 | 219 | 81757 | 1906.02 | 211 | 206 | 42.8 |
| B | 0 | 190 | 77554 | 1807.79 | 211 | 206 | 42.8 |
| C | 4 | 254 | 550445 | 11425.66 | 202 | 203 | 48.2 |
| C | 0 | 10 | 118197 | 2450.12 | 202 | 203 | 48.2 |
| C | 15 | 214 | 81504 | 1688.2 | 202 | 203 | 48.2 |
| D | 8 | 195 | 429657 | 8136.85 | 209 | 203 | 52.8 |
| D | 13 | 249 | 190730 | 3609.91 | 209 | 203 | 52.8 |
| D | 7 | 238 | 53018 | 1000.68 | 209 | 203 | 52.8 |
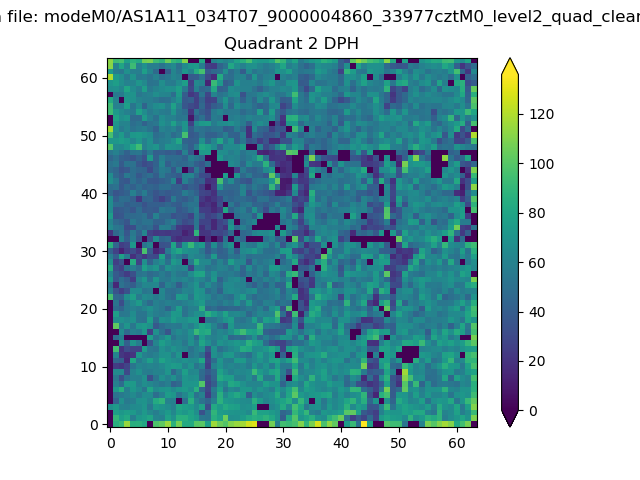
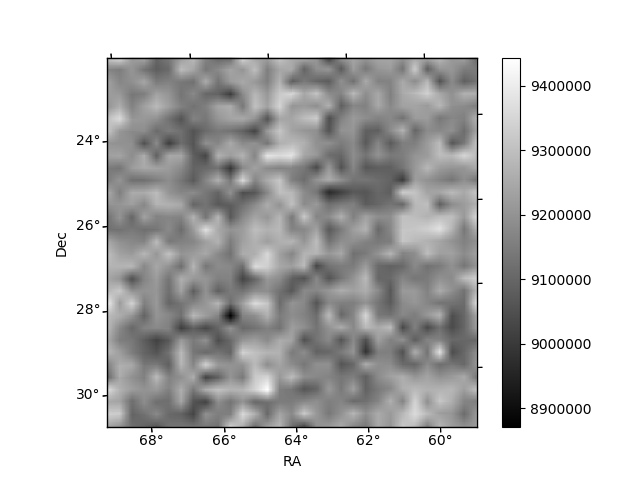
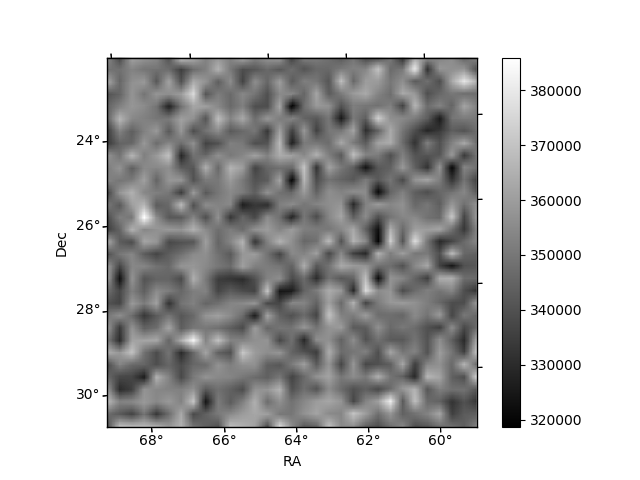
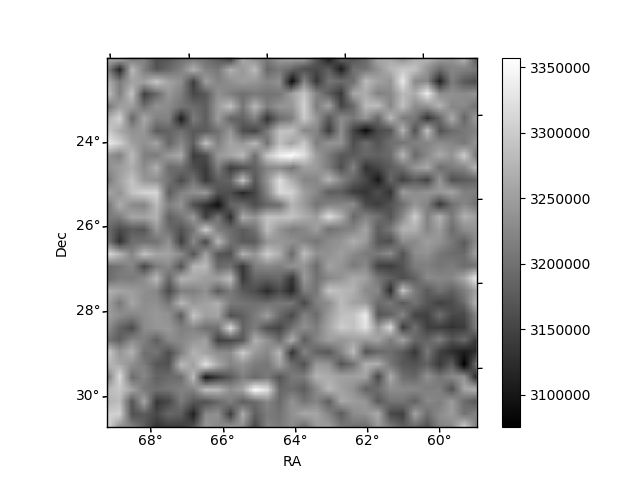
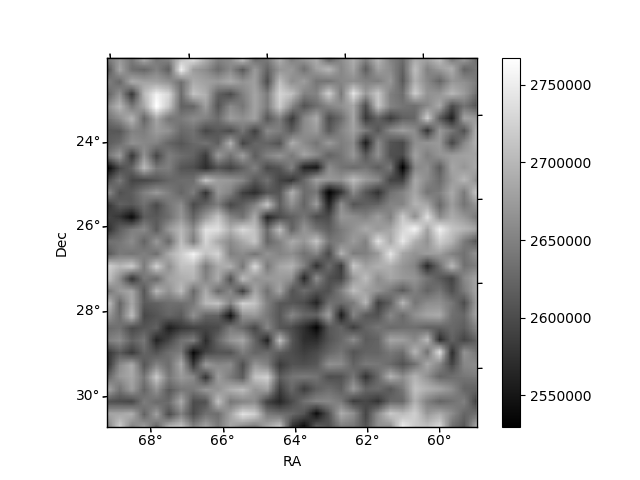
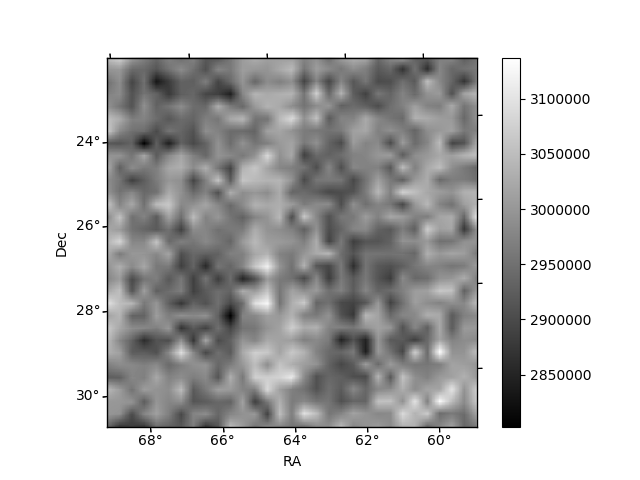
Histogram calculated using DETX and DETY for each event in the final _common_clean file
| Quadrant A | 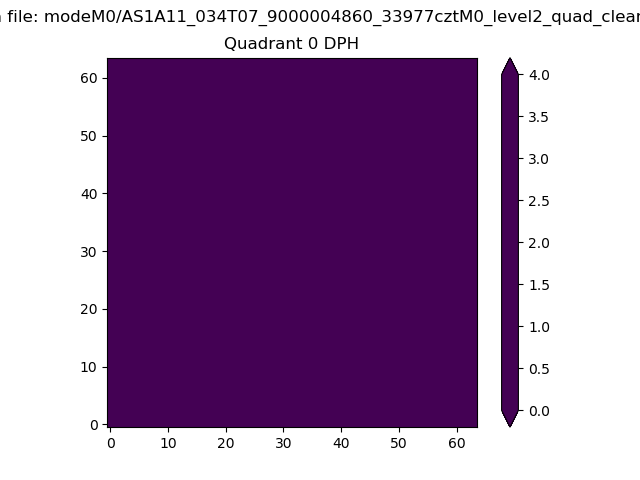 |
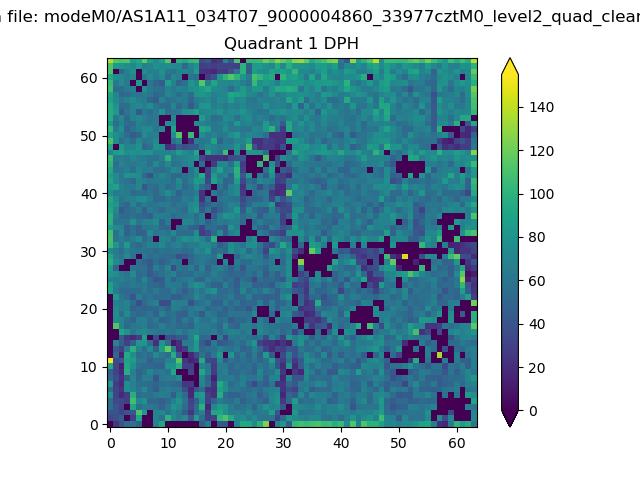 |
Quadrant B |
|---|---|---|---|
| Quadrant D | 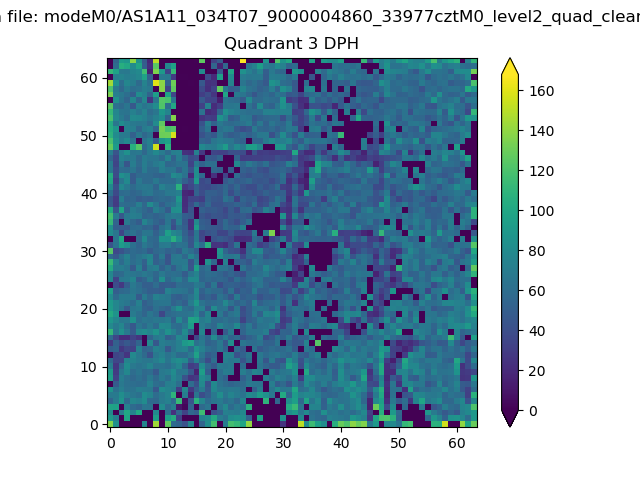 |
 |
Quadrant C |
| Plot type | Count rate plots | Images |
|---|---|---|
| Comparison with Poisson distribution Blue bars denote a histogram of data divided into 1 sec bins. Red curve is a Poisson curve with rate = median count rate of data. |
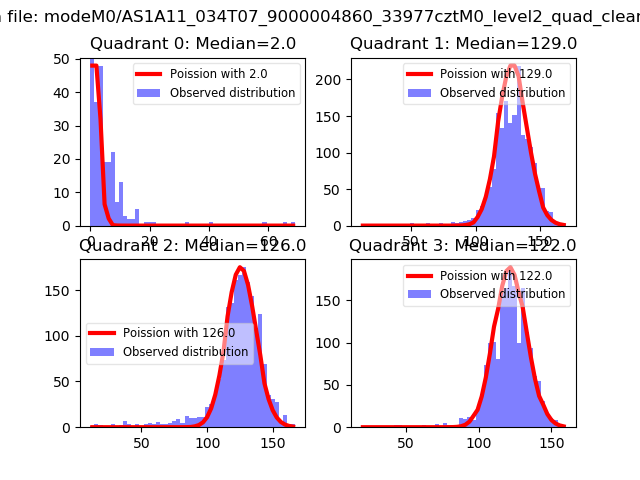 |
 |
| Quadrant-wise count rates Data is divided into 100 sec bins |
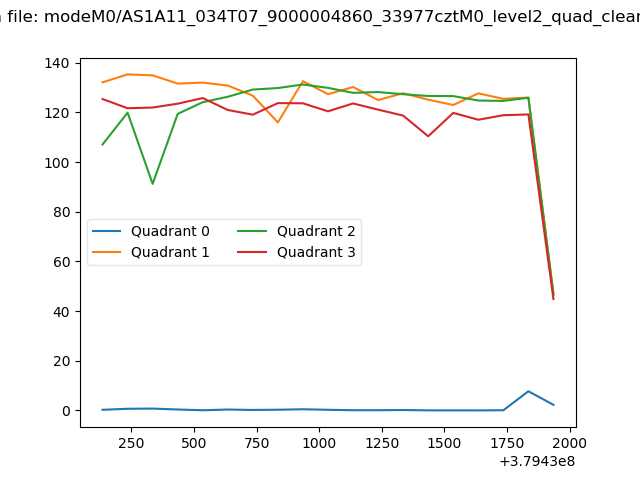 |
|
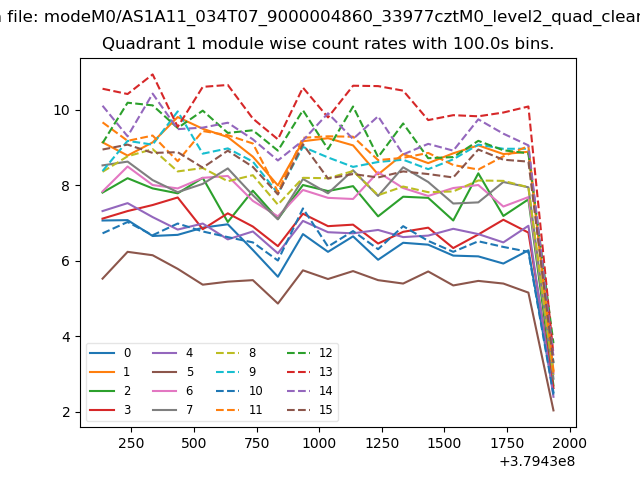
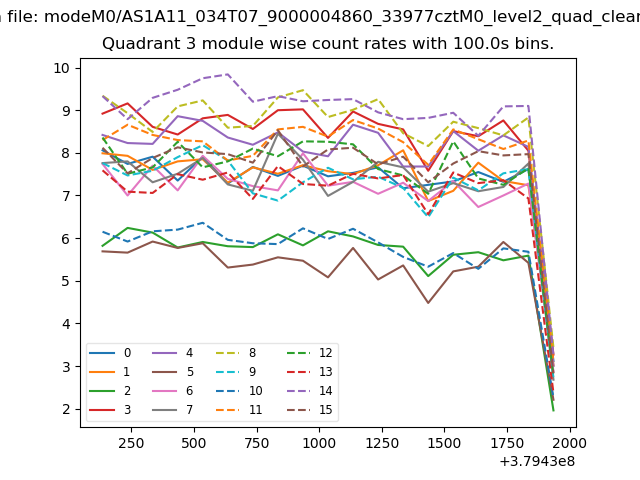
| Module-wise count rates for Quadrant A Data is divided into 100 sec bins |
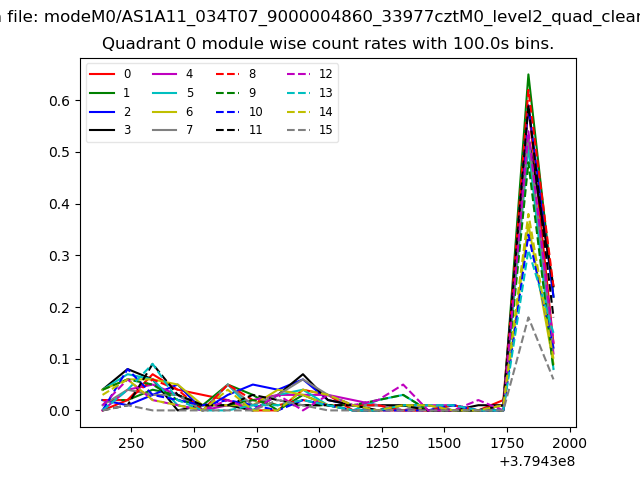 |
 |
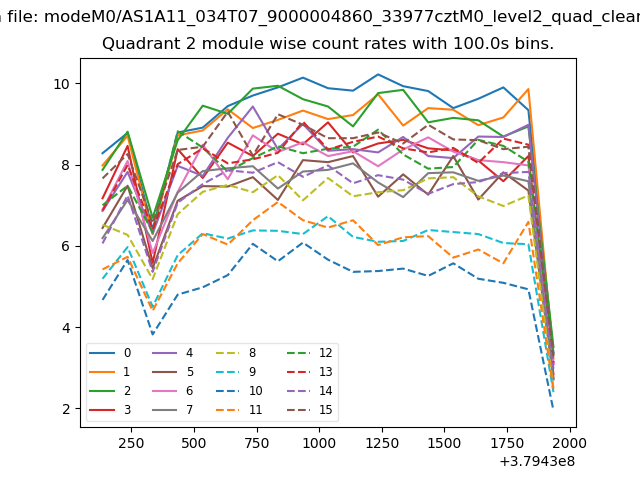
| Module-wise count rates for Quadrant B Data is divided into 100 sec bins |
 |
 |
| Module-wise count rates for Quadrant C Data is divided into 100 sec bins |
 |
 |
| Module-wise count rates for Quadrant D Data is divided into 100 sec bins |
 |
 |
| Parameter | Plot |
|---|---|
| CZT HV Monitor | 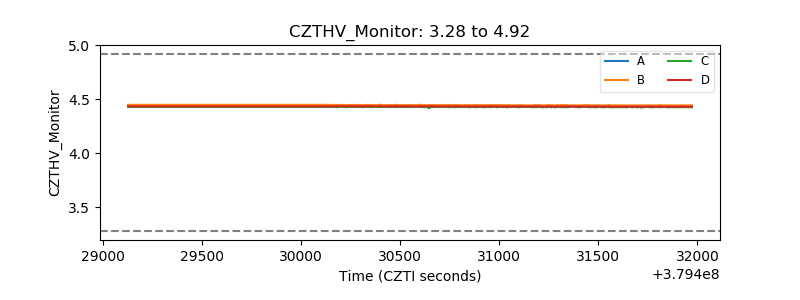 |
| D_VDD | 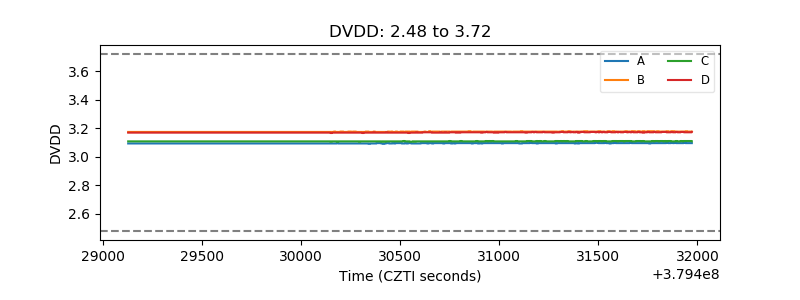 |
| Temperature 1 | 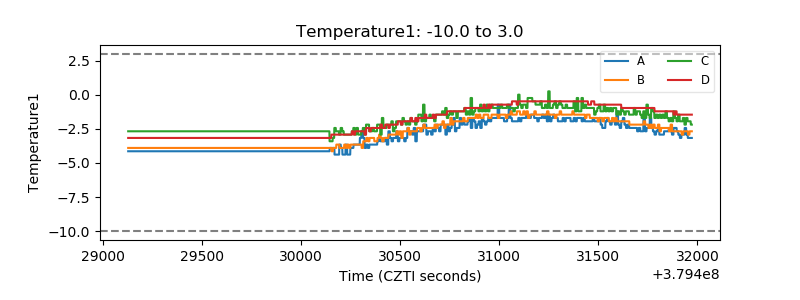 |
| Veto HV Monitor | 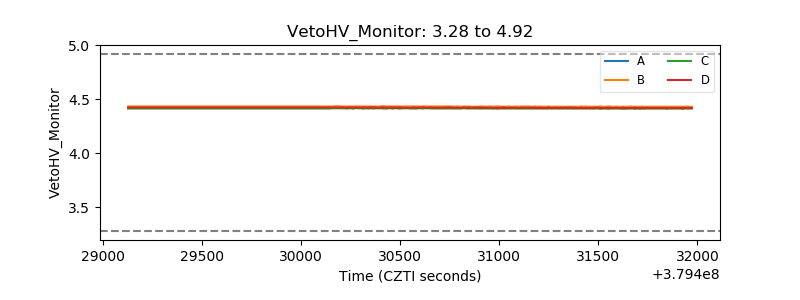 |
| Veto LLD | 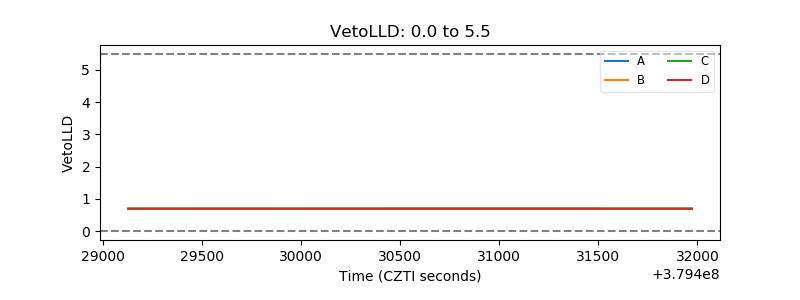 |
| Alpha Counter | 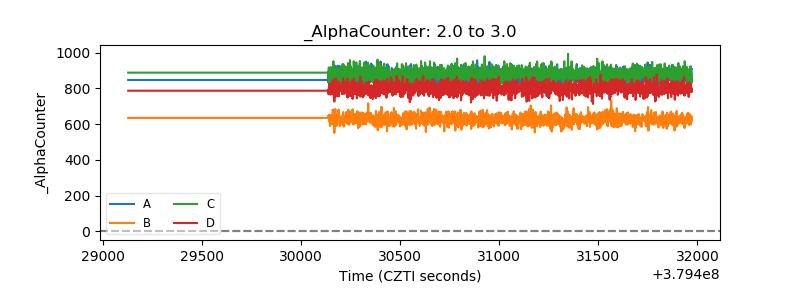 |
| _CPM_Rate | 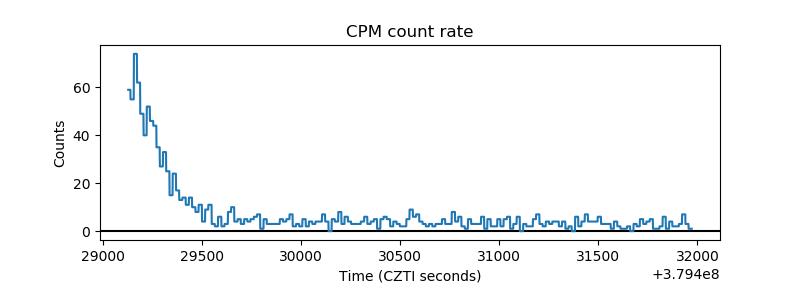 |
| CZT Counter | 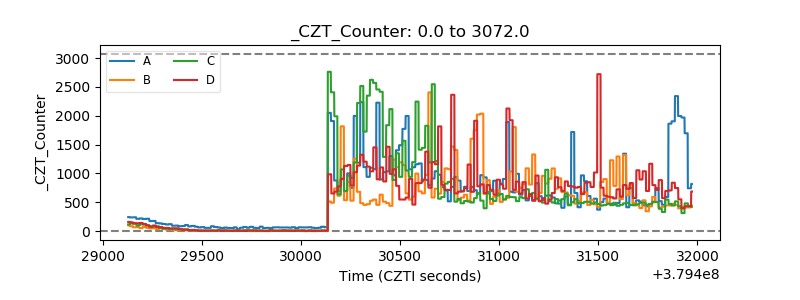 |
| +2.5 Volts monitor |  |
| +5 Volts monitor |  |
| _ROLL_ROT | 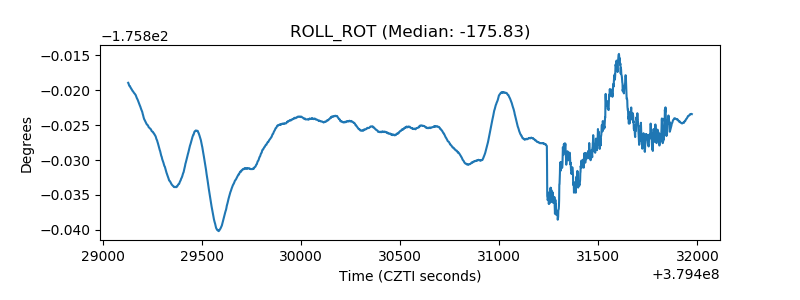 |
| _Roll_DEC | 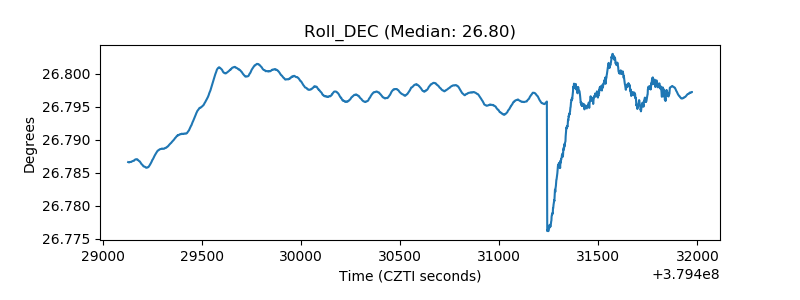 |
| _Roll_RA | 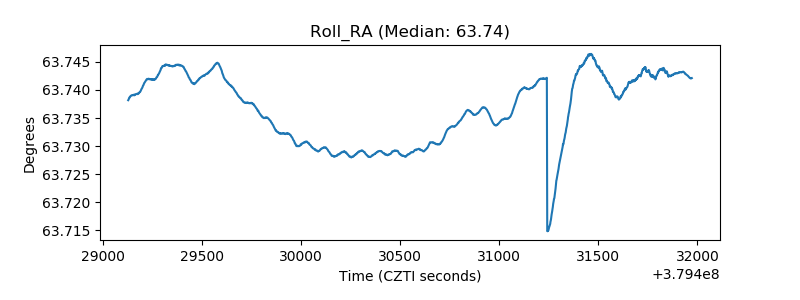 |
| Veto Counter | 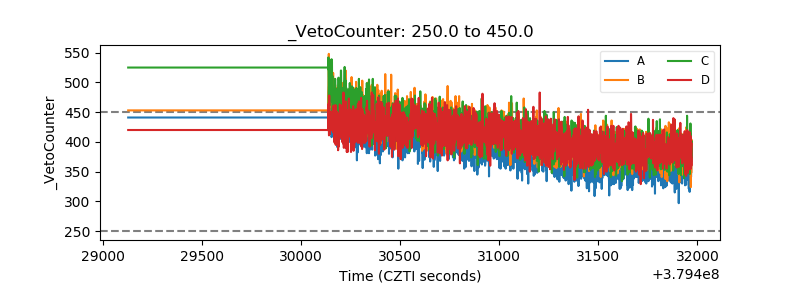 |