| Param | Original file | Final file |
|---|---|---|
| Filename | modeM0/AS1A11_046T07_9000004862_33977cztM0_level2.evt | modeM0/AS1A11_046T07_9000004862_33977cztM0_level2_quad_clean.evt |
| Size (bytes) | 252,938,880 | 22,098,240 |
| Size | 241.2 MB | 21.1 MB |
| Events in quadrant A | 2,568,970 | 1,015 |
| Events in quadrant B | 1,598,666 | 171,333 |
| Events in quadrant C | 1,447,445 | 173,729 |
| Events in quadrant D | 1,892,985 | 162,795 |
| Mode M9 | |||
|---|---|---|---|
| Quadrant | BADHDUFLAG | Total packets | Discarded packets |
| A | 0 | 16 | 0 |
| B | 0 | 16 | 0 |
| C | 0 | 16 | 0 |
| D | 0 | 16 | 0 |
| Mode M0 | |||
|---|---|---|---|
| Quadrant | BADHDUFLAG | Total packets | Discarded packets |
| A | 0 | 9200 | 2 |
| B | 0 | 6061 | 1 |
| C | 0 | 5607 | 1 |
| D | 0 | 7048 | 1 |
| Mode SS | |||
|---|---|---|---|
| Quadrant | BADHDUFLAG | Total packets | Discarded packets |
| A | 0 | 46 | 0 |
| B | 0 | 46 | 0 |
| C | 0 | 46 | 0 |
| D | 0 | 46 | 0 |
| Quadrant | Total seconds | Saturated seconds | Saturation percentage |
|---|---|---|---|
| A | 2199 | 2147 | 97.635289% |
| B | 2199 | 140 | 6.366530% |
| C | 2199 | 58 | 2.637563% |
| D | 2199 | 98 | 4.456571% |
Noise dominated data is calculated using 1-second bins in cleaned event files. If a bin has >2000 counts, and if more than 50% of those come from <1% of pixels, then it is considered to be noise-dominated and hence unusable.
| Quadrant | # 1 sec bins | Bins with >0 counts | Bins with >2000 counts | High rate bins dominated by noise | Noise dominated (total time) | Noise dominated (detector-on time) | Marked lightcurve |
|---|---|---|---|---|---|---|---|
| A | 3783 | 2199 | 221 | 221 | 5.84% | 10.05% | 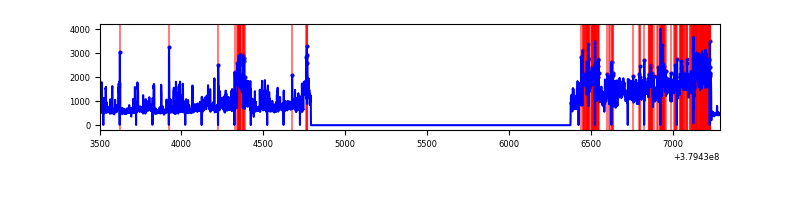 |
| B | 3783 | 2200 | 102 | 102 | 2.70% | 4.64% | 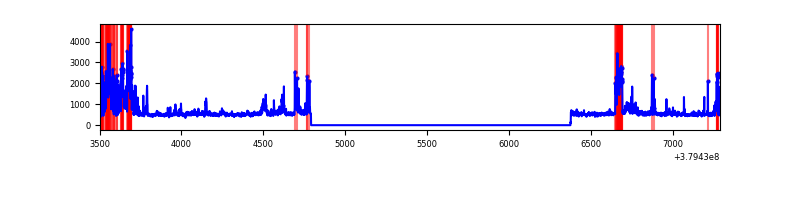 |
| C | 3783 | 2200 | 45 | 45 | 1.19% | 2.05% | 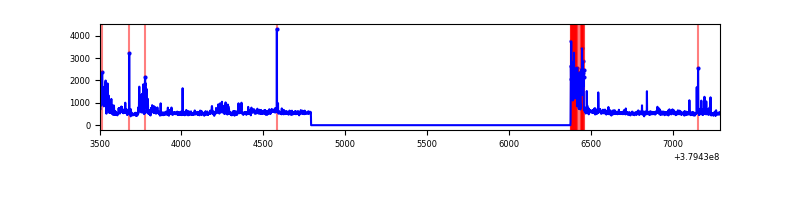 |
| D | 3783 | 2200 | 67 | 67 | 1.77% | 3.05% | 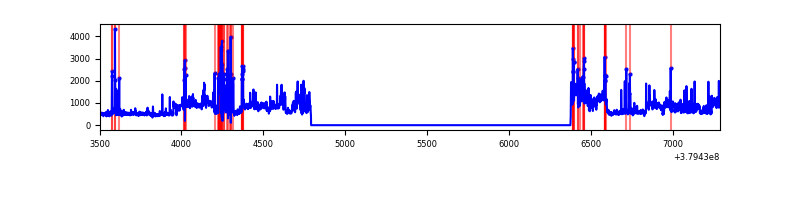 |
Top three noisy pixels from each quadrant. If the there are fewer than three noisy pixels in the level2.evt file, extra rows are filled as -1
| Pixel properties | Quadrant properties | ||||||
|---|---|---|---|---|---|---|---|
| Quadrant | DetID | PixID | Counts | Sigma | Mean | Median | Sigma |
| A | 15 | 169 | 2500148 | 459095.59 | 17 | 17 | 5.4 |
| A | 10 | 83 | 426 | 75.1 | 17 | 17 | 5.4 |
| A | 13 | 6 | 339 | 59.13 | 17 | 17 | 5.4 |
| B | 5 | 172 | 445598 | 8390.05 | 265 | 258 | 53.1 |
| B | 0 | 182 | 35770 | 669.03 | 265 | 258 | 53.1 |
| B | 0 | 189 | 25583 | 477.11 | 265 | 258 | 53.1 |
| C | 0 | 10 | 156926 | 2524.11 | 262 | 265 | 62.1 |
| C | 4 | 254 | 103788 | 1667.95 | 262 | 265 | 62.1 |
| C | 15 | 214 | 96941 | 1557.64 | 262 | 265 | 62.1 |
| D | 8 | 195 | 438200 | 6654.57 | 263 | 255 | 65.8 |
| D | 13 | 249 | 156699 | 2377.16 | 263 | 255 | 65.8 |
| D | 2 | 250 | 100656 | 1525.59 | 263 | 255 | 65.8 |
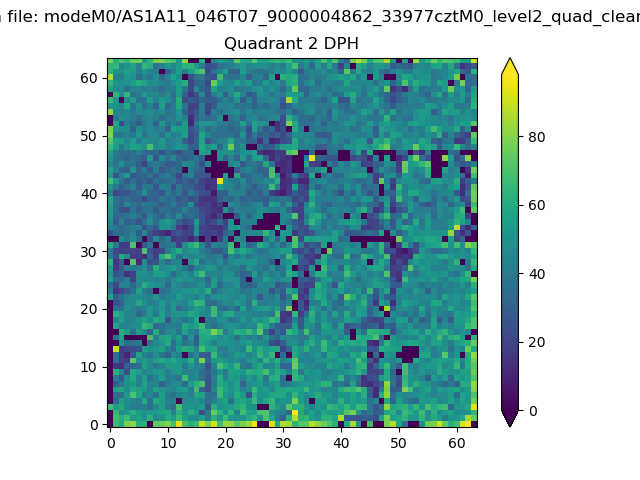
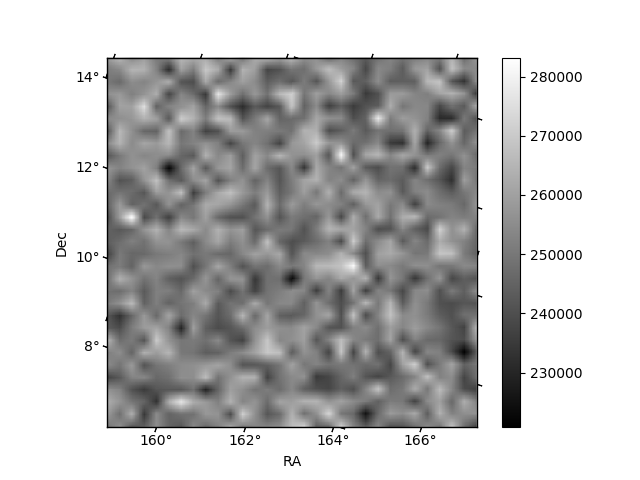
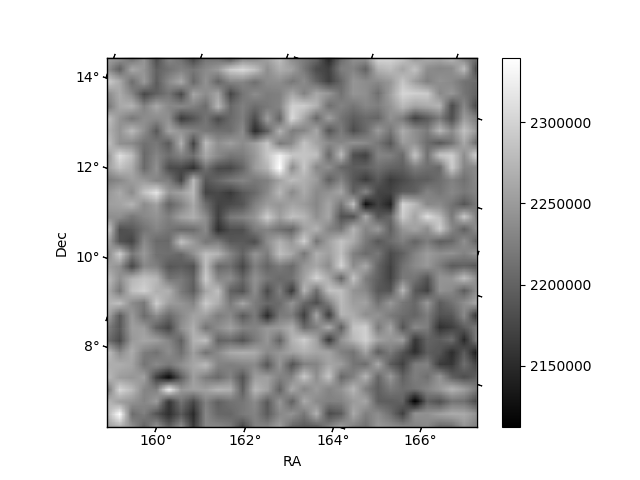
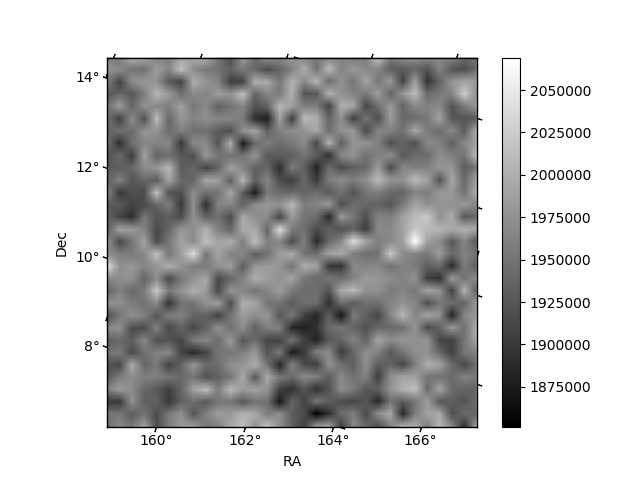
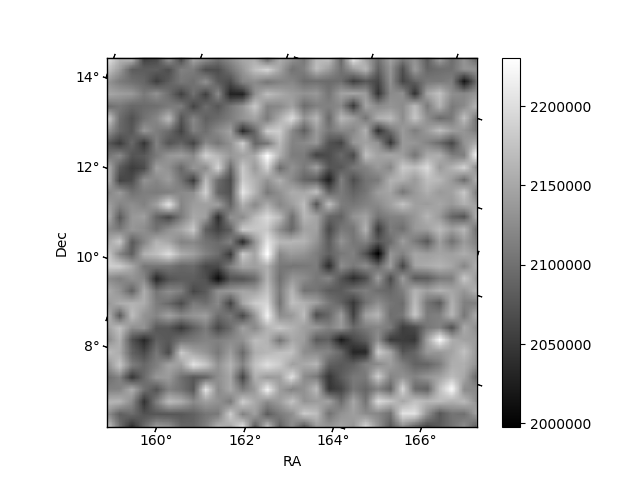
Histogram calculated using DETX and DETY for each event in the final _common_clean file
| Quadrant A | 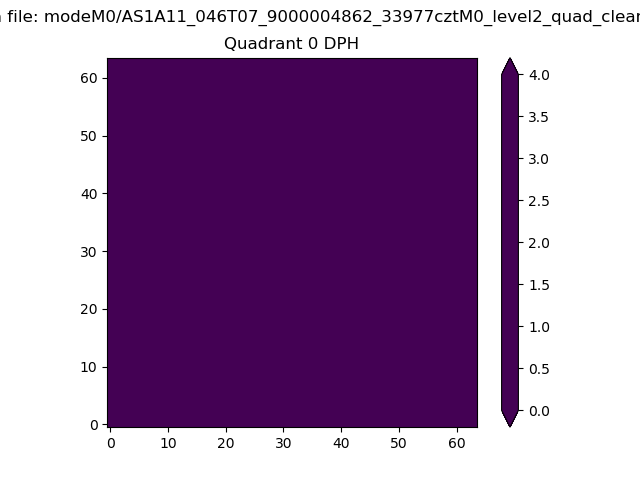 |
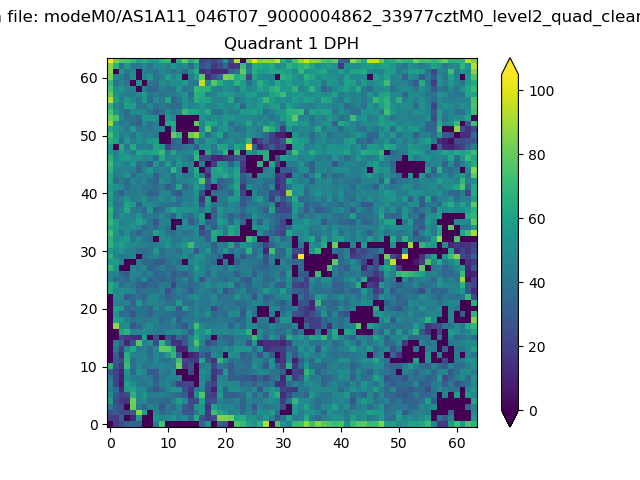 |
Quadrant B |
|---|---|---|---|
| Quadrant D | 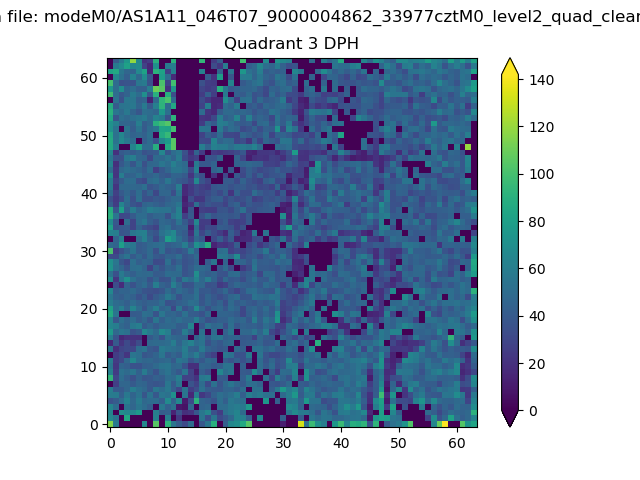 |
 |
Quadrant C |
| Plot type | Count rate plots | Images |
|---|---|---|
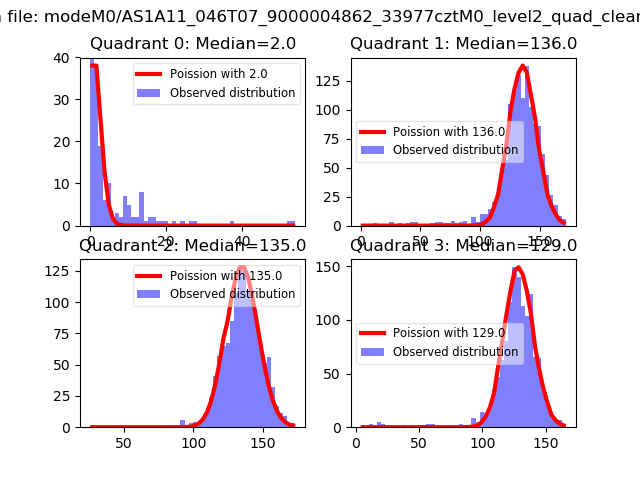
| Comparison with Poisson distribution Blue bars denote a histogram of data divided into 1 sec bins. Red curve is a Poisson curve with rate = median count rate of data. |
 |
 |
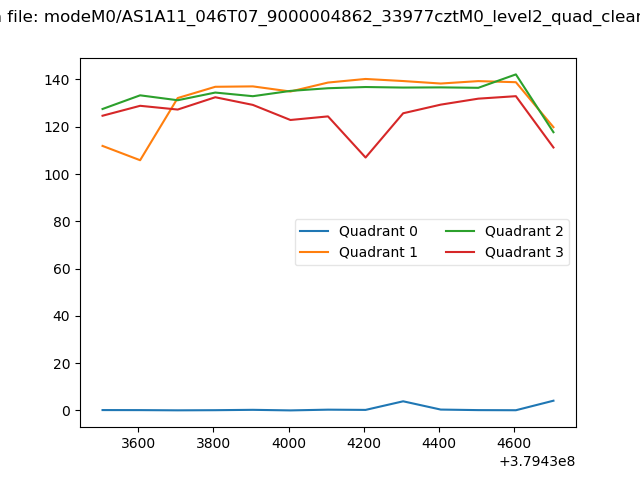
| Quadrant-wise count rates Data is divided into 100 sec bins |
 |
|
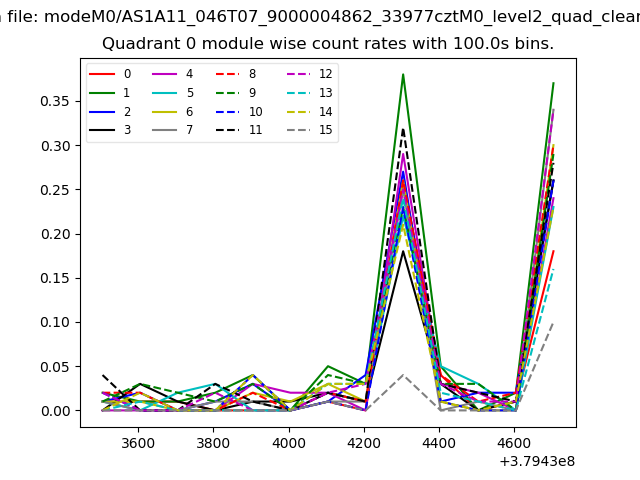
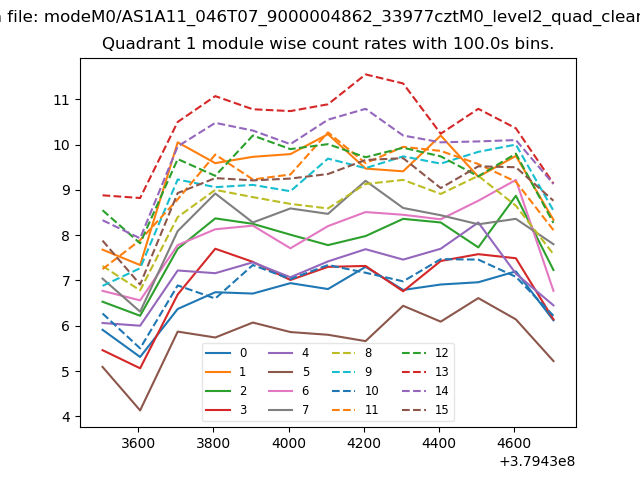
| Module-wise count rates for Quadrant A Data is divided into 100 sec bins |
 |
 |
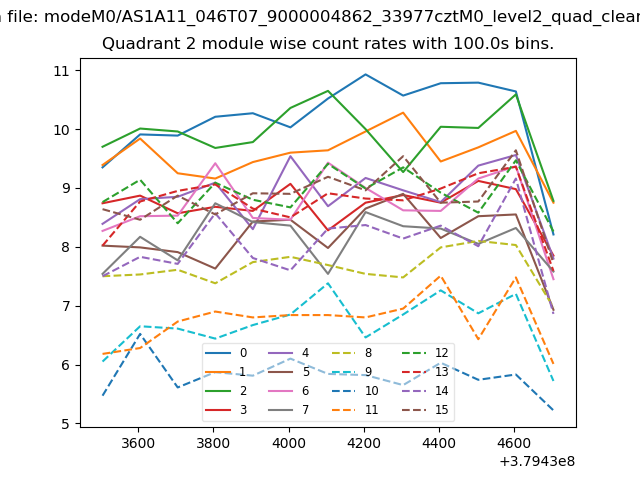
| Module-wise count rates for Quadrant B Data is divided into 100 sec bins |
 |
 |
| Module-wise count rates for Quadrant C Data is divided into 100 sec bins |
 |
 |
| Module-wise count rates for Quadrant D Data is divided into 100 sec bins |
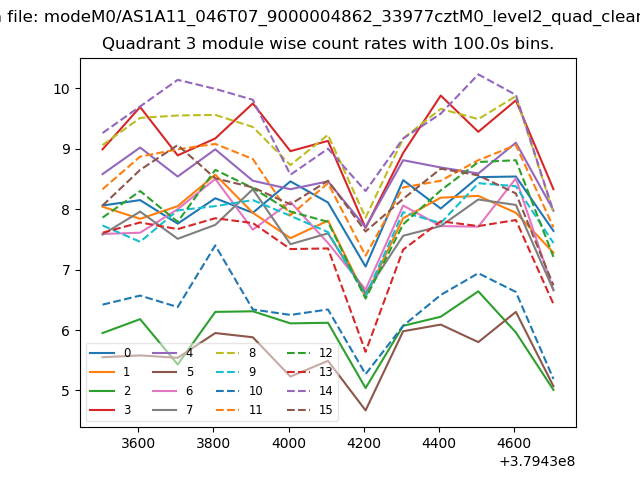 |
 |
| Parameter | Plot |
|---|---|
| CZT HV Monitor | 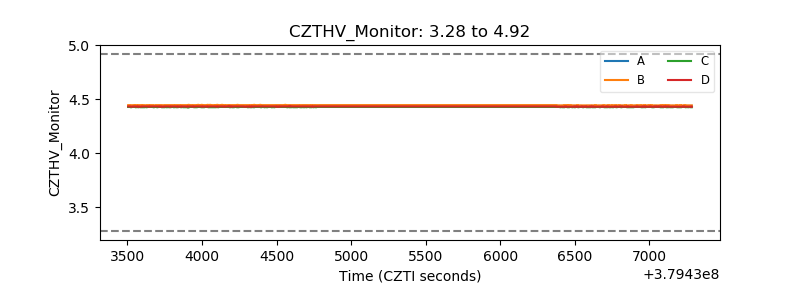 |
| D_VDD | 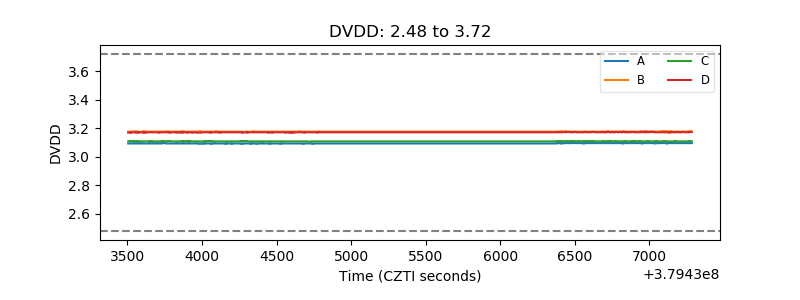 |
| Temperature 1 | 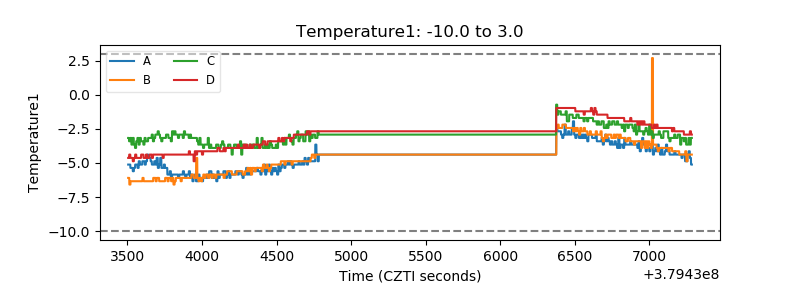 |
| Veto HV Monitor | 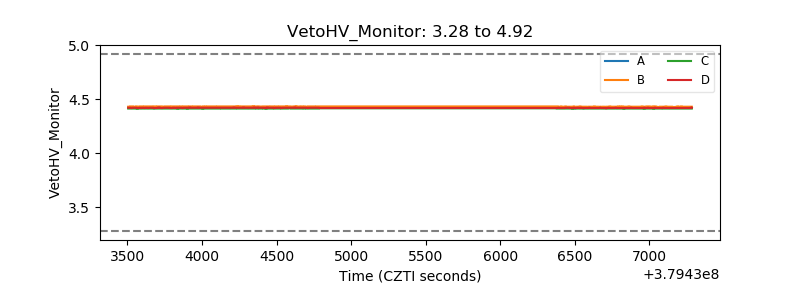 |
| Veto LLD | 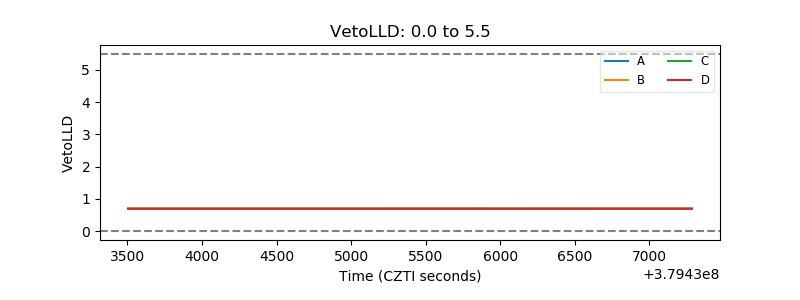 |
| Alpha Counter | 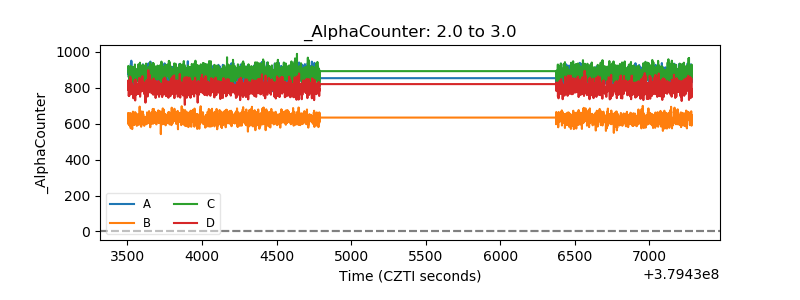 |
| _CPM_Rate | 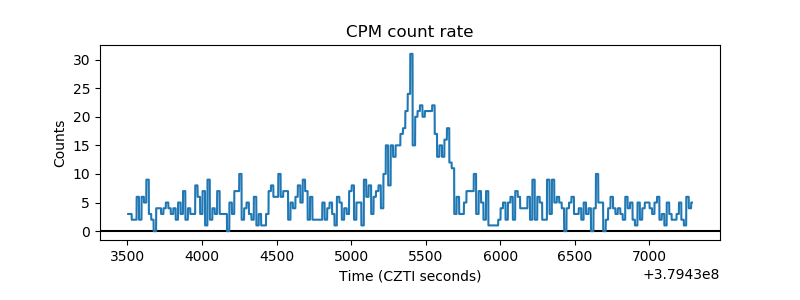 |
| CZT Counter | 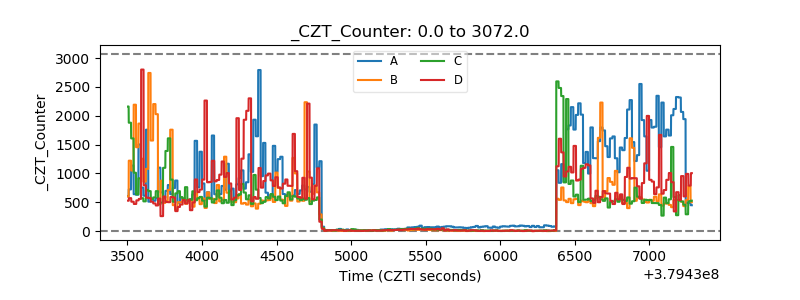 |
| +2.5 Volts monitor | 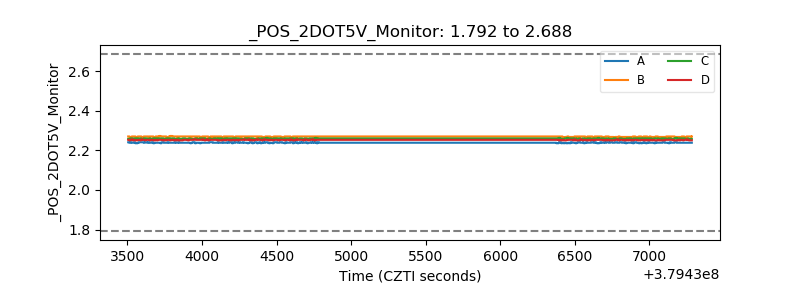 |
| +5 Volts monitor |  |
| _ROLL_ROT | 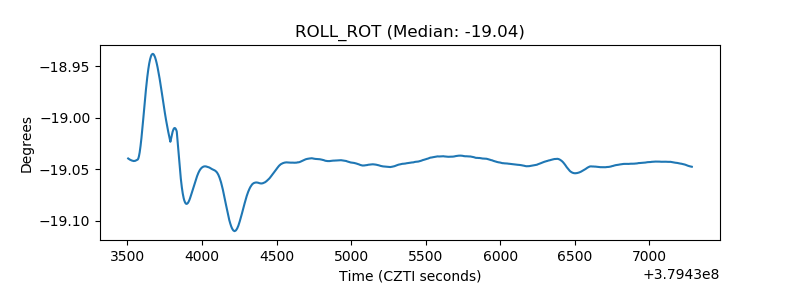 |
| _Roll_DEC |  |
| _Roll_RA | 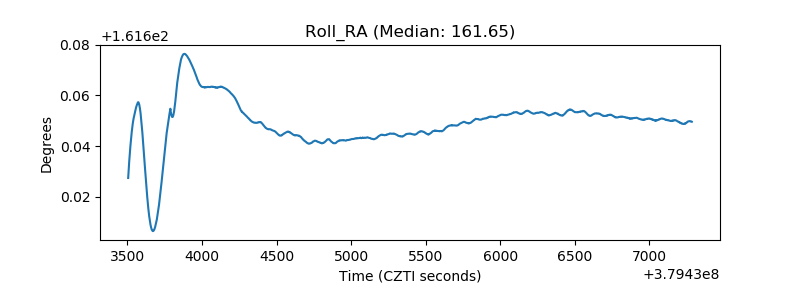 |
| Veto Counter | 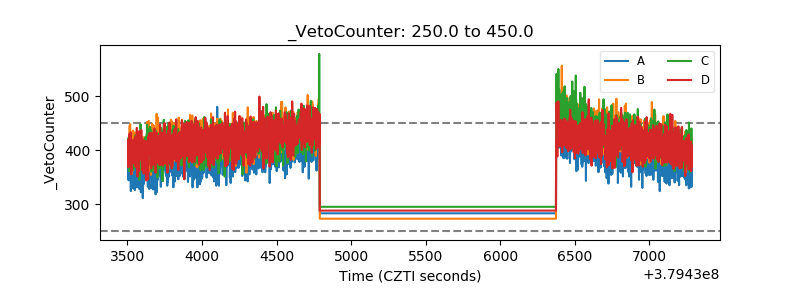 |