| Param | Original file | Final file |
|---|---|---|
| Filename | modeM0/AS1A11_046T07_9000004862_33978cztM0_level2.evt | modeM0/AS1A11_046T07_9000004862_33978cztM0_level2_quad_clean.evt |
| Size (bytes) | 588,844,800 | 75,885,120 |
| Size | 561.6 MB | 72.4 MB |
| Events in quadrant A | 4,119,185 | 480,848 |
| Events in quadrant B | 4,263,786 | 477,913 |
| Events in quadrant C | 3,740,847 | 480,611 |
| Events in quadrant D | 5,317,841 | 453,864 |
| Mode M9 | |||
|---|---|---|---|
| Quadrant | BADHDUFLAG | Total packets | Discarded packets |
| A | 0 | 30 | 0 |
| B | 0 | 30 | 0 |
| C | 0 | 30 | 0 |
| D | 0 | 30 | 0 |
| Mode M0 | |||
|---|---|---|---|
| Quadrant | BADHDUFLAG | Total packets | Discarded packets |
| A | 0 | 16005 | 3 |
| B | 0 | 16459 | 2 |
| C | 0 | 14610 | 2 |
| D | 0 | 19741 | 2 |
| Mode SS | |||
|---|---|---|---|
| Quadrant | BADHDUFLAG | Total packets | Discarded packets |
| A | 0 | 118 | 0 |
| B | 0 | 118 | 0 |
| C | 0 | 118 | 0 |
| D | 0 | 118 | 0 |
| Quadrant | Total seconds | Saturated seconds | Saturation percentage |
|---|---|---|---|
| A | 5791 | 1011 | 17.458125% |
| B | 5791 | 363 | 6.268347% |
| C | 5791 | 239 | 4.127094% |
| D | 5791 | 249 | 4.299776% |
Noise dominated data is calculated using 1-second bins in cleaned event files. If a bin has >2000 counts, and if more than 50% of those come from <1% of pixels, then it is considered to be noise-dominated and hence unusable.
| Quadrant | # 1 sec bins | Bins with >0 counts | Bins with >2000 counts | High rate bins dominated by noise | Noise dominated (total time) | Noise dominated (detector-on time) | Marked lightcurve |
|---|---|---|---|---|---|---|---|
| A | 8717 | 5792 | 256 | 256 | 2.94% | 4.42% | 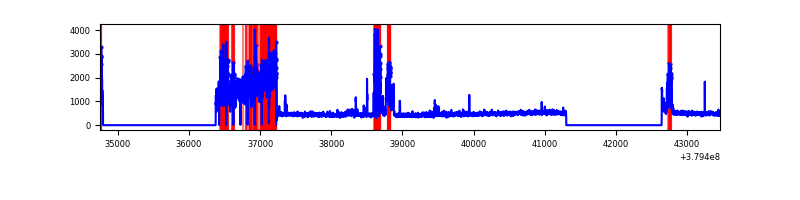 |
| B | 8717 | 5793 | 255 | 255 | 2.93% | 4.40% | 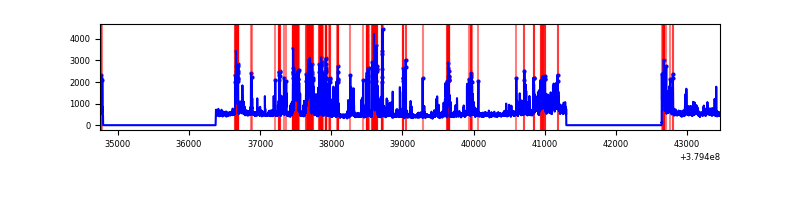 |
| C | 8717 | 5793 | 187 | 187 | 2.15% | 3.23% | 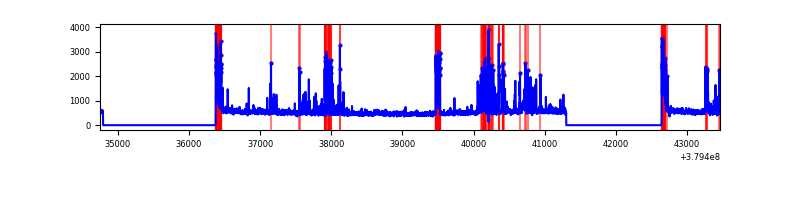 |
| D | 8717 | 5793 | 202 | 202 | 2.32% | 3.49% | 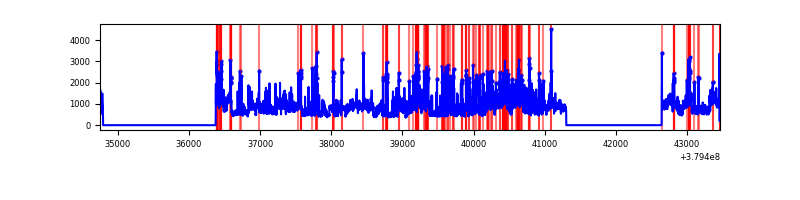 |
Top three noisy pixels from each quadrant. If the there are fewer than three noisy pixels in the level2.evt file, extra rows are filled as -1
| Pixel properties | Quadrant properties | ||||||
|---|---|---|---|---|---|---|---|
| Quadrant | DetID | PixID | Counts | Sigma | Mean | Median | Sigma |
| A | 15 | 169 | 1858695 | 15795.18 | 579 | 568 | 117.6 |
| A | 13 | 6 | 14131 | 115.29 | 579 | 568 | 117.6 |
| A | 10 | 83 | 9874 | 79.11 | 579 | 568 | 117.6 |
| B | 5 | 172 | 1281159 | 9823.57 | 673 | 655 | 130.4 |
| B | 0 | 182 | 97588 | 743.63 | 673 | 655 | 130.4 |
| B | 0 | 190 | 75205 | 571.92 | 673 | 655 | 130.4 |
| C | 4 | 254 | 435396 | 2828.41 | 660 | 665 | 153.7 |
| C | 0 | 10 | 329945 | 2142.33 | 660 | 665 | 153.7 |
| C | 15 | 214 | 250061 | 1622.6 | 660 | 665 | 153.7 |
| D | 8 | 195 | 1332851 | 8062.77 | 662 | 642 | 165.2 |
| D | 2 | 250 | 527892 | 3191.01 | 662 | 642 | 165.2 |
| D | 13 | 249 | 340114 | 2054.55 | 662 | 642 | 165.2 |
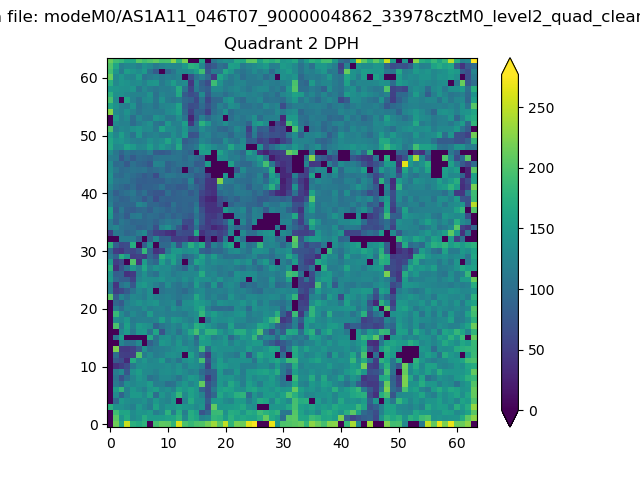
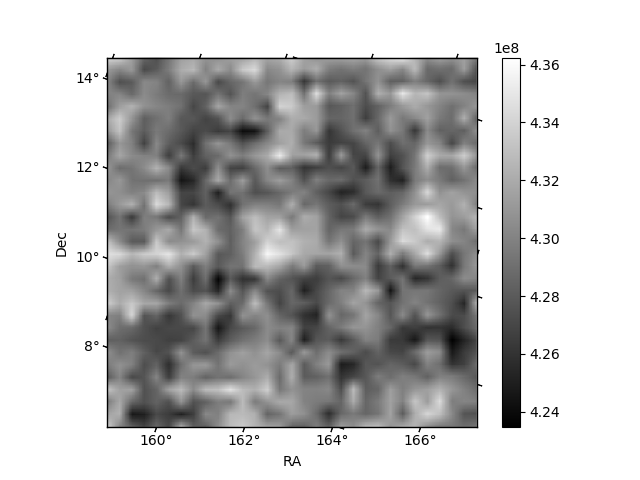
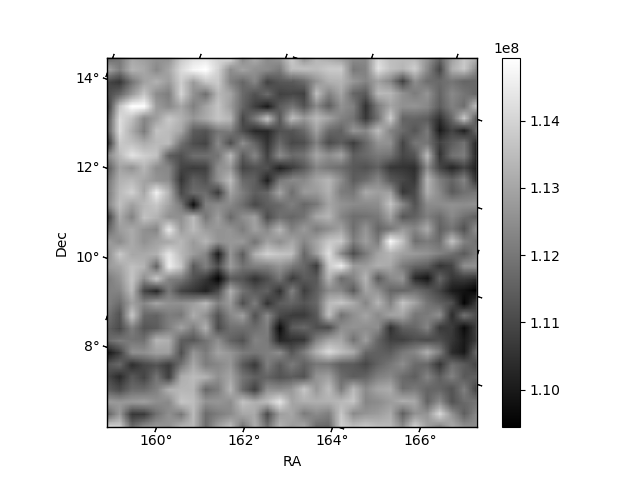
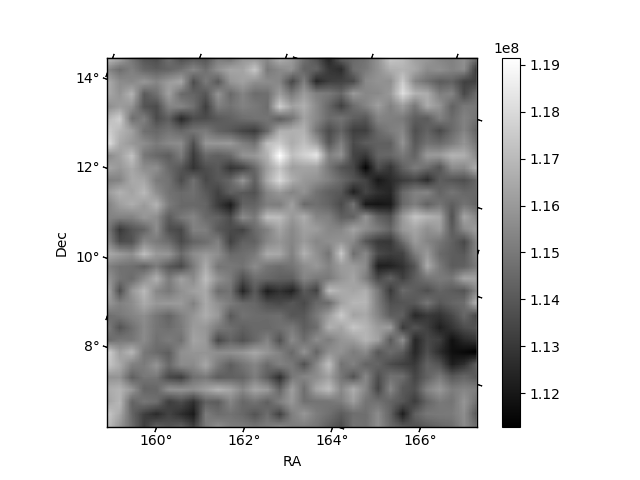
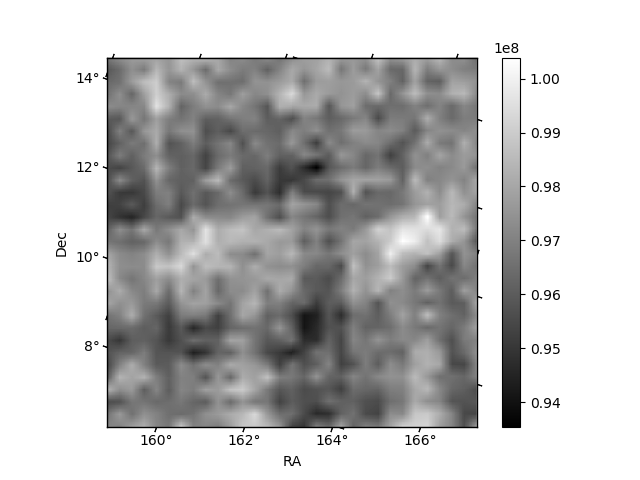
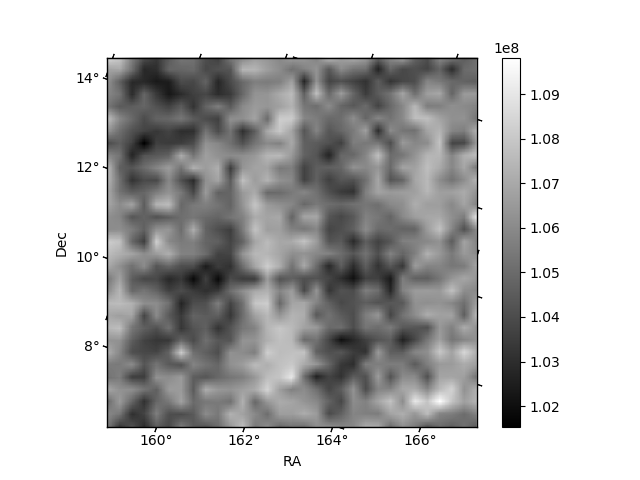
Histogram calculated using DETX and DETY for each event in the final _common_clean file
| Quadrant A | 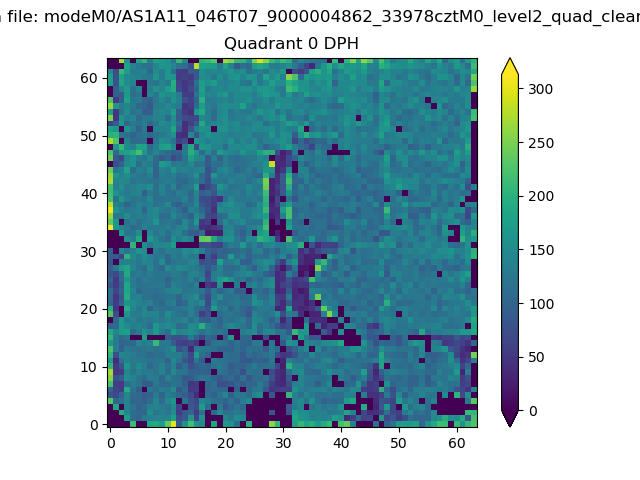 |
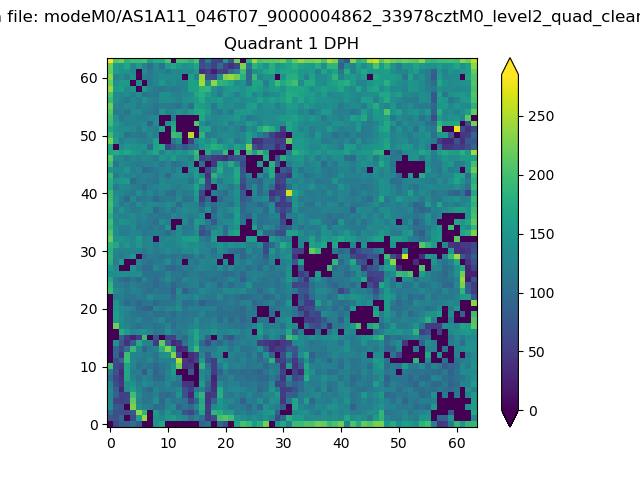 |
Quadrant B |
|---|---|---|---|
| Quadrant D | 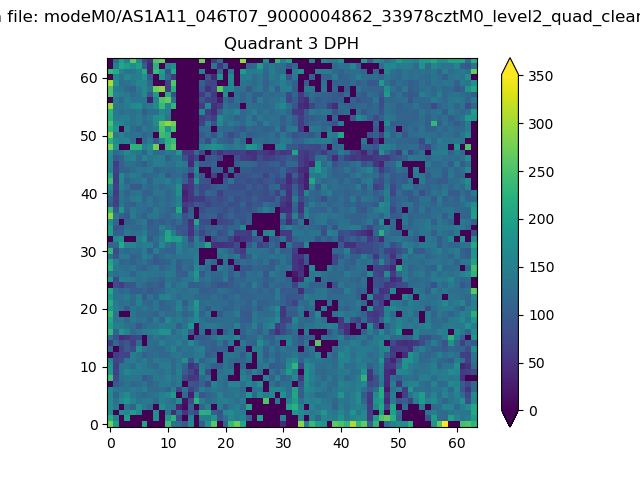 |
 |
Quadrant C |
| Plot type | Count rate plots | Images |
|---|---|---|
| Comparison with Poisson distribution Blue bars denote a histogram of data divided into 1 sec bins. Red curve is a Poisson curve with rate = median count rate of data. |
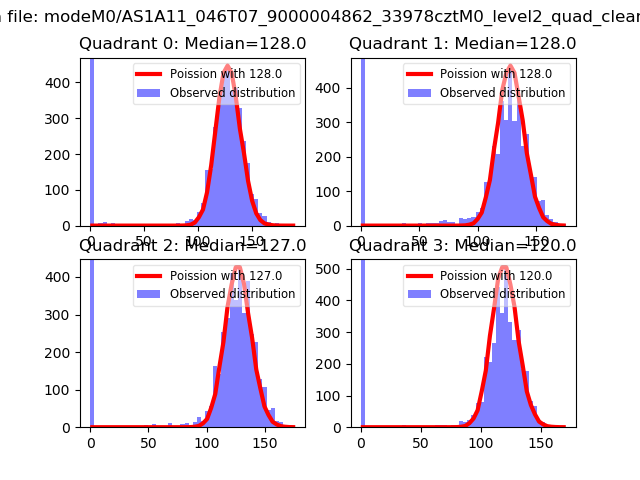 |
 |
| Quadrant-wise count rates Data is divided into 100 sec bins |
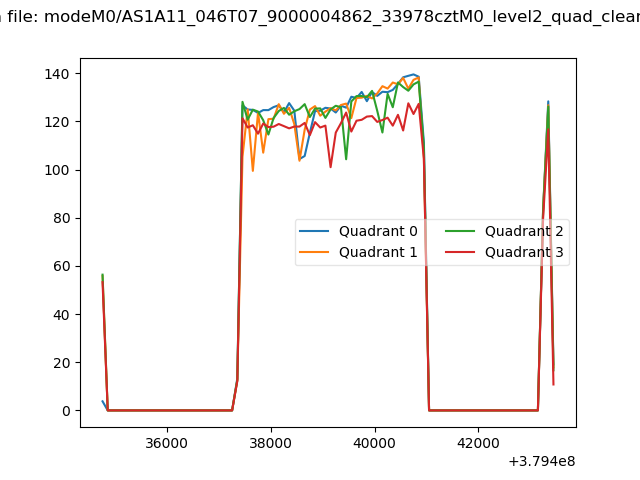 |
|
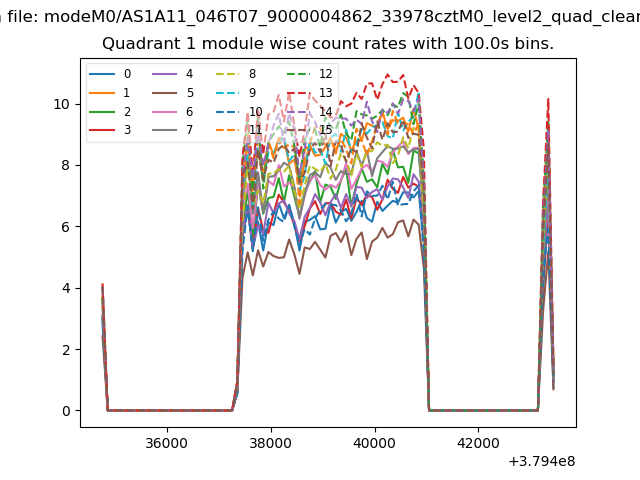
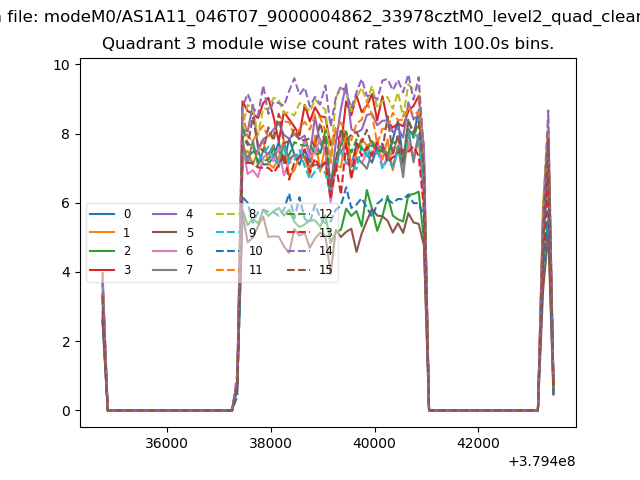
| Module-wise count rates for Quadrant A Data is divided into 100 sec bins |
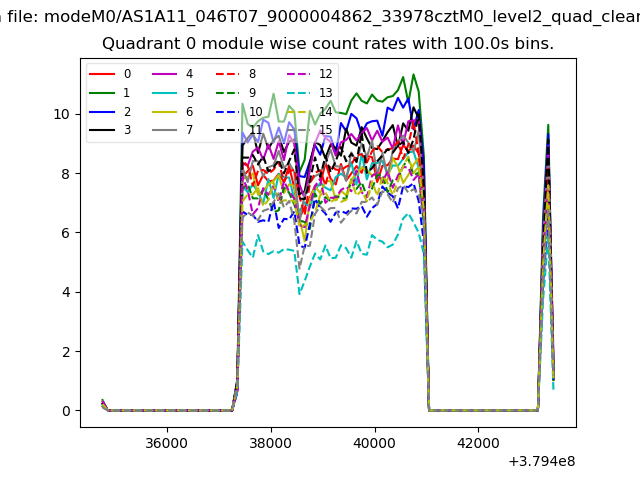 |
 |
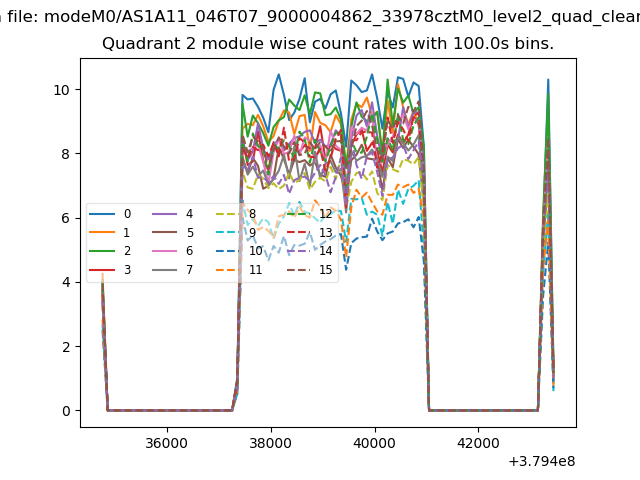
| Module-wise count rates for Quadrant B Data is divided into 100 sec bins |
 |
 |
| Module-wise count rates for Quadrant C Data is divided into 100 sec bins |
 |
 |
| Module-wise count rates for Quadrant D Data is divided into 100 sec bins |
 |
 |
| Parameter | Plot |
|---|---|
| CZT HV Monitor | 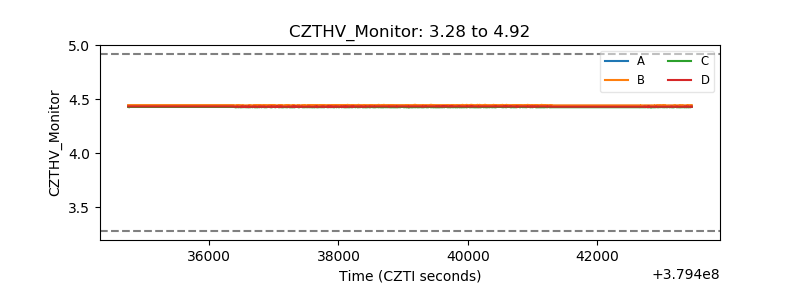 |
| D_VDD | 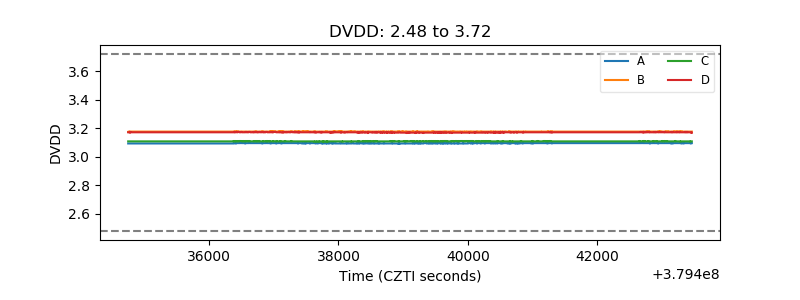 |
| Temperature 1 | 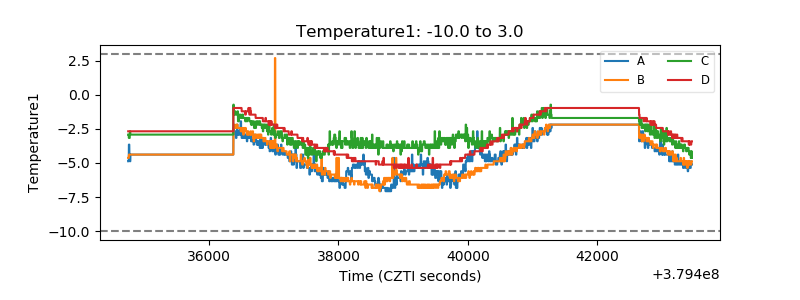 |
| Veto HV Monitor | 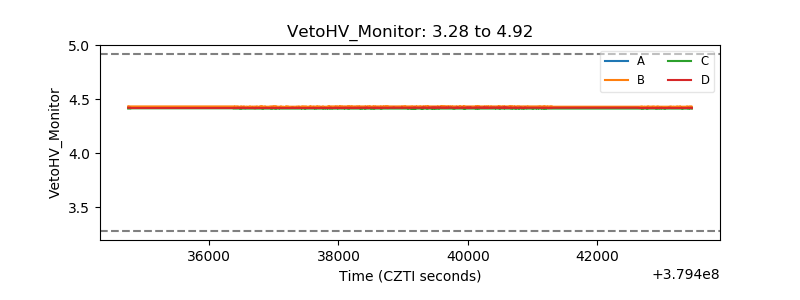 |
| Veto LLD | 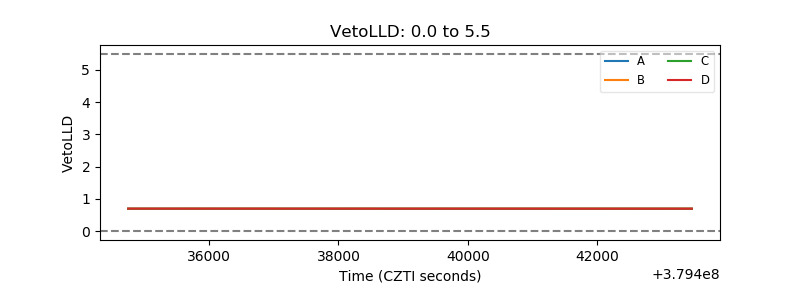 |
| Alpha Counter | 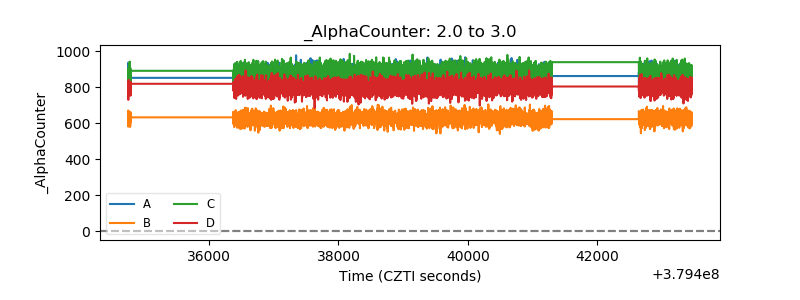 |
| _CPM_Rate | 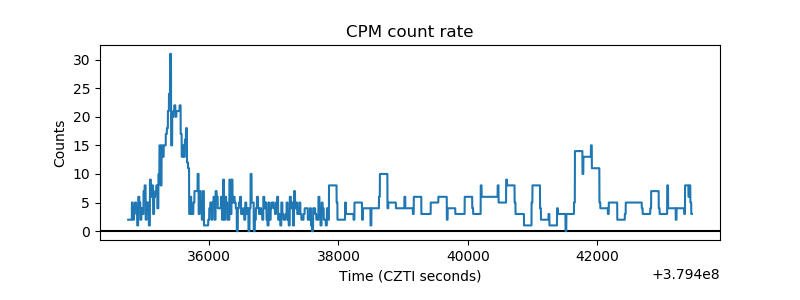 |
| CZT Counter | 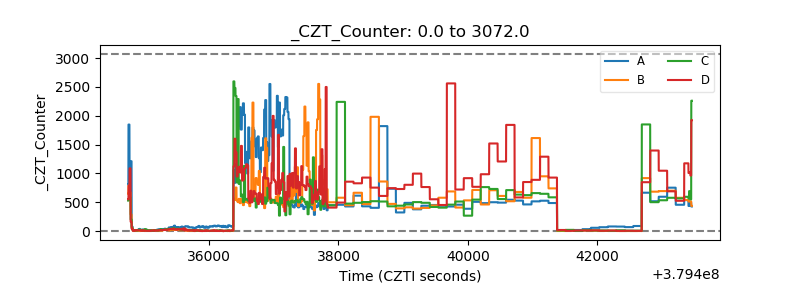 |
| +2.5 Volts monitor |  |
| +5 Volts monitor |  |
| _ROLL_ROT |  |
| _Roll_DEC | 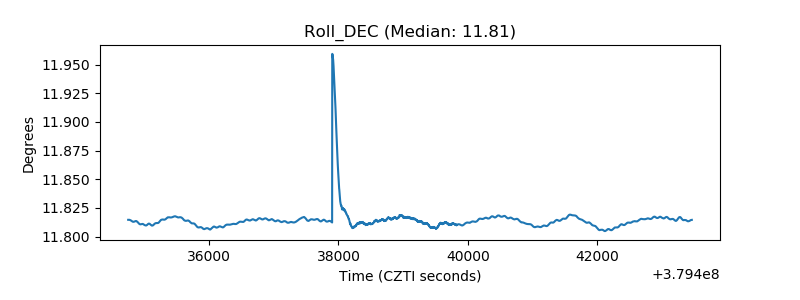 |
| _Roll_RA | 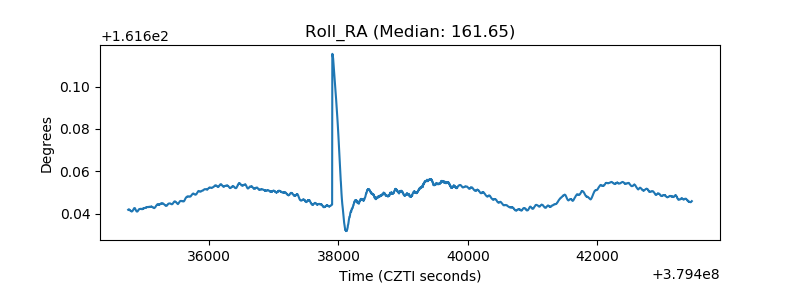 |
| Veto Counter |  |