| Param | Original file | Final file |
|---|---|---|
| Filename | modeM0/AS1A11_046T07_9000004862_33983cztM0_level2.evt | modeM0/AS1A11_046T07_9000004862_33983cztM0_level2_quad_clean.evt |
| Size (bytes) | 2,008,578,240 | 259,911,360 |
| Size | 1.9 GB | 247.9 MB |
| Events in quadrant A | 14,725,578 | 1,604,490 |
| Events in quadrant B | 12,502,250 | 1,693,070 |
| Events in quadrant C | 14,813,422 | 1,620,700 |
| Events in quadrant D | 17,422,064 | 1,552,909 |
| Mode M9 | |||
|---|---|---|---|
| Quadrant | BADHDUFLAG | Total packets | Discarded packets |
| A | 0 | 59 | 0 |
| B | 0 | 59 | 0 |
| C | 0 | 59 | 0 |
| D | 0 | 60 | 0 |
| Mode M0 | |||
|---|---|---|---|
| Quadrant | BADHDUFLAG | Total packets | Discarded packets |
| A | 0 | 57181 | 6 |
| B | 0 | 50691 | 5 |
| C | 0 | 56676 | 5 |
| D | 0 | 66065 | 5 |
| Mode SS | |||
|---|---|---|---|
| Quadrant | BADHDUFLAG | Total packets | Discarded packets |
| A | 0 | 416 | 0 |
| B | 0 | 416 | 0 |
| C | 0 | 416 | 0 |
| D | 0 | 416 | 0 |
| Quadrant | Total seconds | Saturated seconds | Saturation percentage |
|---|---|---|---|
| A | 20320 | 1853 | 9.119094% |
| B | 20320 | 519 | 2.554134% |
| C | 20320 | 1368 | 6.732283% |
| D | 20320 | 1285 | 6.323819% |
Noise dominated data is calculated using 1-second bins in cleaned event files. If a bin has >2000 counts, and if more than 50% of those come from <1% of pixels, then it is considered to be noise-dominated and hence unusable.
| Quadrant | # 1 sec bins | Bins with >0 counts | Bins with >2000 counts | High rate bins dominated by noise | Noise dominated (total time) | Noise dominated (detector-on time) | Marked lightcurve |
|---|---|---|---|---|---|---|---|
| A | 26226 | 20324 | 1607 | 1607 | 6.13% | 7.91% | 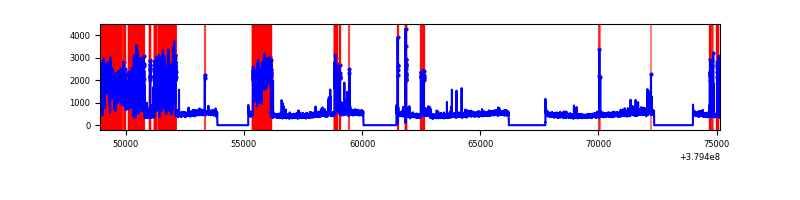 |
| B | 26226 | 20324 | 273 | 273 | 1.04% | 1.34% | 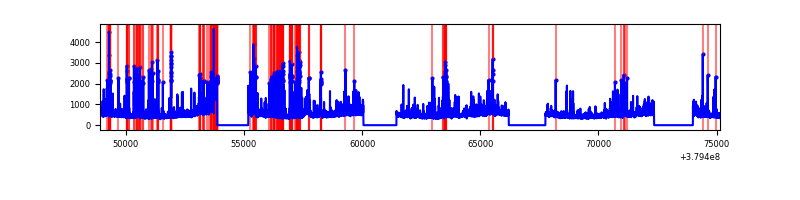 |
| C | 26226 | 20324 | 1060 | 1060 | 4.04% | 5.22% | 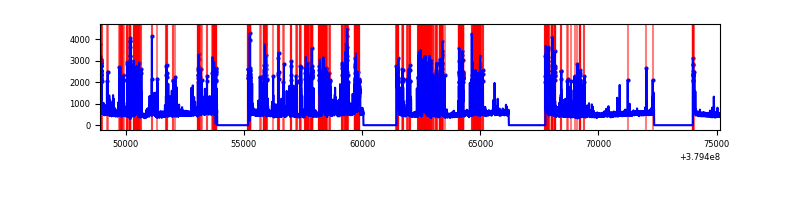 |
| D | 26226 | 20324 | 1063 | 1063 | 4.05% | 5.23% | 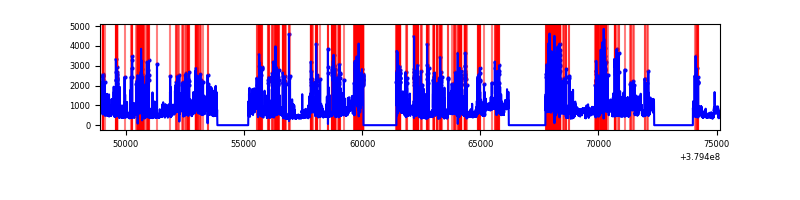 |
Top three noisy pixels from each quadrant. If the there are fewer than three noisy pixels in the level2.evt file, extra rows are filled as -1
| Pixel properties | Quadrant properties | ||||||
|---|---|---|---|---|---|---|---|
| Quadrant | DetID | PixID | Counts | Sigma | Mean | Median | Sigma |
| A | 15 | 169 | 5656826 | 12220.67 | 2313 | 2266 | 462.7 |
| A | 14 | 238 | 52803 | 109.22 | 2313 | 2266 | 462.7 |
| A | 13 | 6 | 50450 | 104.14 | 2313 | 2266 | 462.7 |
| B | 5 | 172 | 1797274 | 4020.08 | 2353 | 2293 | 446.5 |
| B | 0 | 190 | 720985 | 1609.6 | 2353 | 2293 | 446.5 |
| B | 0 | 219 | 125700 | 276.39 | 2353 | 2293 | 446.5 |
| C | 9 | 187 | 3211465 | 6236.09 | 2253 | 2273 | 514.6 |
| C | 4 | 254 | 917456 | 1778.38 | 2253 | 2273 | 514.6 |
| C | 15 | 214 | 849801 | 1646.91 | 2253 | 2273 | 514.6 |
| D | 8 | 195 | 3762555 | 6739.89 | 2258 | 2189 | 557.9 |
| D | 12 | 6 | 1397982 | 2501.75 | 2258 | 2189 | 557.9 |
| D | 13 | 249 | 827055 | 1478.45 | 2258 | 2189 | 557.9 |
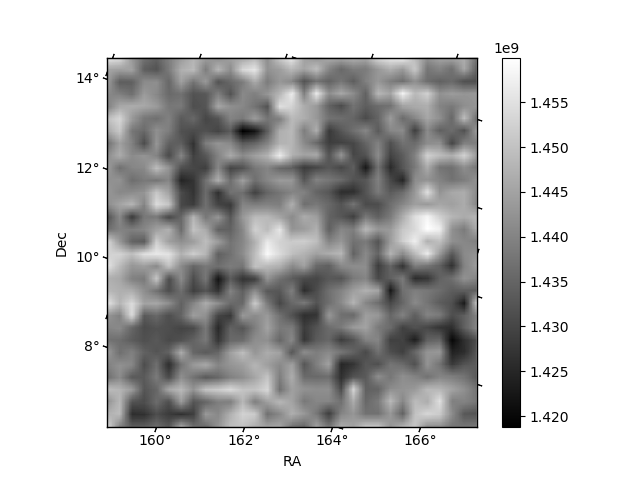
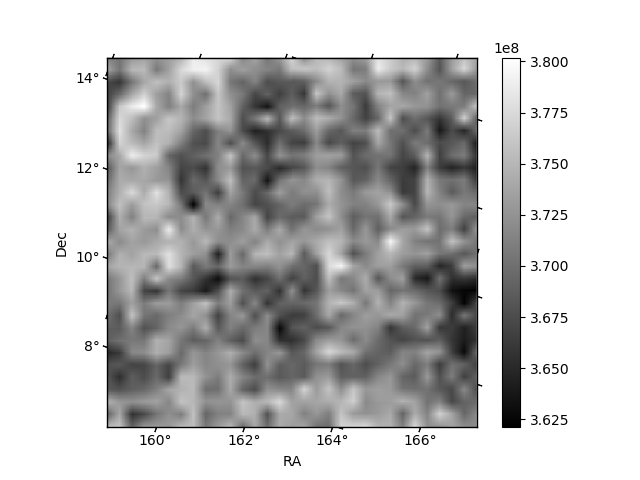
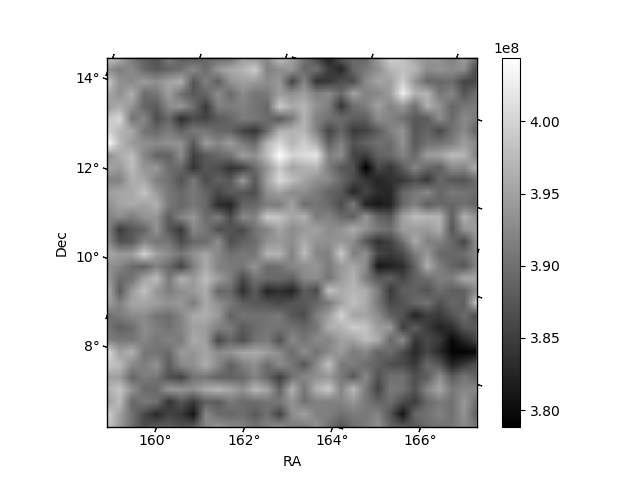
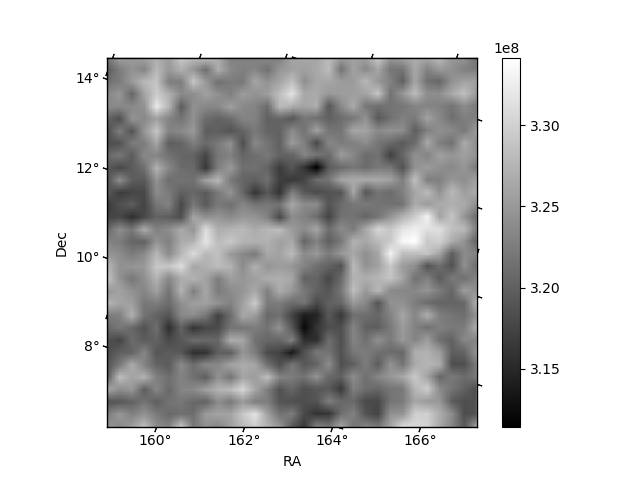
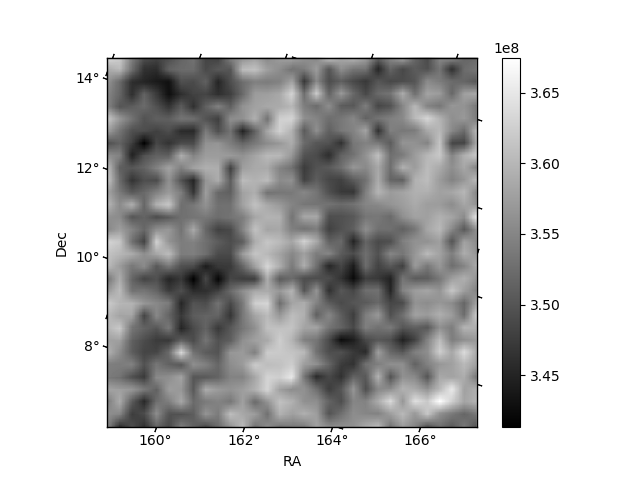
Histogram calculated using DETX and DETY for each event in the final _common_clean file
| Quadrant A | 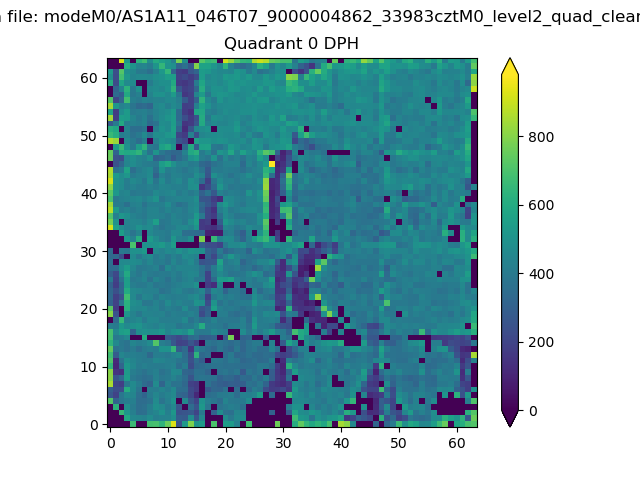 |
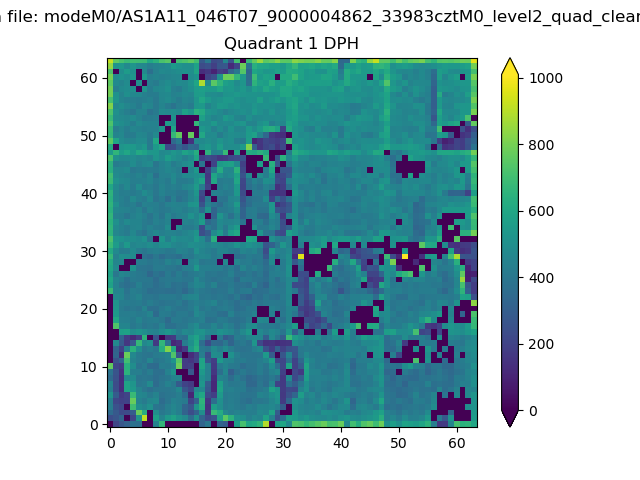 |
Quadrant B |
|---|---|---|---|
| Quadrant D |  |
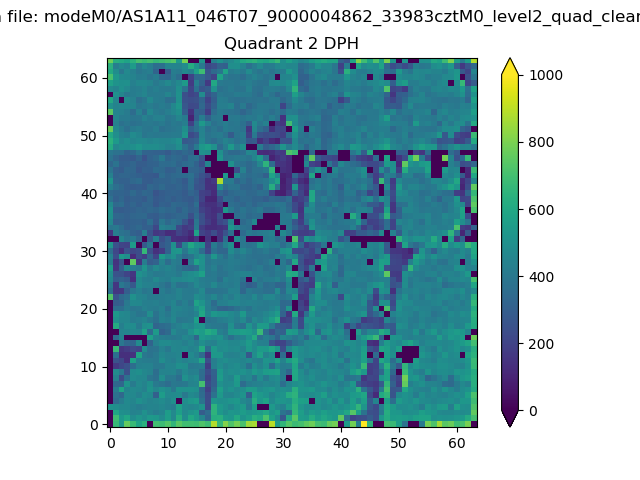 |
Quadrant C |
| Plot type | Count rate plots | Images |
|---|---|---|
| Comparison with Poisson distribution Blue bars denote a histogram of data divided into 1 sec bins. Red curve is a Poisson curve with rate = median count rate of data. |
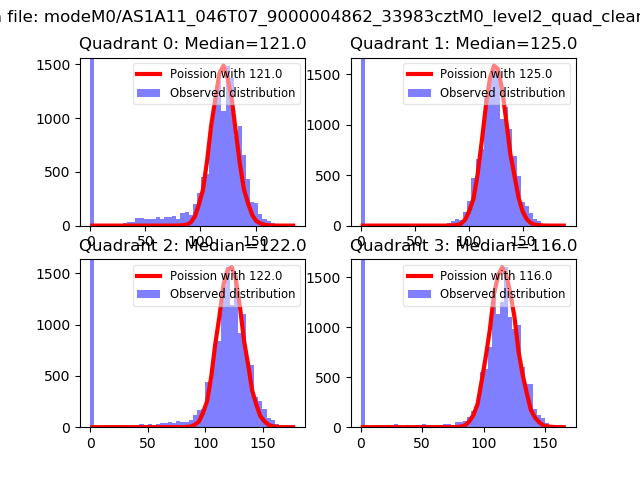 |
 |
| Quadrant-wise count rates Data is divided into 100 sec bins |
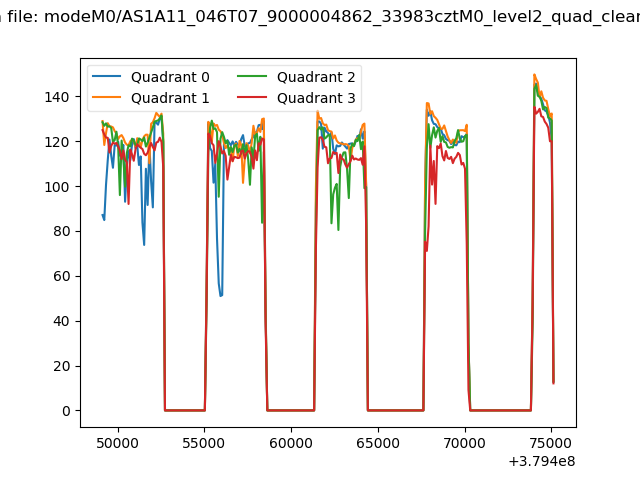 |
|
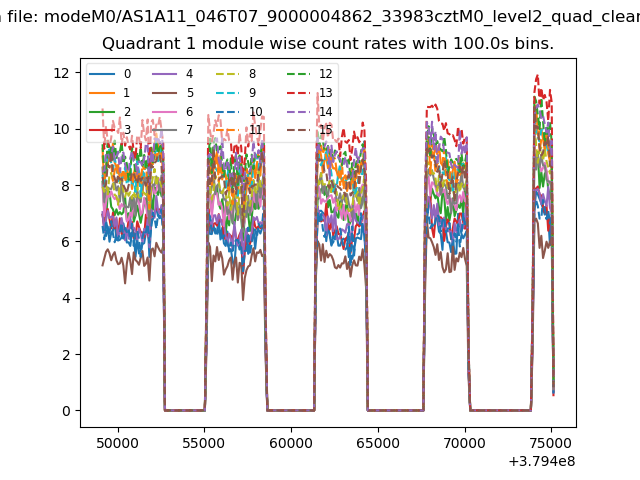
| Module-wise count rates for Quadrant A Data is divided into 100 sec bins |
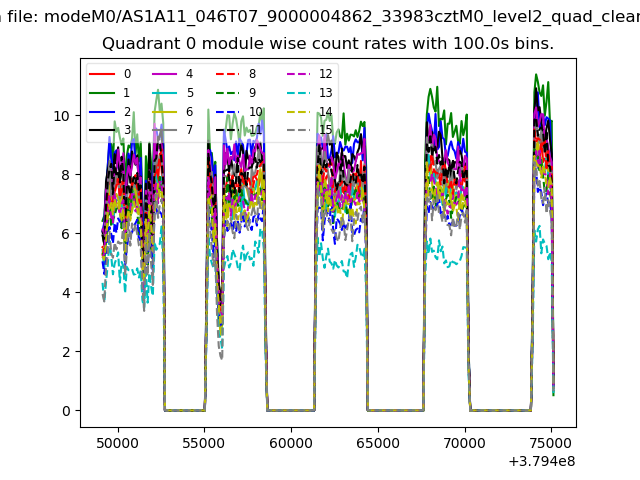 |
 |
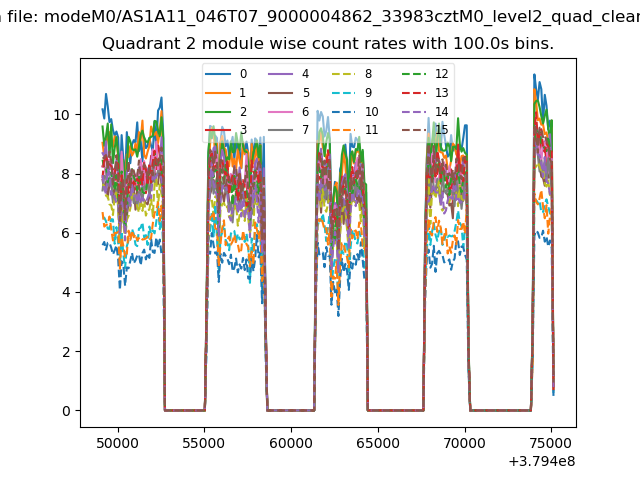
| Module-wise count rates for Quadrant B Data is divided into 100 sec bins |
 |
 |
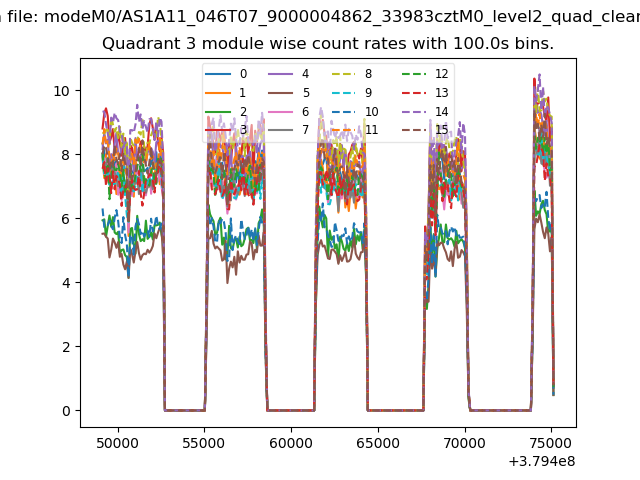
| Module-wise count rates for Quadrant C Data is divided into 100 sec bins |
 |
 |
| Module-wise count rates for Quadrant D Data is divided into 100 sec bins |
 |
 |
| Parameter | Plot |
|---|---|
| CZT HV Monitor | 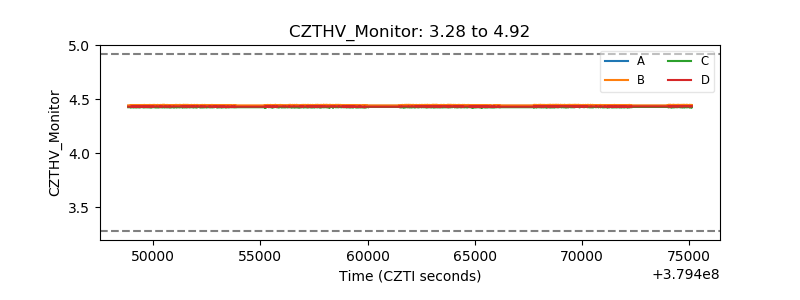 |
| D_VDD | 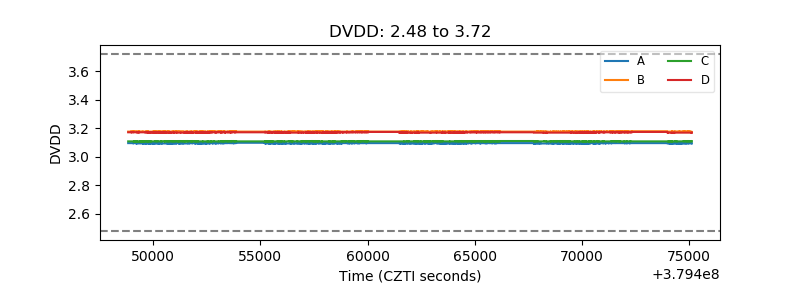 |
| Temperature 1 | 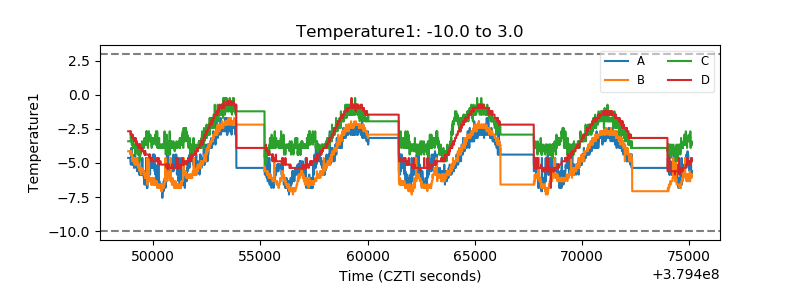 |
| Veto HV Monitor | 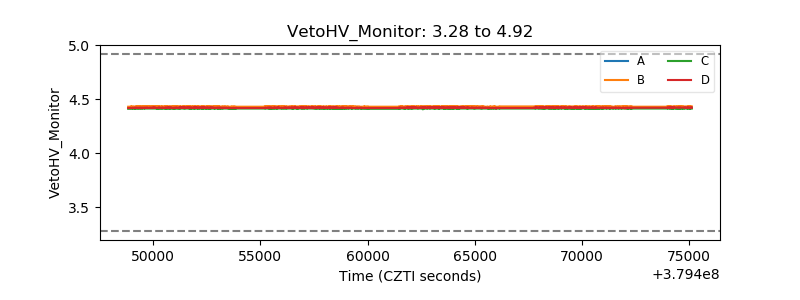 |
| Veto LLD | 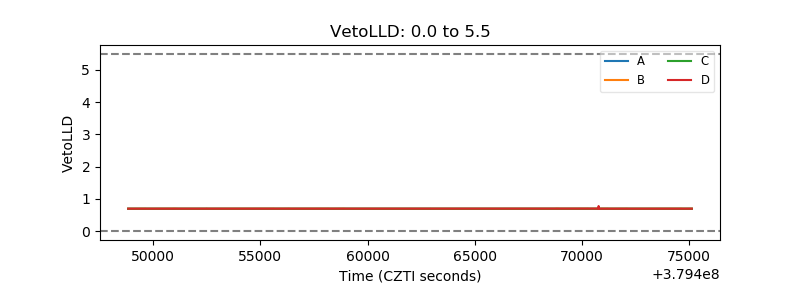 |
| Alpha Counter |  |
| _CPM_Rate | 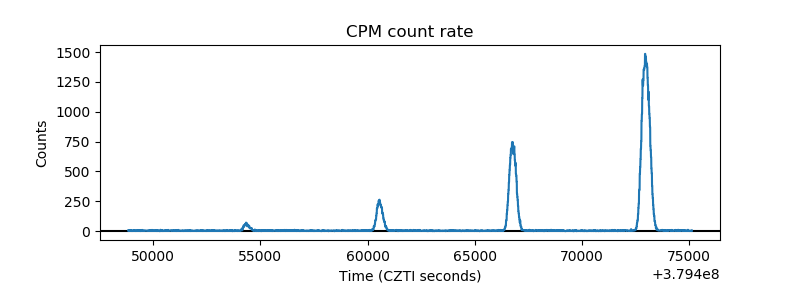 |
| CZT Counter |  |
| +2.5 Volts monitor |  |
| +5 Volts monitor |  |
| _ROLL_ROT | 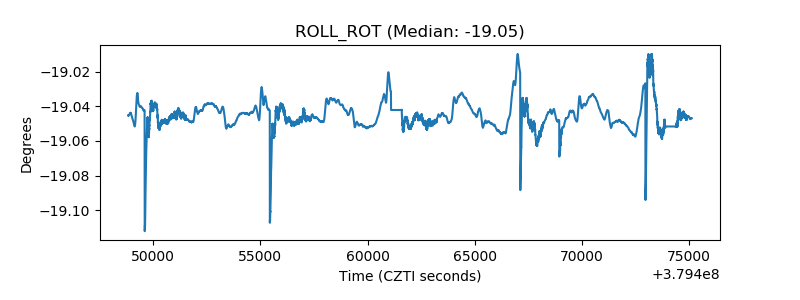 |
| _Roll_DEC | 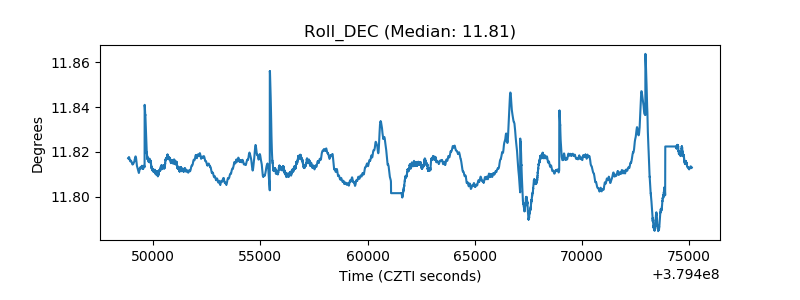 |
| _Roll_RA |  |
| Veto Counter | 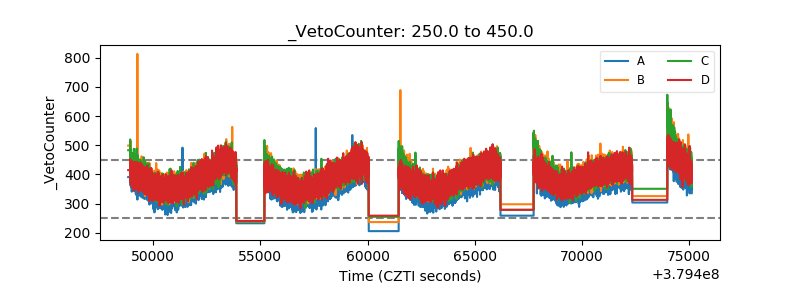 |