| Param | Original file | Final file |
|---|---|---|
| Filename | modeM0/AS1A11_046T07_9000004862_33985cztM0_level2.evt | modeM0/AS1A11_046T07_9000004862_33985cztM0_level2_quad_clean.evt |
| Size (bytes) | 464,561,280 | 72,754,560 |
| Size | 443.0 MB | 69.4 MB |
| Events in quadrant A | 2,832,585 | 458,366 |
| Events in quadrant B | 3,190,086 | 467,817 |
| Events in quadrant C | 3,117,219 | 454,883 |
| Events in quadrant D | 4,551,016 | 431,966 |
| Mode M9 | |||
|---|---|---|---|
| Quadrant | BADHDUFLAG | Total packets | Discarded packets |
| A | 0 | 31 | 0 |
| B | 0 | 31 | 0 |
| C | 0 | 31 | 0 |
| D | 0 | 32 | 0 |
| Mode M0 | |||
|---|---|---|---|
| Quadrant | BADHDUFLAG | Total packets | Discarded packets |
| A | 0 | 11767 | 3 |
| B | 0 | 13022 | 2 |
| C | 0 | 12434 | 2 |
| D | 0 | 17184 | 2 |
| Mode SS | |||
|---|---|---|---|
| Quadrant | BADHDUFLAG | Total packets | Discarded packets |
| A | 0 | 114 | 0 |
| B | 0 | 114 | 0 |
| C | 0 | 114 | 0 |
| D | 0 | 114 | 0 |
| Quadrant | Total seconds | Saturated seconds | Saturation percentage |
|---|---|---|---|
| A | 5571 | 49 | 0.879555% |
| B | 5571 | 56 | 1.005206% |
| C | 5571 | 48 | 0.861605% |
| D | 5571 | 436 | 7.826243% |
Noise dominated data is calculated using 1-second bins in cleaned event files. If a bin has >2000 counts, and if more than 50% of those come from <1% of pixels, then it is considered to be noise-dominated and hence unusable.
| Quadrant | # 1 sec bins | Bins with >0 counts | Bins with >2000 counts | High rate bins dominated by noise | Noise dominated (total time) | Noise dominated (detector-on time) | Marked lightcurve |
|---|---|---|---|---|---|---|---|
| A | 7364 | 5572 | 41 | 41 | 0.56% | 0.74% | 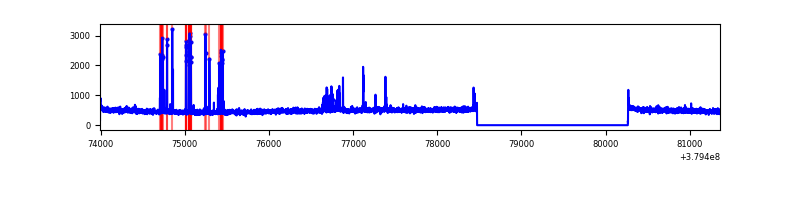 |
| B | 7364 | 5572 | 38 | 38 | 0.52% | 0.68% | 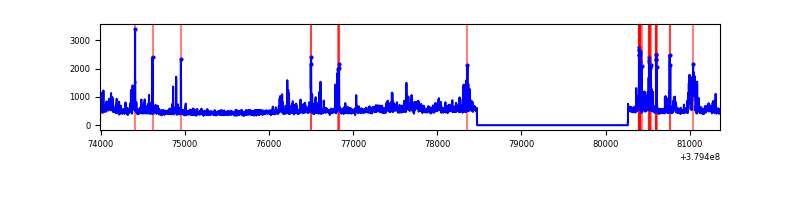 |
| C | 7364 | 5572 | 37 | 37 | 0.50% | 0.66% | 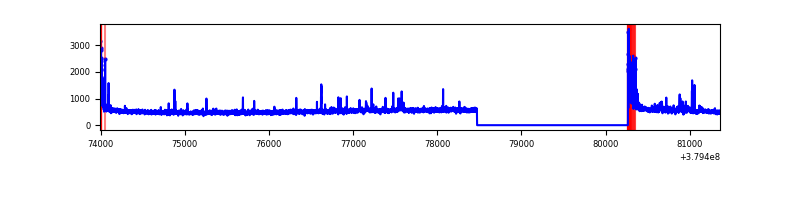 |
| D | 7364 | 5572 | 366 | 366 | 4.97% | 6.57% | 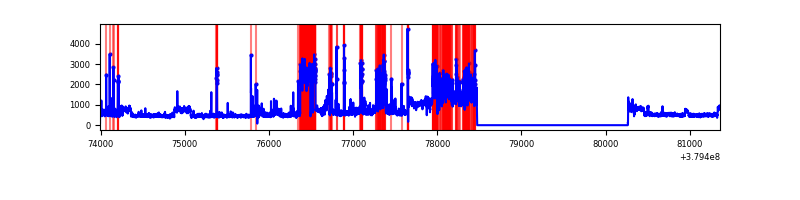 |
Top three noisy pixels from each quadrant. If the there are fewer than three noisy pixels in the level2.evt file, extra rows are filled as -1
| Pixel properties | Quadrant properties | ||||||
|---|---|---|---|---|---|---|---|
| Quadrant | DetID | PixID | Counts | Sigma | Mean | Median | Sigma |
| A | 15 | 169 | 190908 | 1409.82 | 677 | 665 | 134.9 |
| A | 10 | 83 | 16119 | 114.52 | 677 | 665 | 134.9 |
| A | 13 | 254 | 9581 | 66.07 | 677 | 665 | 134.9 |
| B | 5 | 172 | 181052 | 1415.45 | 673 | 657 | 127.4 |
| B | 4 | 200 | 117619 | 917.73 | 673 | 657 | 127.4 |
| B | 0 | 190 | 80290 | 624.83 | 673 | 657 | 127.4 |
| C | 15 | 214 | 242359 | 1609.77 | 654 | 661 | 150.1 |
| C | 0 | 10 | 190851 | 1266.71 | 654 | 661 | 150.1 |
| C | 3 | 233 | 89408 | 591.08 | 654 | 661 | 150.1 |
| D | 8 | 195 | 898888 | 5714.54 | 639 | 621 | 157.2 |
| D | 3 | 13 | 493363 | 3134.7 | 639 | 621 | 157.2 |
| D | 8 | 230 | 428028 | 2719.05 | 639 | 621 | 157.2 |
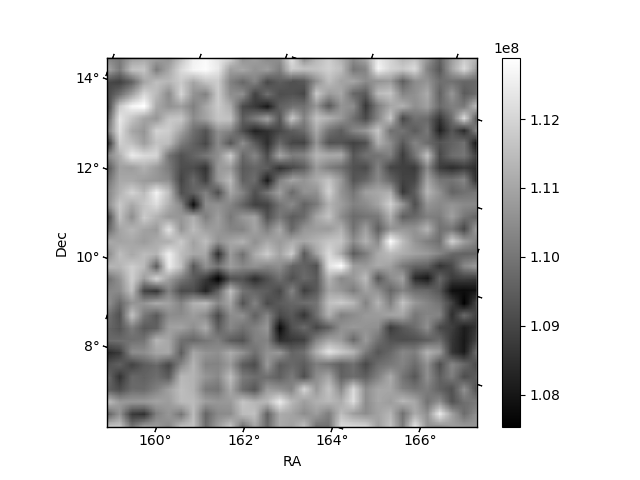
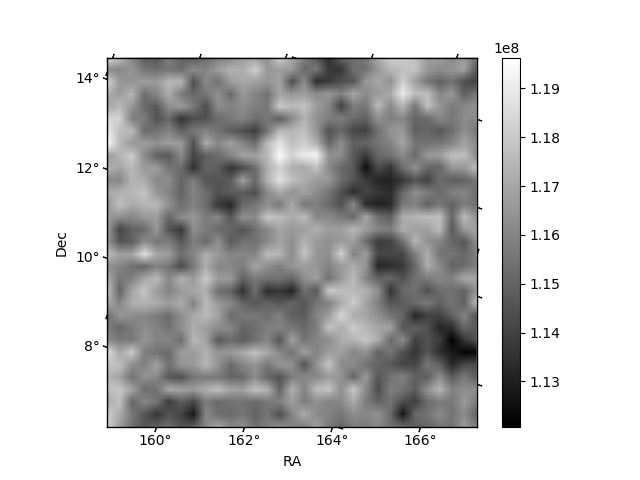
Histogram calculated using DETX and DETY for each event in the final _common_clean file
| Quadrant A | 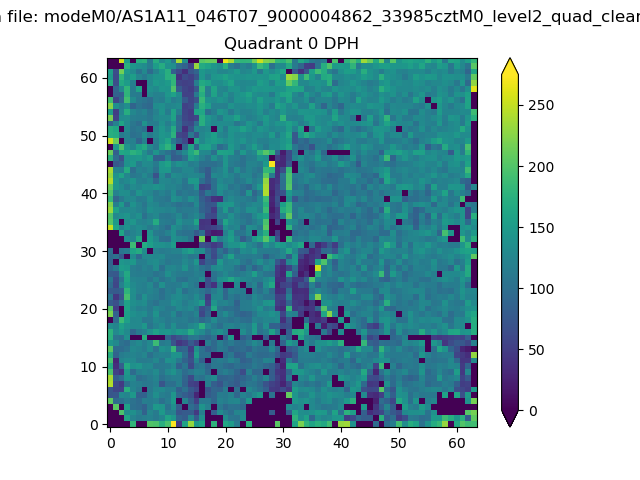 |
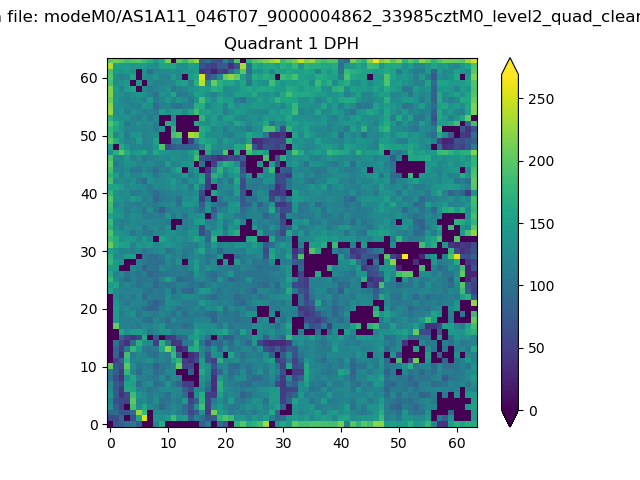 |
Quadrant B |
|---|---|---|---|
| Quadrant D | 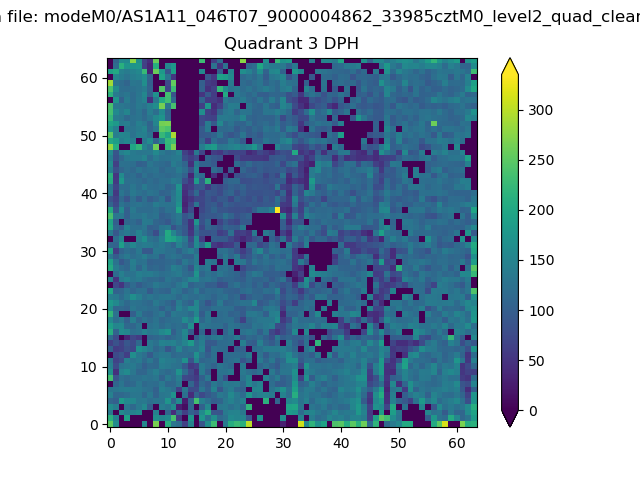 |
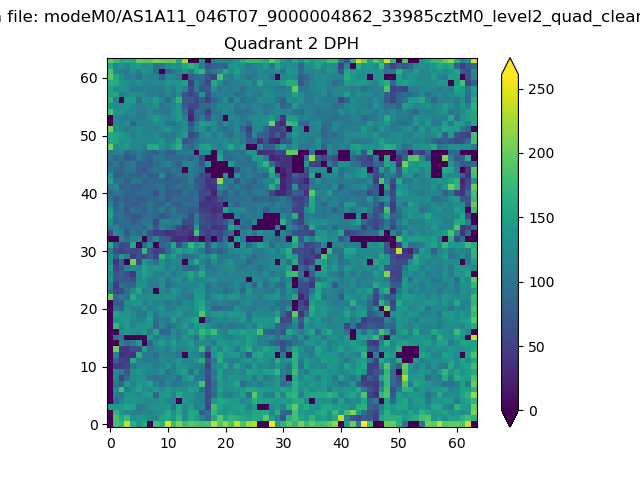 |
Quadrant C |
| Plot type | Count rate plots | Images |
|---|---|---|
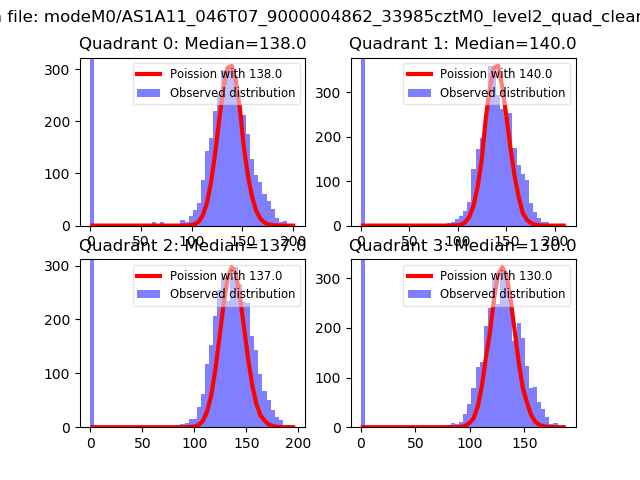
| Comparison with Poisson distribution Blue bars denote a histogram of data divided into 1 sec bins. Red curve is a Poisson curve with rate = median count rate of data. |
 |
 |
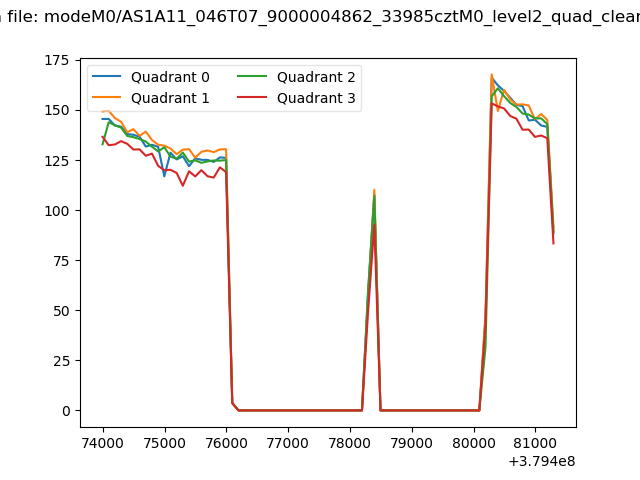
| Quadrant-wise count rates Data is divided into 100 sec bins |
 |
|
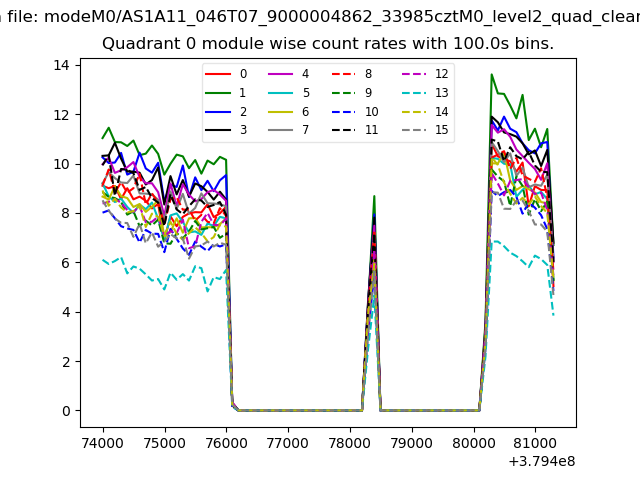
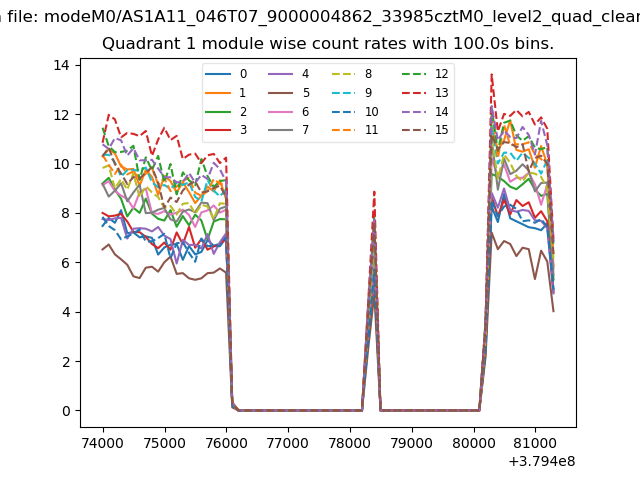
| Module-wise count rates for Quadrant A Data is divided into 100 sec bins |
 |
 |
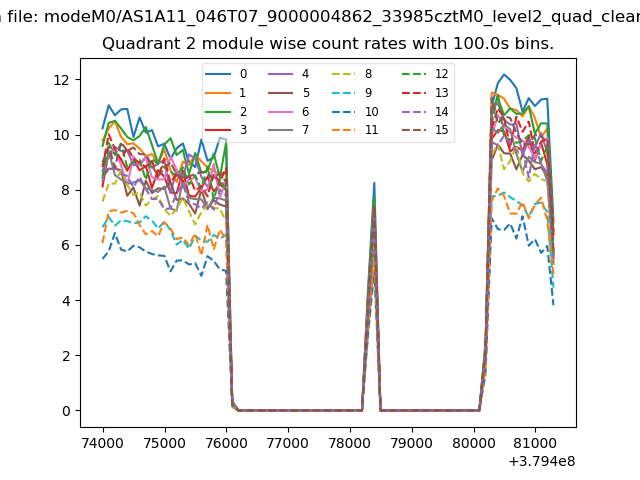
| Module-wise count rates for Quadrant B Data is divided into 100 sec bins |
 |
 |
| Module-wise count rates for Quadrant C Data is divided into 100 sec bins |
 |
 |
| Module-wise count rates for Quadrant D Data is divided into 100 sec bins |
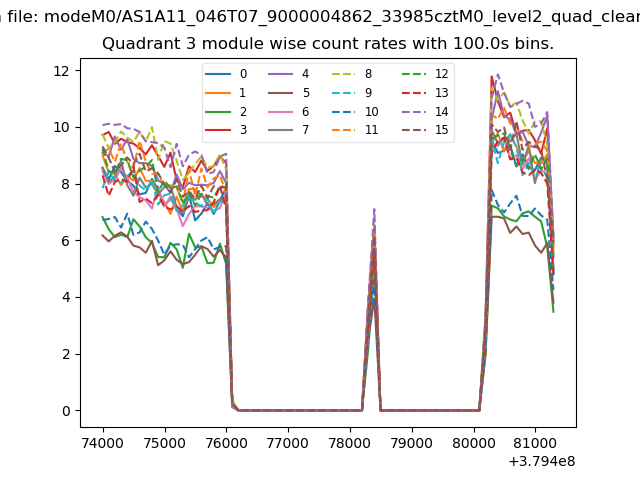 |
 |
| Parameter | Plot |
|---|---|
| CZT HV Monitor | 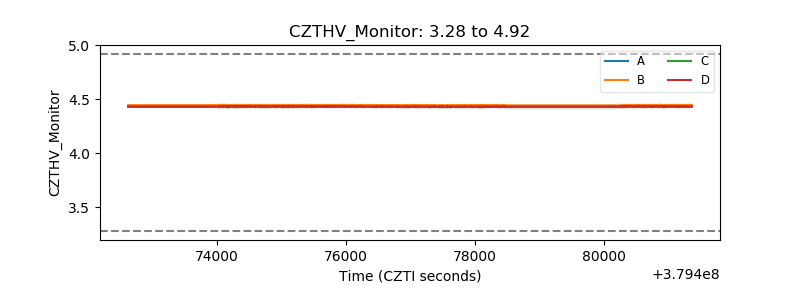 |
| D_VDD | 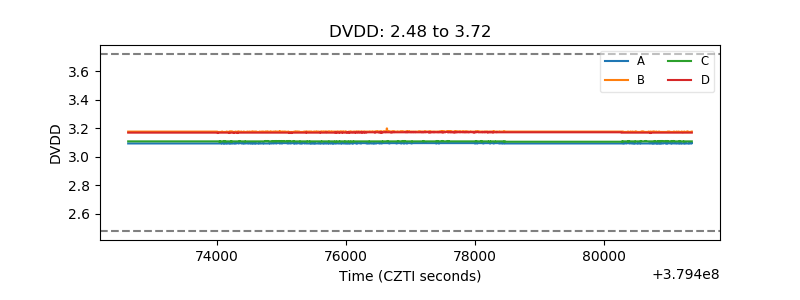 |
| Temperature 1 | 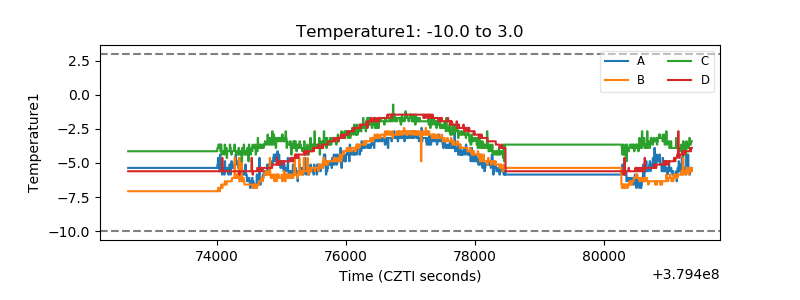 |
| Veto HV Monitor | 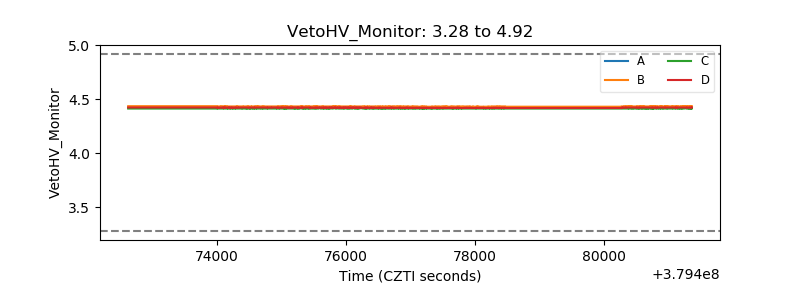 |
| Veto LLD | 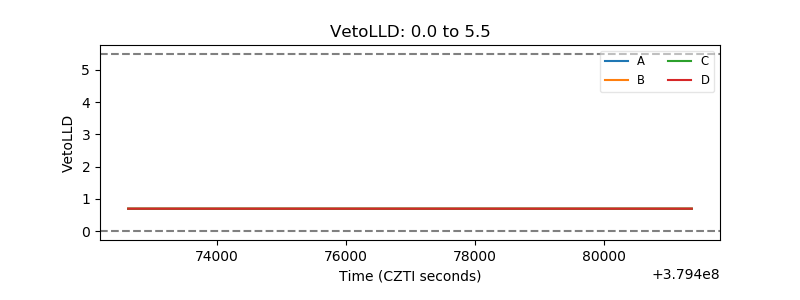 |
| Alpha Counter | 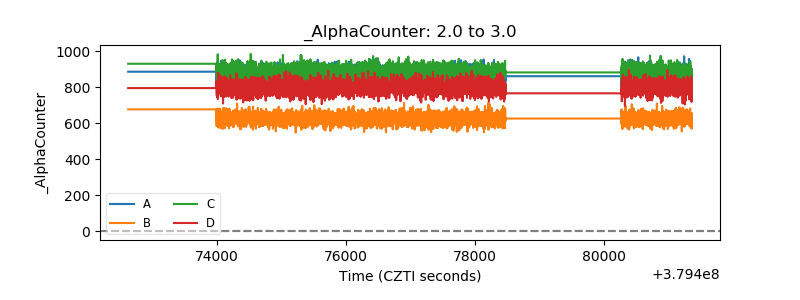 |
| _CPM_Rate | 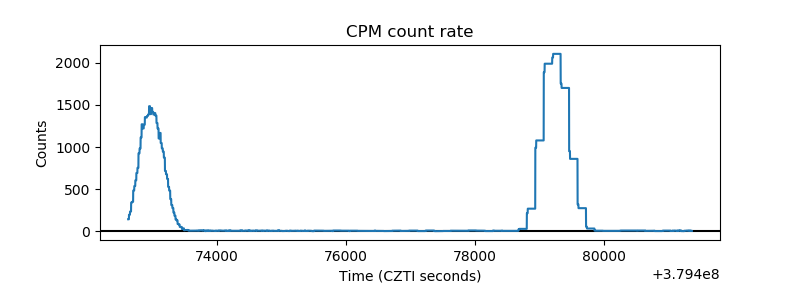 |
| CZT Counter | 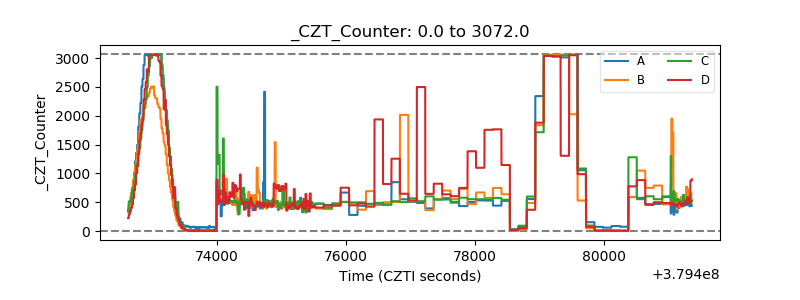 |
| +2.5 Volts monitor | 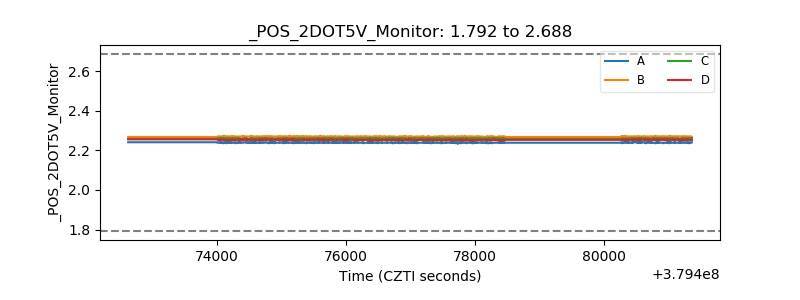 |
| +5 Volts monitor | 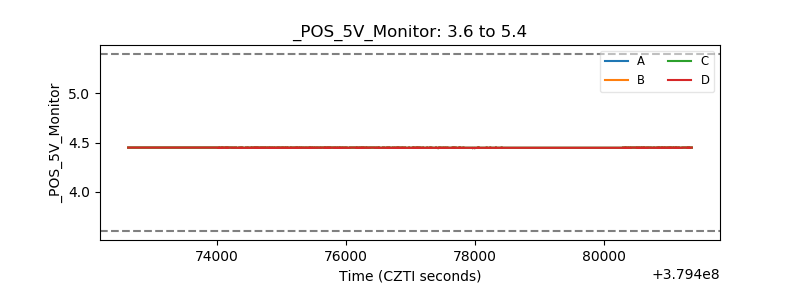 |
| _ROLL_ROT | 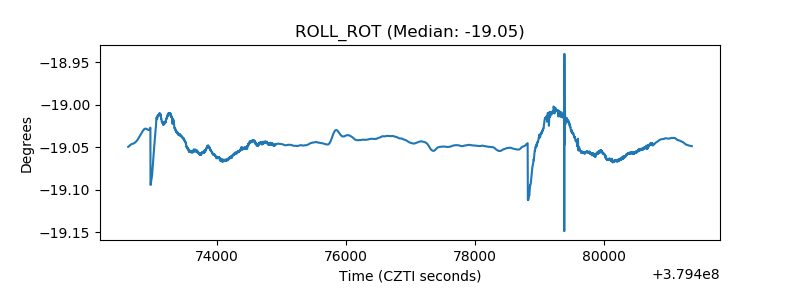 |
| _Roll_DEC |  |
| _Roll_RA | 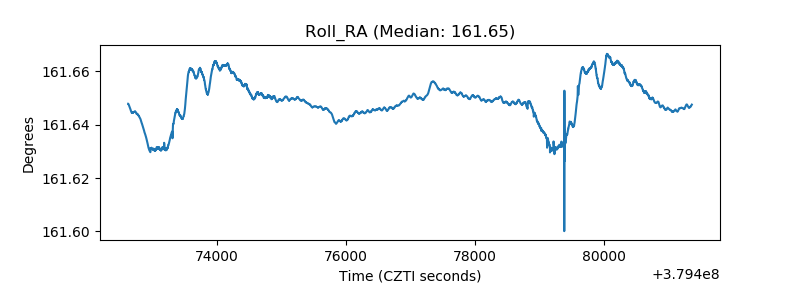 |
| Veto Counter | 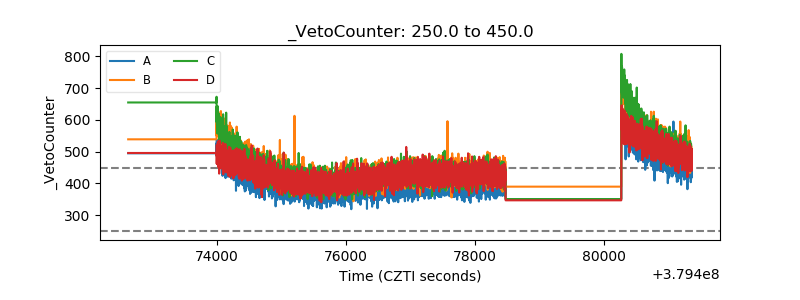 |