| Param | Original file | Final file |
|---|---|---|
| Filename | modeM0/AS1A11_046T07_9000004862_33987cztM0_level2.evt | modeM0/AS1A11_046T07_9000004862_33987cztM0_level2_quad_clean.evt |
| Size (bytes) | 484,292,160 | 70,473,600 |
| Size | 461.9 MB | 67.2 MB |
| Events in quadrant A | 3,470,226 | 448,532 |
| Events in quadrant B | 3,180,198 | 459,365 |
| Events in quadrant C | 3,215,323 | 447,461 |
| Events in quadrant D | 4,457,002 | 422,180 |
| Mode M9 | |||
|---|---|---|---|
| Quadrant | BADHDUFLAG | Total packets | Discarded packets |
| A | 0 | 27 | 0 |
| B | 0 | 27 | 0 |
| C | 0 | 27 | 0 |
| D | 0 | 28 | 0 |
| Mode M0 | |||
|---|---|---|---|
| Quadrant | BADHDUFLAG | Total packets | Discarded packets |
| A | 0 | 13458 | 3 |
| B | 0 | 12486 | 2 |
| C | 0 | 13171 | 2 |
| D | 0 | 16686 | 2 |
| Mode SS | |||
|---|---|---|---|
| Quadrant | BADHDUFLAG | Total packets | Discarded packets |
| A | 0 | 104 | 0 |
| B | 0 | 104 | 0 |
| C | 0 | 104 | 0 |
| D | 0 | 104 | 0 |
| Quadrant | Total seconds | Saturated seconds | Saturation percentage |
|---|---|---|---|
| A | 5083 | 111 | 2.183750% |
| B | 5083 | 68 | 1.337793% |
| C | 5083 | 66 | 1.298446% |
| D | 5083 | 83 | 1.632894% |
Noise dominated data is calculated using 1-second bins in cleaned event files. If a bin has >2000 counts, and if more than 50% of those come from <1% of pixels, then it is considered to be noise-dominated and hence unusable.
| Quadrant | # 1 sec bins | Bins with >0 counts | Bins with >2000 counts | High rate bins dominated by noise | Noise dominated (total time) | Noise dominated (detector-on time) | Marked lightcurve |
|---|---|---|---|---|---|---|---|
| A | 7115 | 5084 | 79 | 79 | 1.11% | 1.55% | 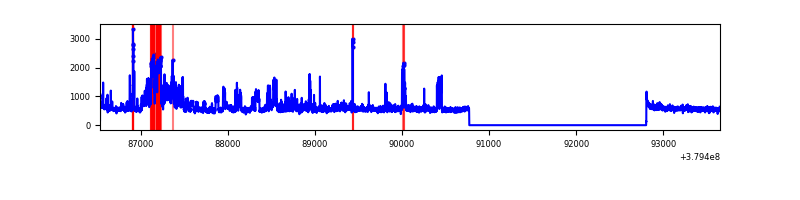 |
| B | 7115 | 5084 | 37 | 37 | 0.52% | 0.73% | 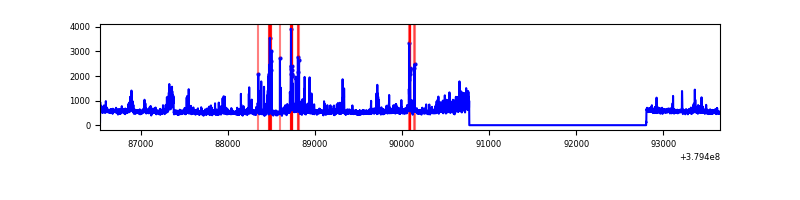 |
| C | 7115 | 5084 | 51 | 51 | 0.72% | 1.00% | 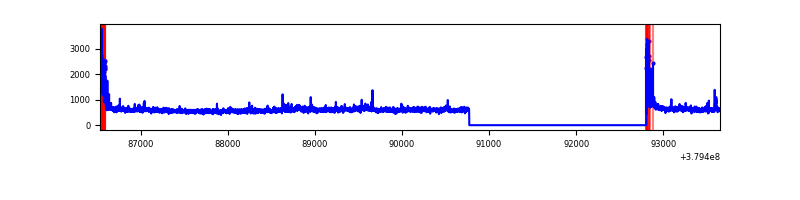 |
| D | 7115 | 5084 | 63 | 63 | 0.89% | 1.24% | 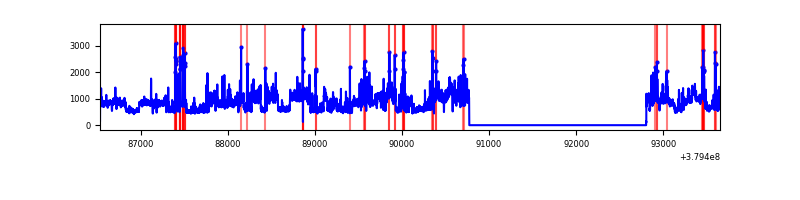 |
Top three noisy pixels from each quadrant. If the there are fewer than three noisy pixels in the level2.evt file, extra rows are filled as -1
| Pixel properties | Quadrant properties | ||||||
|---|---|---|---|---|---|---|---|
| Quadrant | DetID | PixID | Counts | Sigma | Mean | Median | Sigma |
| A | 15 | 169 | 812700 | 6039.15 | 679 | 669 | 134.5 |
| A | 10 | 83 | 15873 | 113.07 | 679 | 669 | 134.5 |
| A | 13 | 6 | 15650 | 111.42 | 679 | 669 | 134.5 |
| B | 5 | 172 | 174637 | 1375.52 | 668 | 654 | 126.5 |
| B | 0 | 190 | 120856 | 950.32 | 668 | 654 | 126.5 |
| B | 4 | 232 | 87809 | 689.05 | 668 | 654 | 126.5 |
| C | 15 | 214 | 220789 | 1469.87 | 658 | 666 | 149.8 |
| C | 0 | 10 | 210456 | 1400.87 | 658 | 666 | 149.8 |
| C | 3 | 233 | 156385 | 1039.81 | 658 | 666 | 149.8 |
| D | 8 | 195 | 1475741 | 9186.34 | 662 | 645 | 160.6 |
| D | 2 | 250 | 129259 | 800.96 | 662 | 645 | 160.6 |
| D | 12 | 6 | 65598 | 404.5 | 662 | 645 | 160.6 |
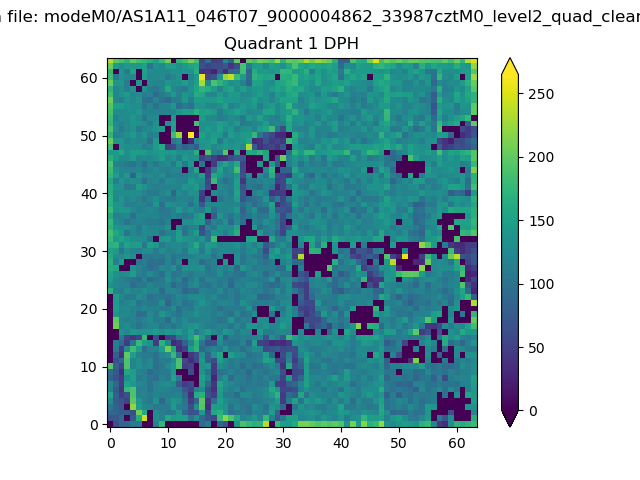
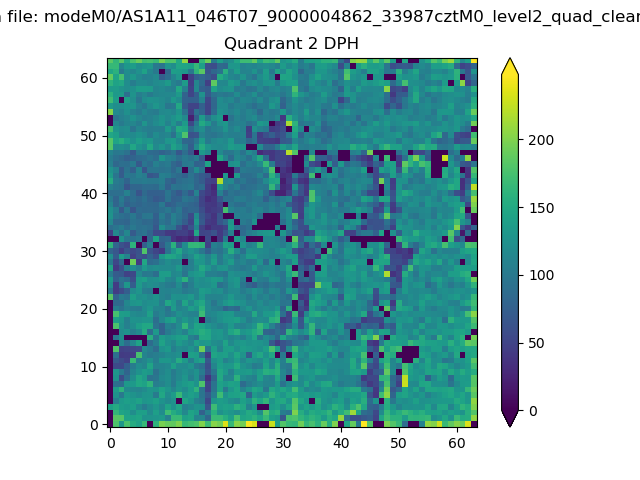
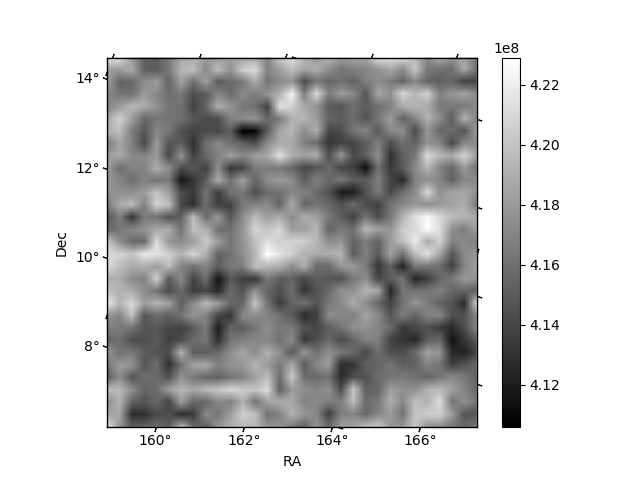
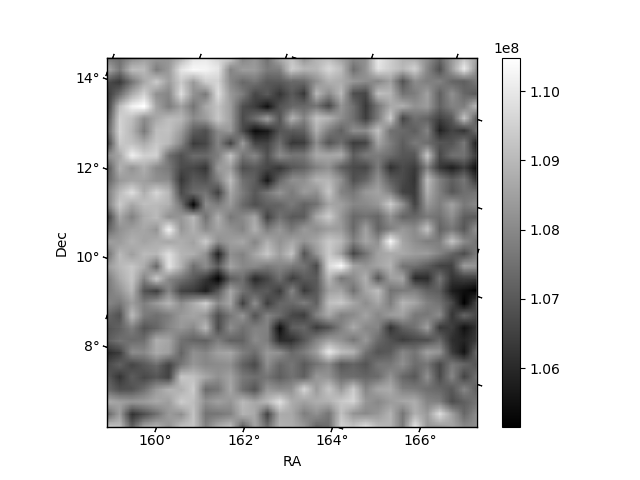
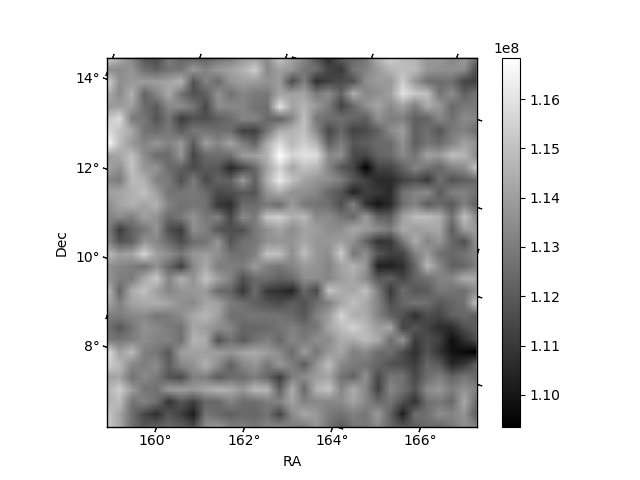
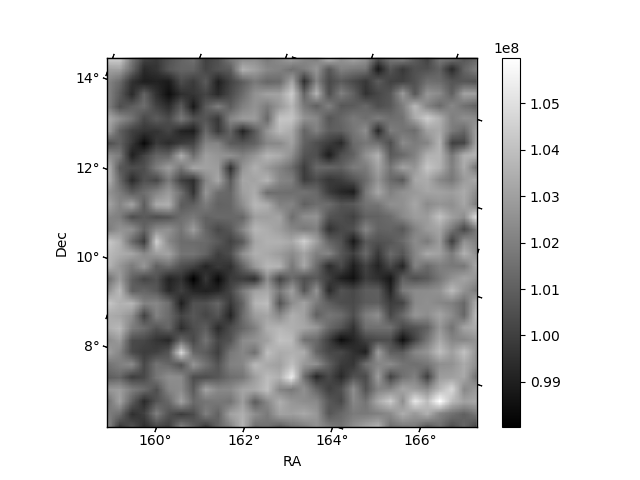
Histogram calculated using DETX and DETY for each event in the final _common_clean file
| Quadrant A |  |
 |
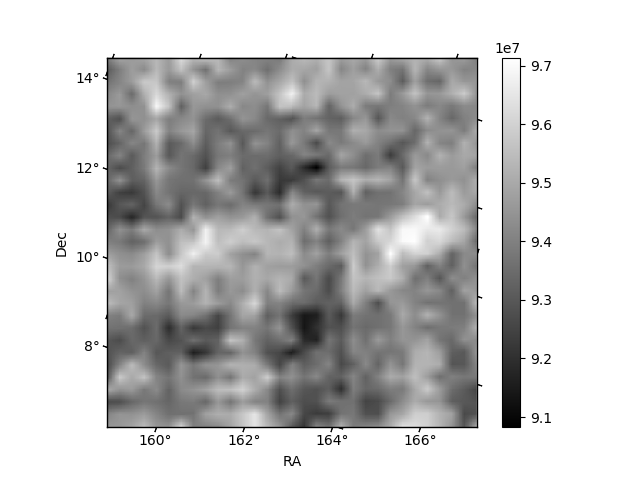
Quadrant B |
|---|---|---|---|
| Quadrant D | 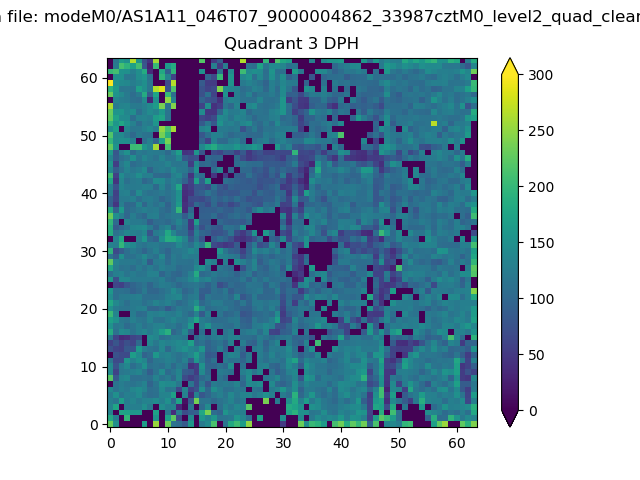 |
 |
Quadrant C |
| Plot type | Count rate plots | Images |
|---|---|---|
| Comparison with Poisson distribution Blue bars denote a histogram of data divided into 1 sec bins. Red curve is a Poisson curve with rate = median count rate of data. |
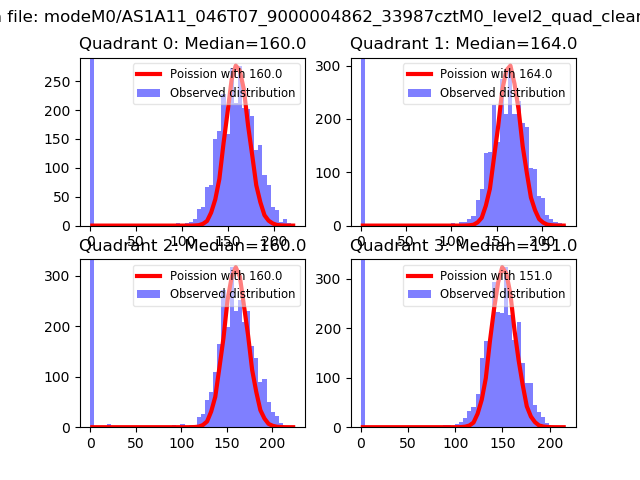 |
 |
| Quadrant-wise count rates Data is divided into 100 sec bins |
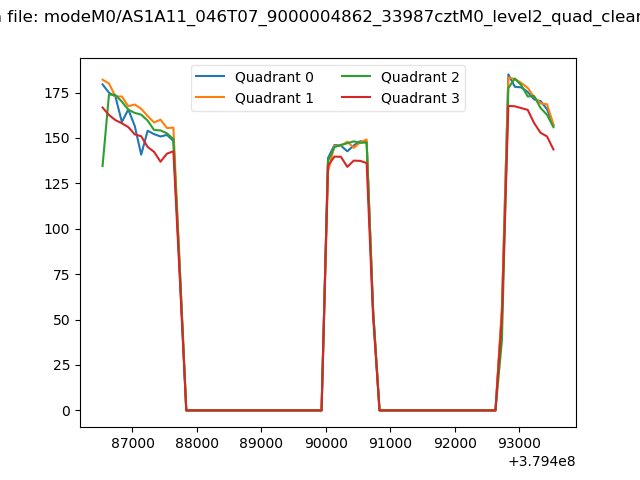 |
|
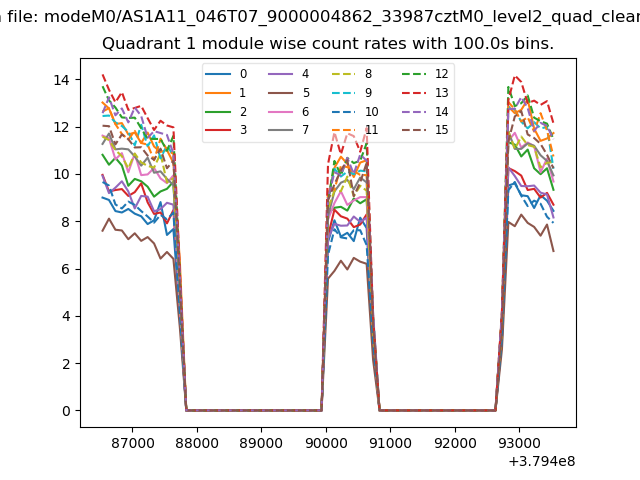
| Module-wise count rates for Quadrant A Data is divided into 100 sec bins |
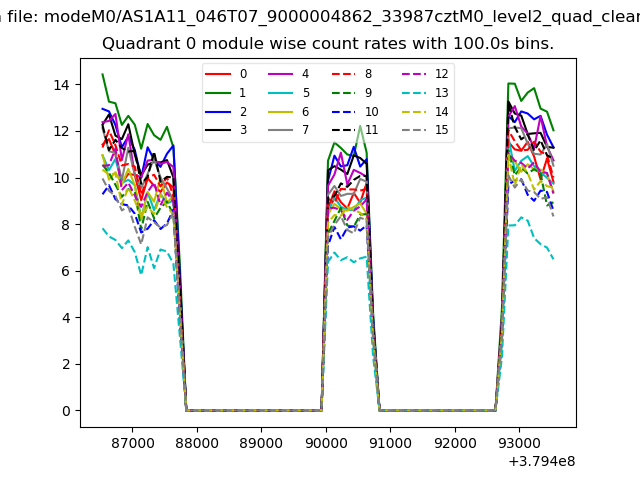 |
 |
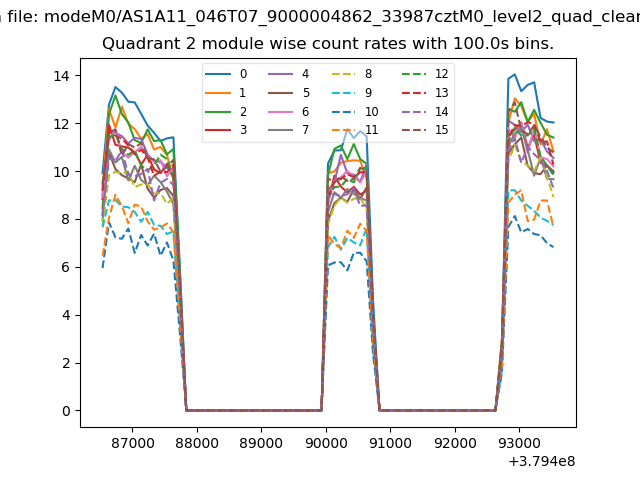
| Module-wise count rates for Quadrant B Data is divided into 100 sec bins |
 |
 |
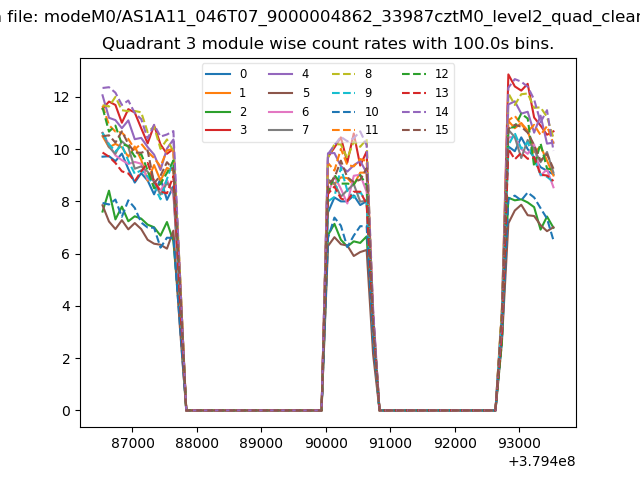
| Module-wise count rates for Quadrant C Data is divided into 100 sec bins |
 |
 |
| Module-wise count rates for Quadrant D Data is divided into 100 sec bins |
 |
 |
| Parameter | Plot |
|---|---|
| CZT HV Monitor | 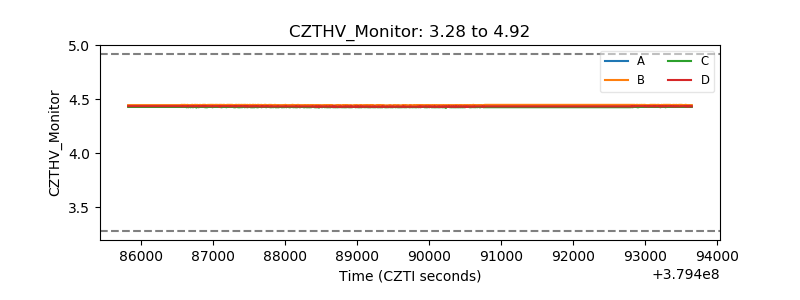 |
| D_VDD | 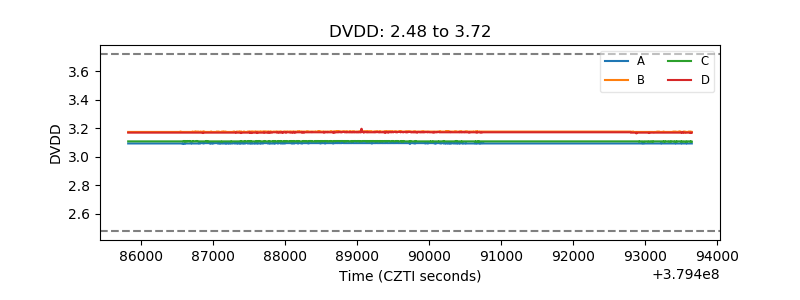 |
| Temperature 1 | 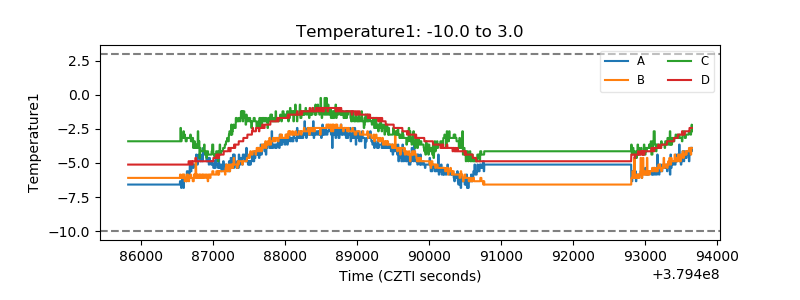 |
| Veto HV Monitor | 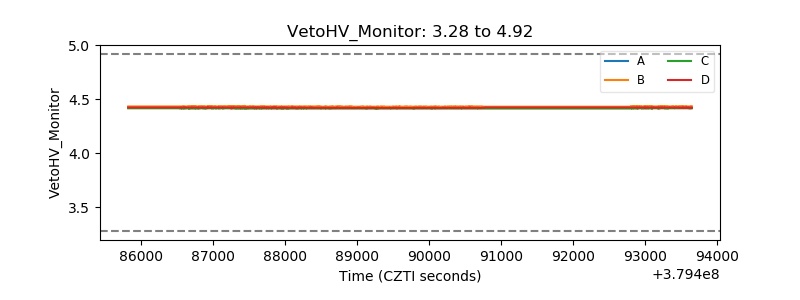 |
| Veto LLD | 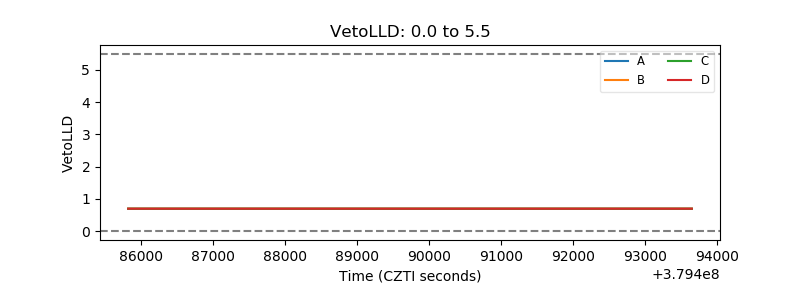 |
| Alpha Counter | 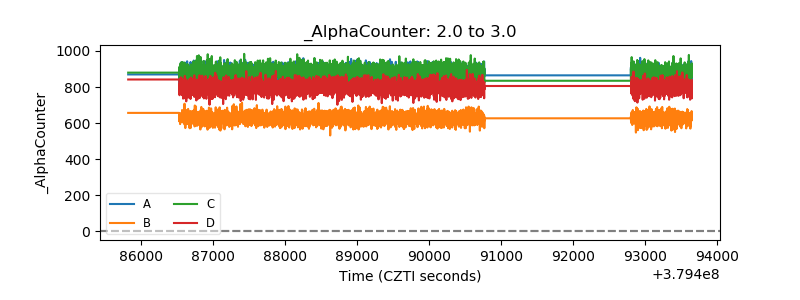 |
| _CPM_Rate | 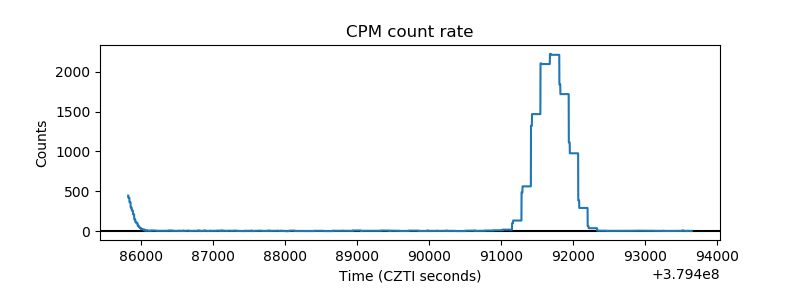 |
| CZT Counter | 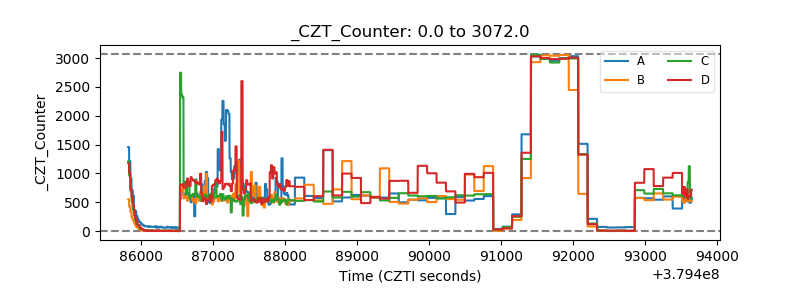 |
| +2.5 Volts monitor | 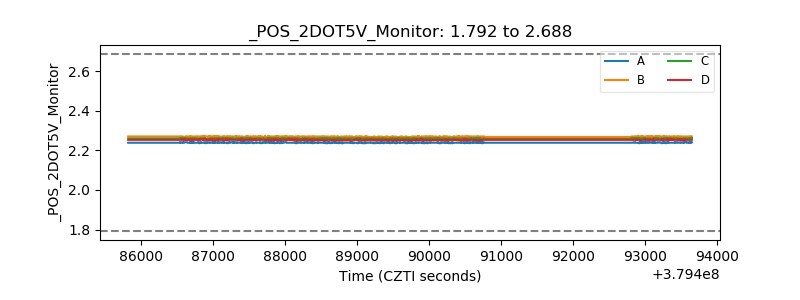 |
| +5 Volts monitor |  |
| _ROLL_ROT | 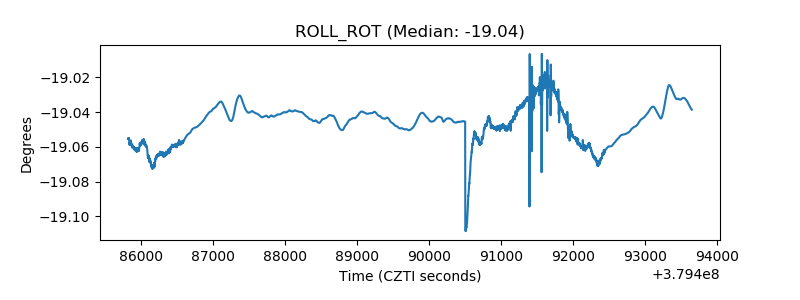 |
| _Roll_DEC | 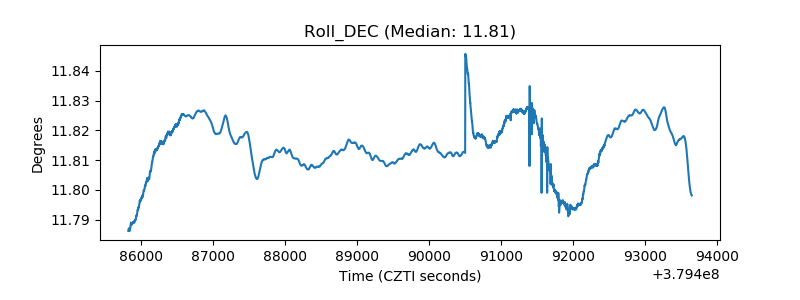 |
| _Roll_RA | 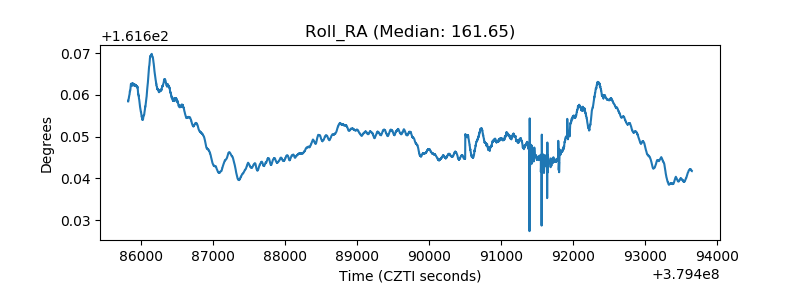 |
| Veto Counter | 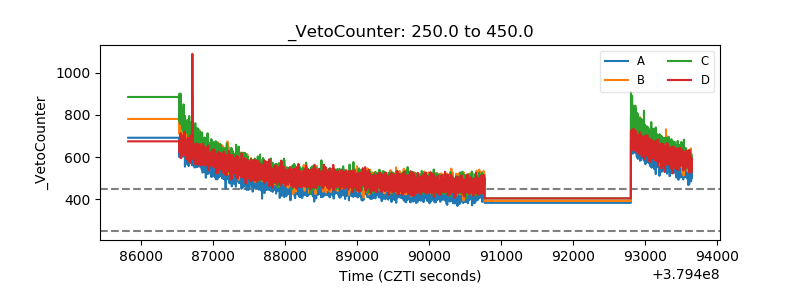 |