| Param | Original file | Final file |
|---|---|---|
| Filename | modeM0/AS1A11_046T07_9000004862_33988cztM0_level2.evt | modeM0/AS1A11_046T07_9000004862_33988cztM0_level2_quad_clean.evt |
| Size (bytes) | 651,288,960 | 56,928,960 |
| Size | 621.1 MB | 54.3 MB |
| Events in quadrant A | 2,655,442 | 375,848 |
| Events in quadrant B | 7,744,723 | 320,126 |
| Events in quadrant C | 3,150,279 | 368,996 |
| Events in quadrant D | 5,843,397 | 314,768 |
| Mode M9 | |||
|---|---|---|---|
| Quadrant | BADHDUFLAG | Total packets | Discarded packets |
| A | 0 | 30 | 0 |
| B | 0 | 30 | 0 |
| C | 0 | 30 | 0 |
| D | 0 | 31 | 0 |
| Mode M0 | |||
|---|---|---|---|
| Quadrant | BADHDUFLAG | Total packets | Discarded packets |
| A | 0 | 10444 | 3 |
| B | 0 | 26213 | 2 |
| C | 0 | 12822 | 2 |
| D | 0 | 20782 | 2 |
| Mode SS | |||
|---|---|---|---|
| Quadrant | BADHDUFLAG | Total packets | Discarded packets |
| A | 0 | 100 | 0 |
| B | 0 | 100 | 0 |
| C | 0 | 100 | 0 |
| D | 0 | 100 | 0 |
| Quadrant | Total seconds | Saturated seconds | Saturation percentage |
|---|---|---|---|
| A | 4889 | 4 | 0.081816% |
| B | 4889 | 2455 | 50.214768% |
| C | 4889 | 64 | 1.309061% |
| D | 4889 | 838 | 17.140520% |
Noise dominated data is calculated using 1-second bins in cleaned event files. If a bin has >2000 counts, and if more than 50% of those come from <1% of pixels, then it is considered to be noise-dominated and hence unusable.
| Quadrant | # 1 sec bins | Bins with >0 counts | Bins with >2000 counts | High rate bins dominated by noise | Noise dominated (total time) | Noise dominated (detector-on time) | Marked lightcurve |
|---|---|---|---|---|---|---|---|
| A | 6981 | 4890 | 0 | 0 | 0.00% | 0.00% | 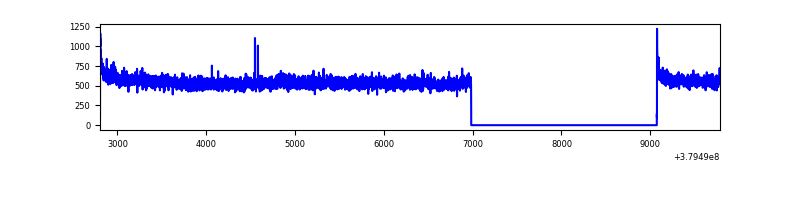 |
| B | 6981 | 4890 | 2179 | 2179 | 31.21% | 44.56% | 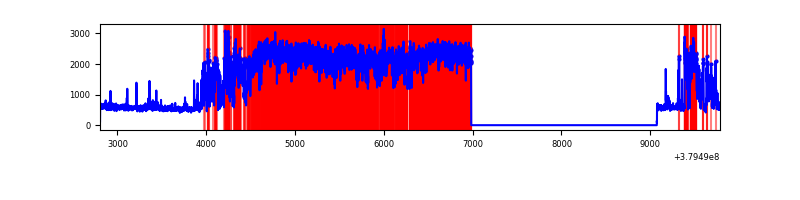 |
| C | 6981 | 4890 | 44 | 44 | 0.63% | 0.90% | 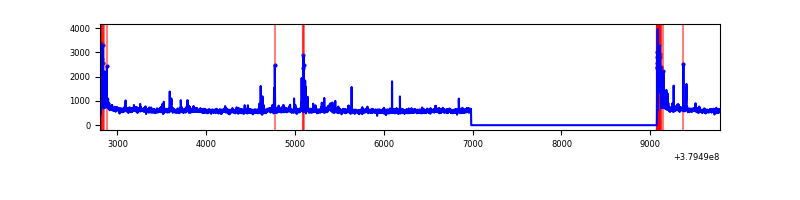 |
| D | 6981 | 4890 | 778 | 778 | 11.14% | 15.91% | 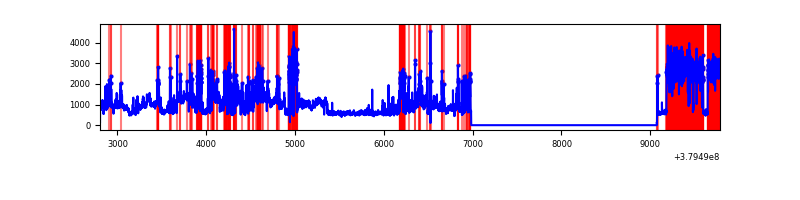 |
Top three noisy pixels from each quadrant. If the there are fewer than three noisy pixels in the level2.evt file, extra rows are filled as -1
| Pixel properties | Quadrant properties | ||||||
|---|---|---|---|---|---|---|---|
| Quadrant | DetID | PixID | Counts | Sigma | Mean | Median | Sigma |
| A | 15 | 169 | 62044 | 465.08 | 665 | 656 | 132.0 |
| A | 10 | 83 | 15413 | 111.8 | 665 | 656 | 132.0 |
| A | 13 | 254 | 8807 | 61.75 | 665 | 656 | 132.0 |
| B | 5 | 14 | 1644027 | 15750.0 | 553 | 541 | 104.3 |
| B | 5 | 31 | 1629830 | 15613.95 | 553 | 541 | 104.3 |
| B | 5 | 15 | 1626105 | 15578.25 | 553 | 541 | 104.3 |
| C | 15 | 214 | 211662 | 1438.47 | 641 | 648 | 146.7 |
| C | 0 | 10 | 208057 | 1413.89 | 641 | 648 | 146.7 |
| C | 3 | 233 | 190315 | 1292.95 | 641 | 648 | 146.7 |
| D | 8 | 195 | 1208269 | 7638.96 | 582 | 573 | 158.1 |
| D | 8 | 230 | 1159740 | 7332.0 | 582 | 573 | 158.1 |
| D | 12 | 233 | 377063 | 2381.39 | 582 | 573 | 158.1 |
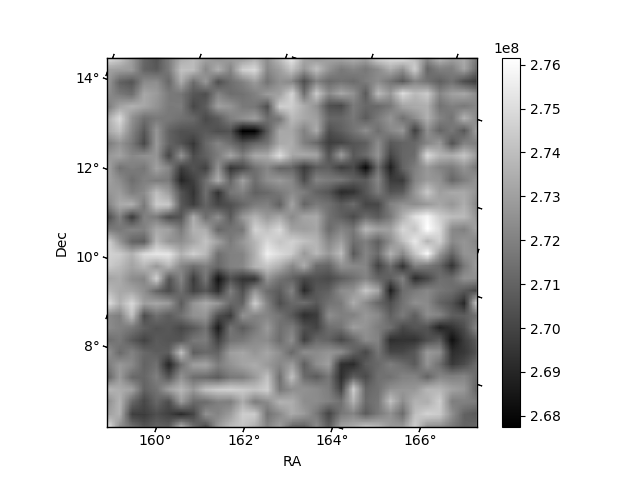
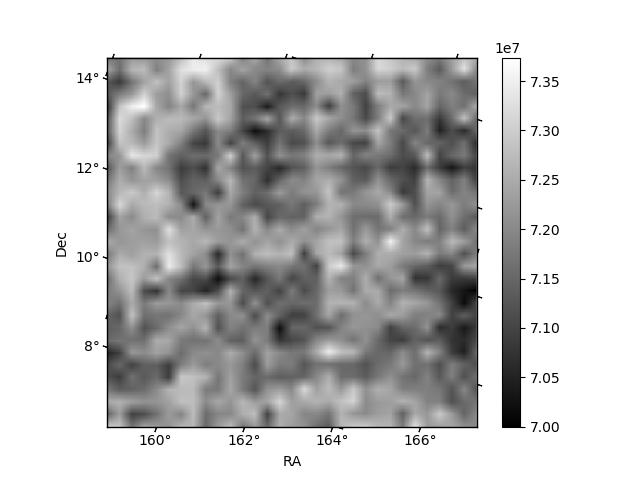
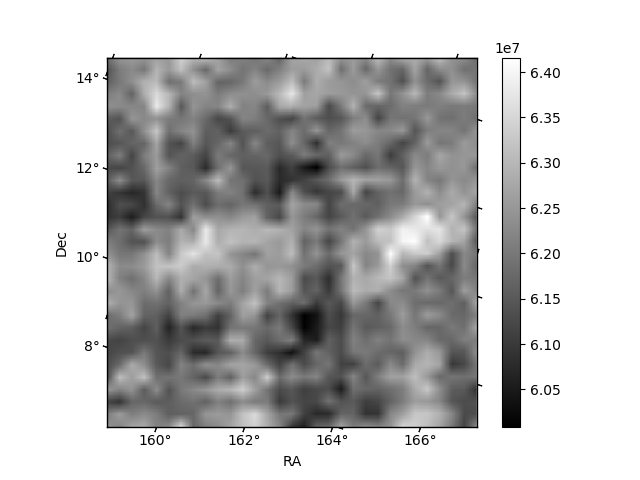
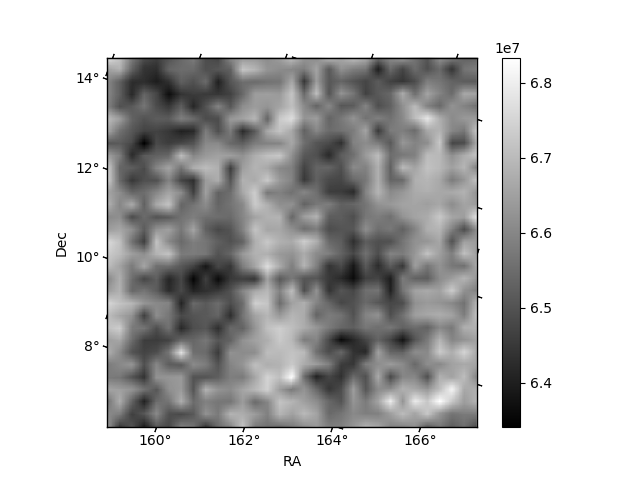
Histogram calculated using DETX and DETY for each event in the final _common_clean file
| Quadrant A | 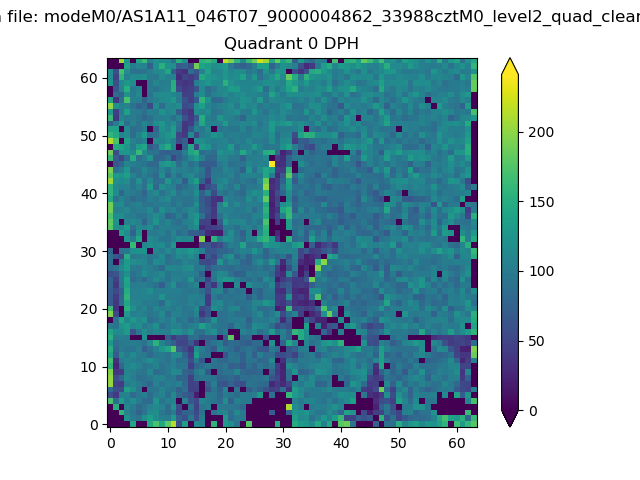 |
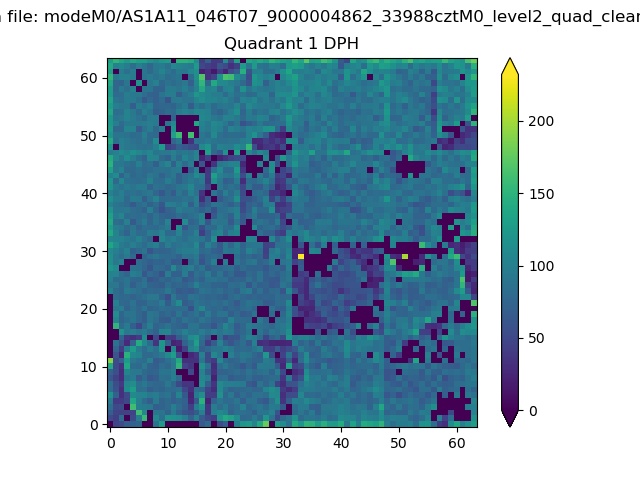 |
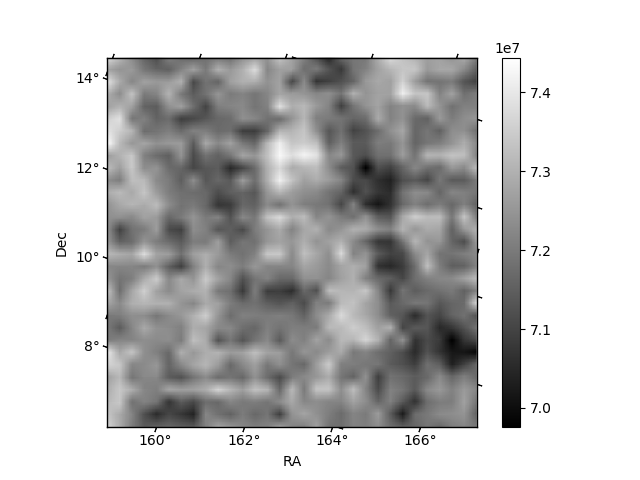
Quadrant B |
|---|---|---|---|
| Quadrant D | 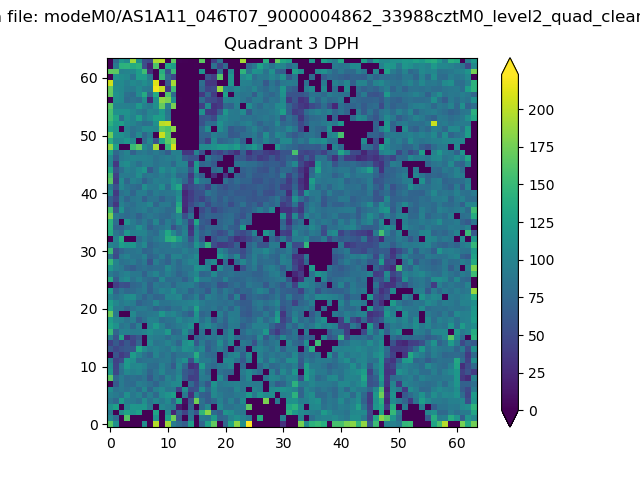 |
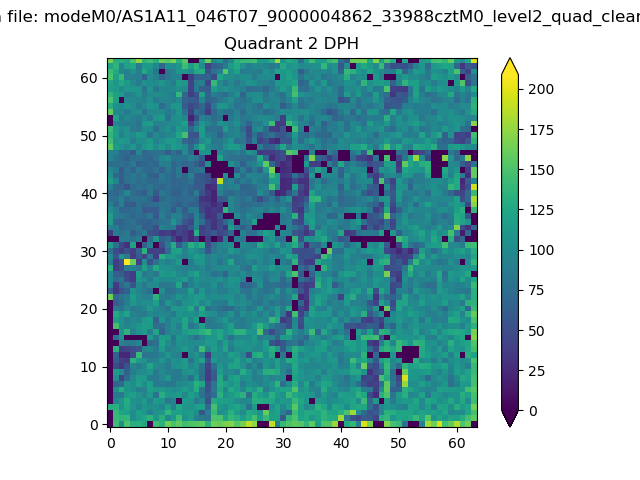 |
Quadrant C |
| Plot type | Count rate plots | Images |
|---|---|---|
| Comparison with Poisson distribution Blue bars denote a histogram of data divided into 1 sec bins. Red curve is a Poisson curve with rate = median count rate of data. |
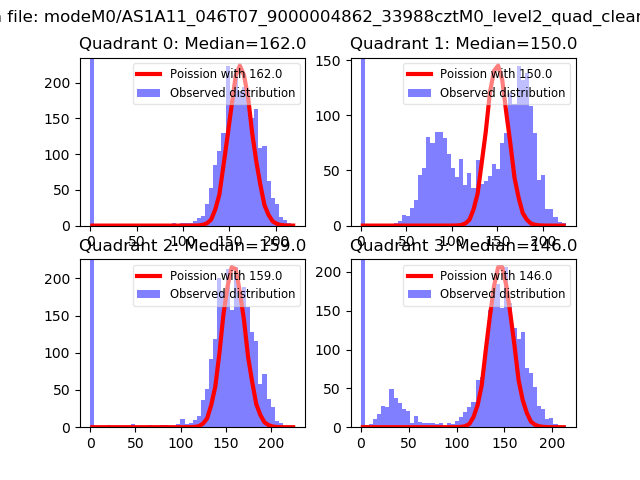 |
 |
| Quadrant-wise count rates Data is divided into 100 sec bins |
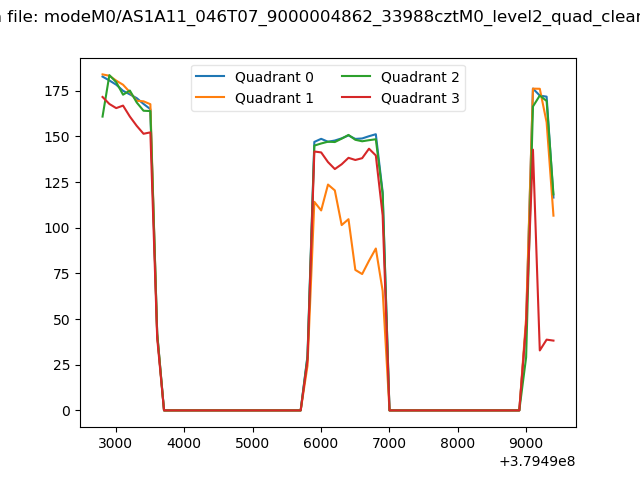 |
|
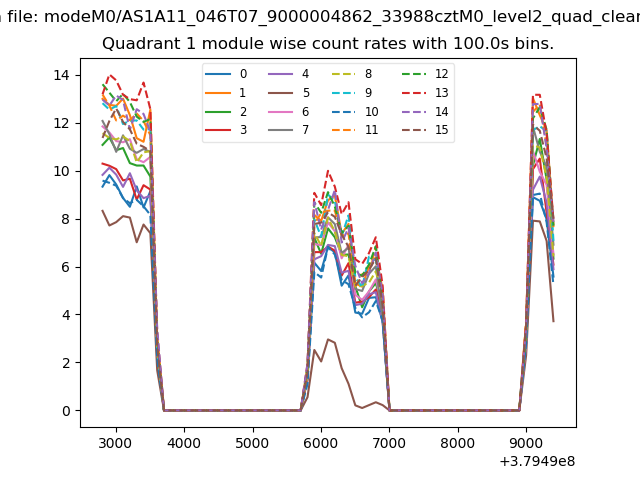
| Module-wise count rates for Quadrant A Data is divided into 100 sec bins |
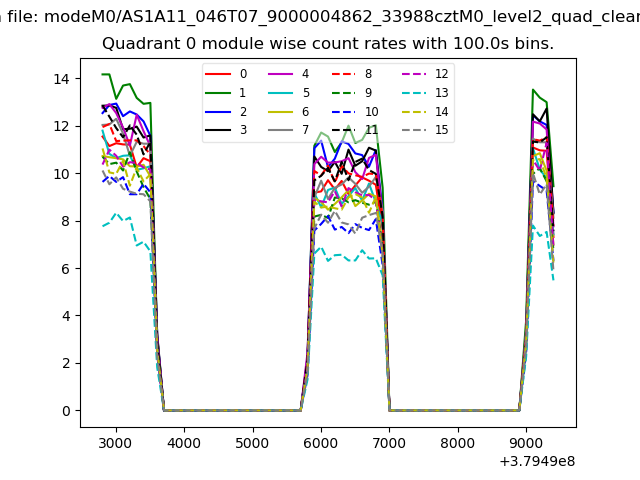 |
 |
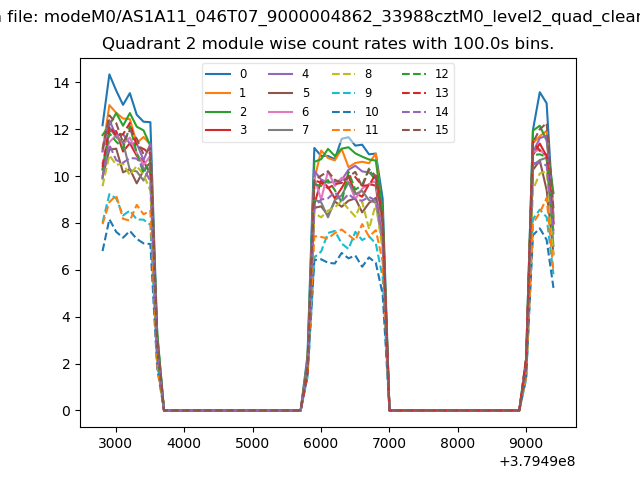
| Module-wise count rates for Quadrant B Data is divided into 100 sec bins |
 |
 |
| Module-wise count rates for Quadrant C Data is divided into 100 sec bins |
 |
 |
| Module-wise count rates for Quadrant D Data is divided into 100 sec bins |
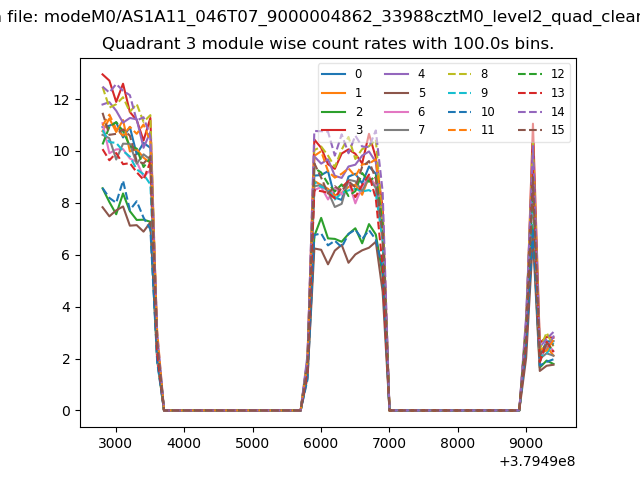 |
 |
| Parameter | Plot |
|---|---|
| CZT HV Monitor | 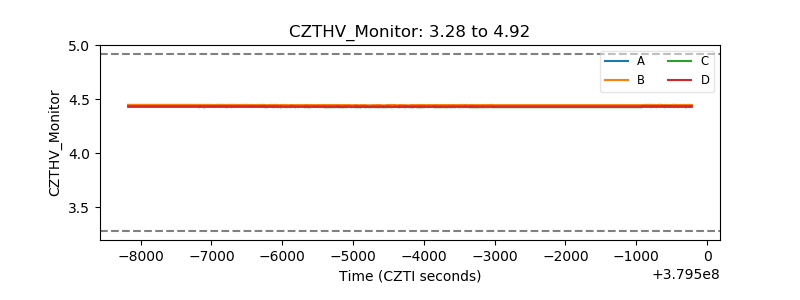 |
| D_VDD | 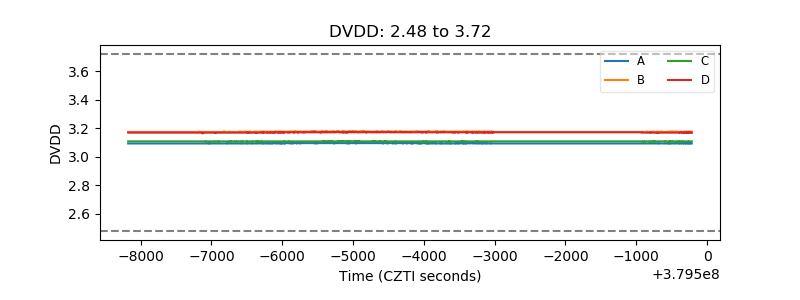 |
| Temperature 1 | 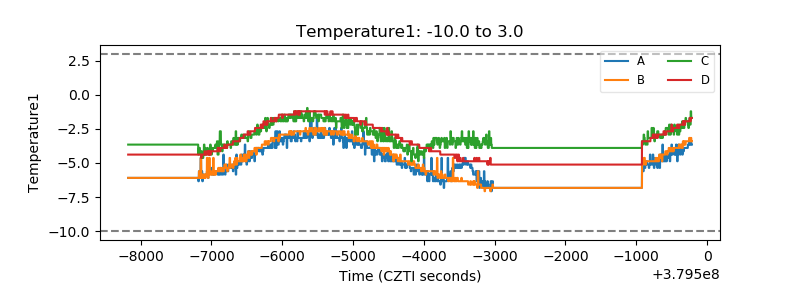 |
| Veto HV Monitor |  |
| Veto LLD | 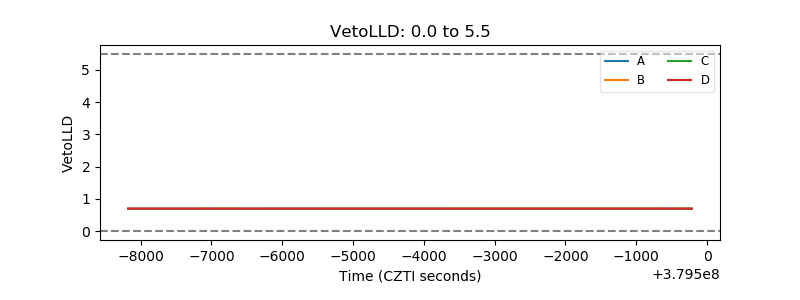 |
| Alpha Counter | 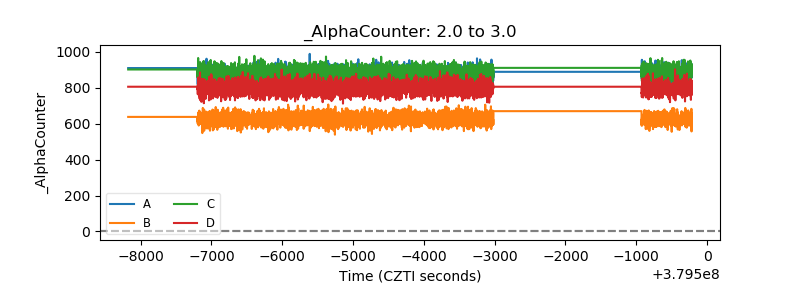 |
| _CPM_Rate | 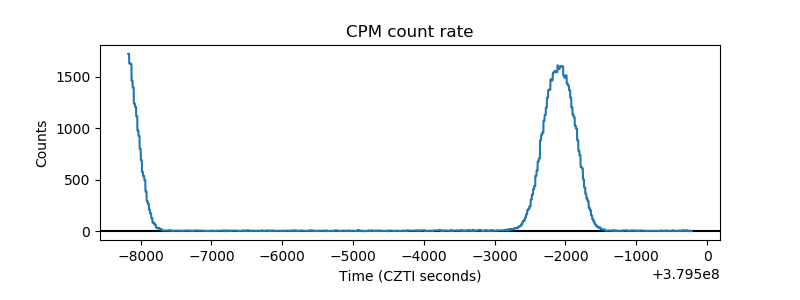 |
| CZT Counter | 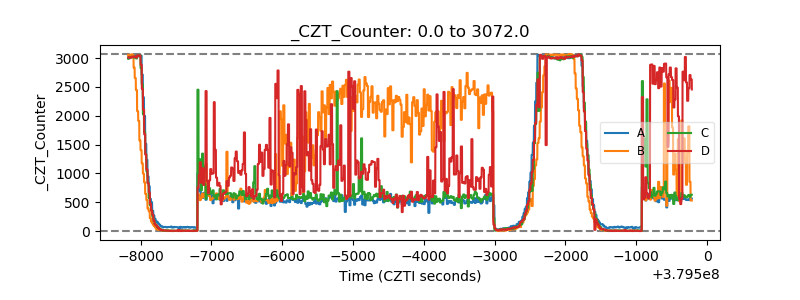 |
| +2.5 Volts monitor |  |
| +5 Volts monitor | 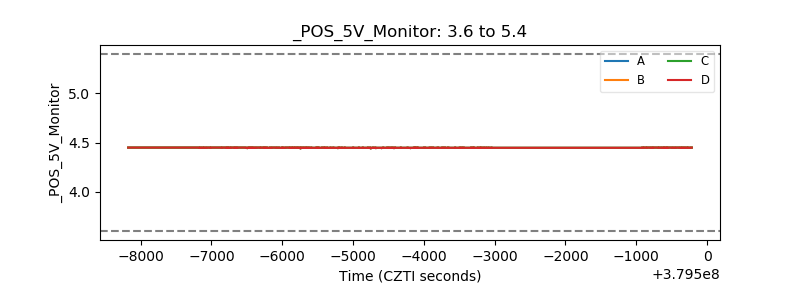 |
| _ROLL_ROT | 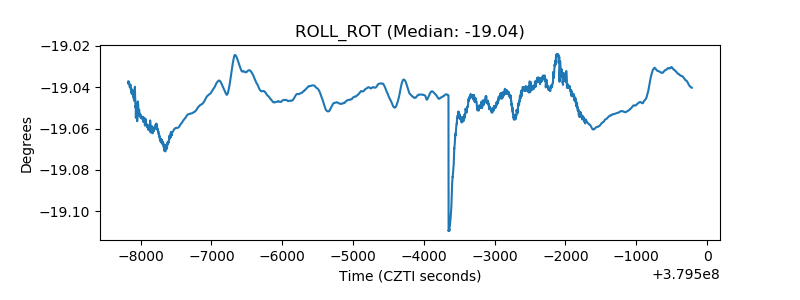 |
| _Roll_DEC |  |
| _Roll_RA | 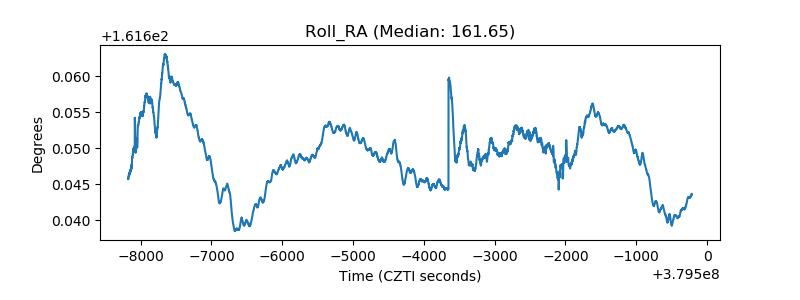 |
| Veto Counter | 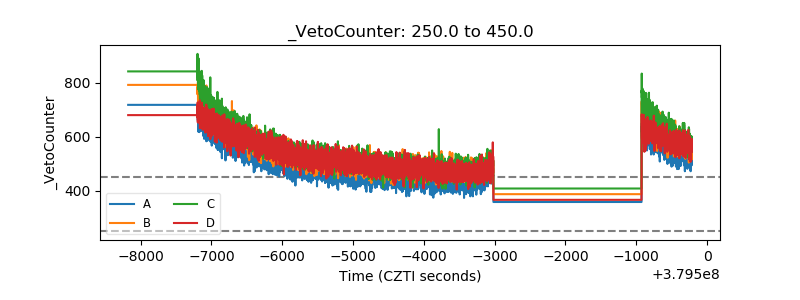 |