| Param | Original file | Final file |
|---|---|---|
| Filename | modeM0/AS1A11_046T07_9000004862_33989cztM0_level2.evt | modeM0/AS1A11_046T07_9000004862_33989cztM0_level2_quad_clean.evt |
| Size (bytes) | 693,192,960 | 46,468,800 |
| Size | 661.1 MB | 44.3 MB |
| Events in quadrant A | 2,569,263 | 287,402 |
| Events in quadrant B | 8,697,321 | 264,491 |
| Events in quadrant C | 3,453,169 | 281,707 |
| Events in quadrant D | 5,938,930 | 225,035 |
| Mode M9 | |||
|---|---|---|---|
| Quadrant | BADHDUFLAG | Total packets | Discarded packets |
| A | 0 | 27 | 0 |
| B | 0 | 27 | 0 |
| C | 0 | 27 | 0 |
| D | 0 | 28 | 0 |
| Mode M0 | |||
|---|---|---|---|
| Quadrant | BADHDUFLAG | Total packets | Discarded packets |
| A | 0 | 10264 | 3 |
| B | 0 | 29160 | 2 |
| C | 0 | 13556 | 2 |
| D | 0 | 21134 | 2 |
| Mode SS | |||
|---|---|---|---|
| Quadrant | BADHDUFLAG | Total packets | Discarded packets |
| A | 0 | 100 | 0 |
| B | 0 | 100 | 0 |
| C | 0 | 100 | 0 |
| D | 0 | 100 | 0 |
| Quadrant | Total seconds | Saturated seconds | Saturation percentage |
|---|---|---|---|
| A | 4957 | 5 | 0.100867% |
| B | 4957 | 2707 | 54.609643% |
| C | 4957 | 144 | 2.904983% |
| D | 4957 | 1029 | 20.758523% |
Noise dominated data is calculated using 1-second bins in cleaned event files. If a bin has >2000 counts, and if more than 50% of those come from <1% of pixels, then it is considered to be noise-dominated and hence unusable.
| Quadrant | # 1 sec bins | Bins with >0 counts | Bins with >2000 counts | High rate bins dominated by noise | Noise dominated (total time) | Noise dominated (detector-on time) | Marked lightcurve |
|---|---|---|---|---|---|---|---|
| A | 7080 | 4958 | 0 | 0 | 0.00% | 0.00% | 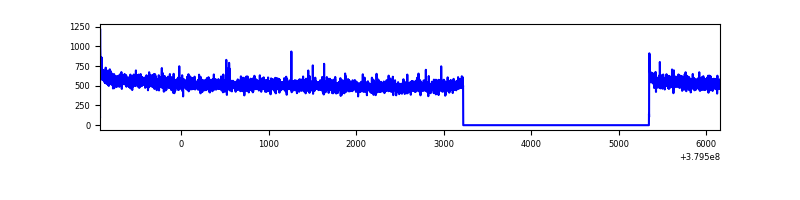 |
| B | 7080 | 4958 | 2450 | 2450 | 34.60% | 49.42% | 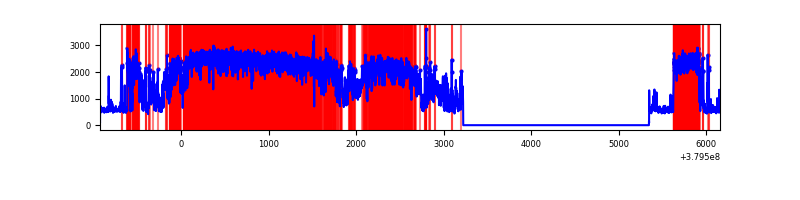 |
| C | 7080 | 4958 | 112 | 112 | 1.58% | 2.26% | 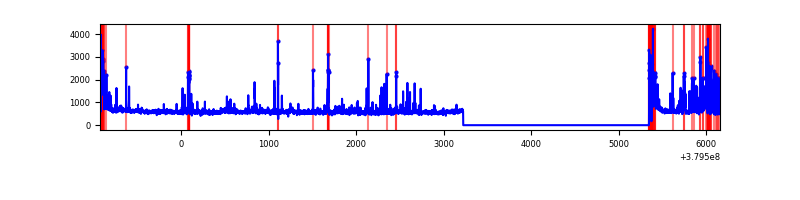 |
| D | 7080 | 4958 | 978 | 978 | 13.81% | 19.73% | 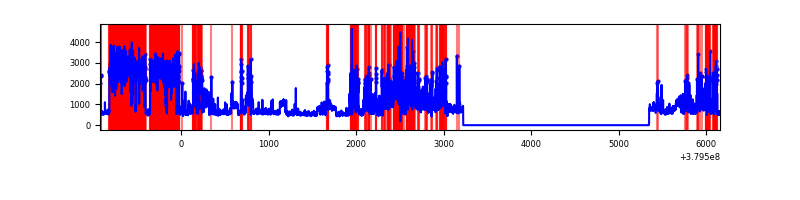 |
Top three noisy pixels from each quadrant. If the there are fewer than three noisy pixels in the level2.evt file, extra rows are filled as -1
| Pixel properties | Quadrant properties | ||||||
|---|---|---|---|---|---|---|---|
| Quadrant | DetID | PixID | Counts | Sigma | Mean | Median | Sigma |
| A | 10 | 83 | 15578 | 113.97 | 658 | 648 | 131.0 |
| A | 13 | 254 | 8234 | 57.91 | 658 | 648 | 131.0 |
| A | 15 | 169 | 7042 | 48.81 | 658 | 648 | 131.0 |
| B | 5 | 14 | 2039841 | 20501.95 | 527 | 515 | 99.5 |
| B | 5 | 31 | 2025382 | 20356.59 | 527 | 515 | 99.5 |
| B | 5 | 15 | 2021253 | 20315.08 | 527 | 515 | 99.5 |
| C | 4 | 254 | 317027 | 2184.83 | 632 | 639 | 144.8 |
| C | 15 | 214 | 213122 | 1467.31 | 632 | 639 | 144.8 |
| C | 0 | 10 | 208139 | 1432.9 | 632 | 639 | 144.8 |
| D | 8 | 230 | 1621161 | 11643.46 | 570 | 557 | 139.2 |
| D | 8 | 195 | 754063 | 5413.67 | 570 | 557 | 139.2 |
| D | 12 | 6 | 546079 | 3919.38 | 570 | 557 | 139.2 |
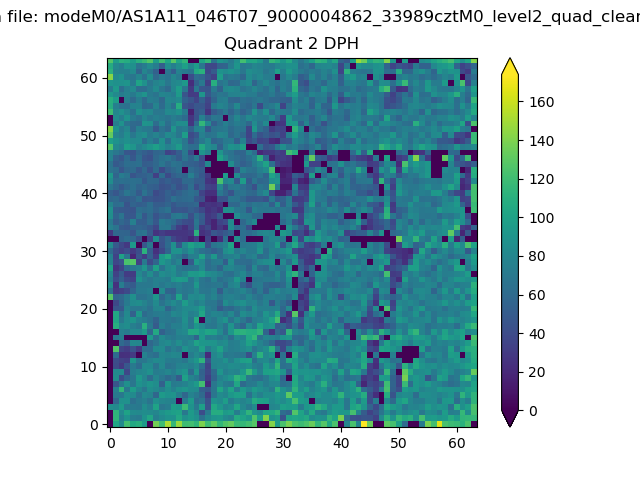
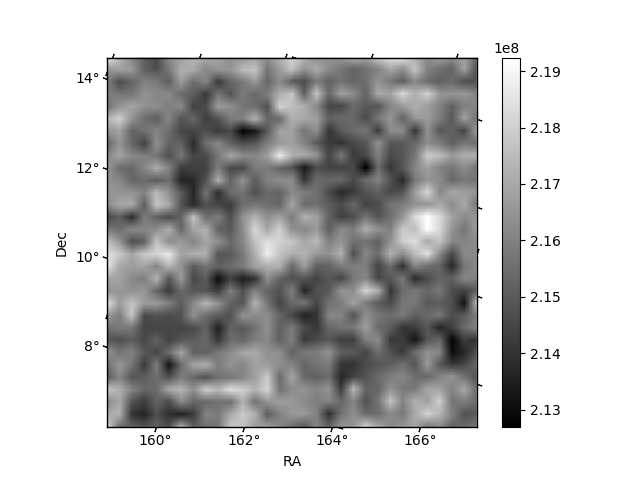
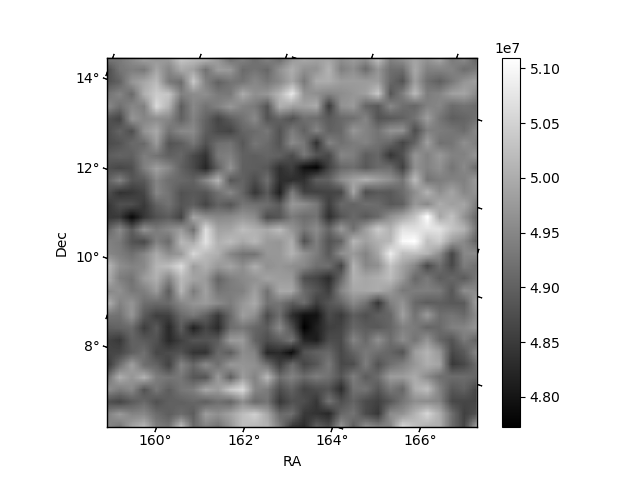
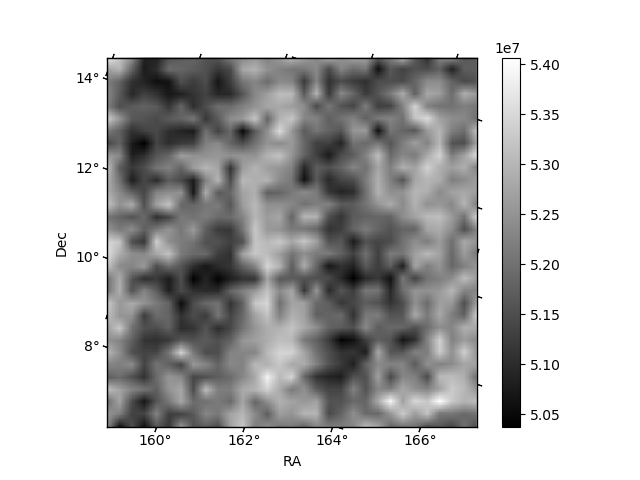
Histogram calculated using DETX and DETY for each event in the final _common_clean file
| Quadrant A | 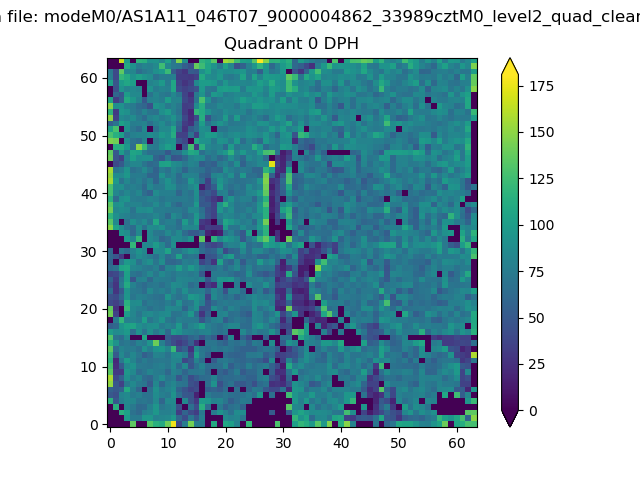 |
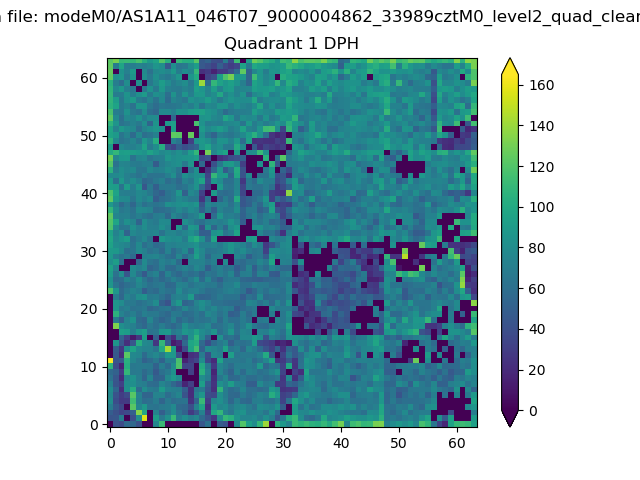 |
Quadrant B |
|---|---|---|---|
| Quadrant D | 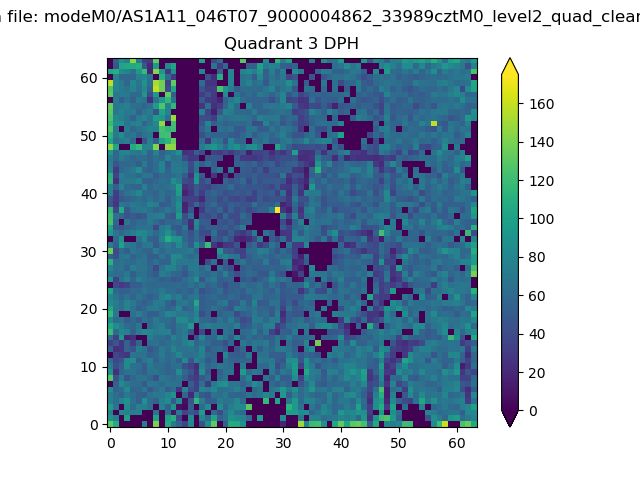 |
 |
Quadrant C |
| Plot type | Count rate plots | Images |
|---|---|---|
| Comparison with Poisson distribution Blue bars denote a histogram of data divided into 1 sec bins. Red curve is a Poisson curve with rate = median count rate of data. |
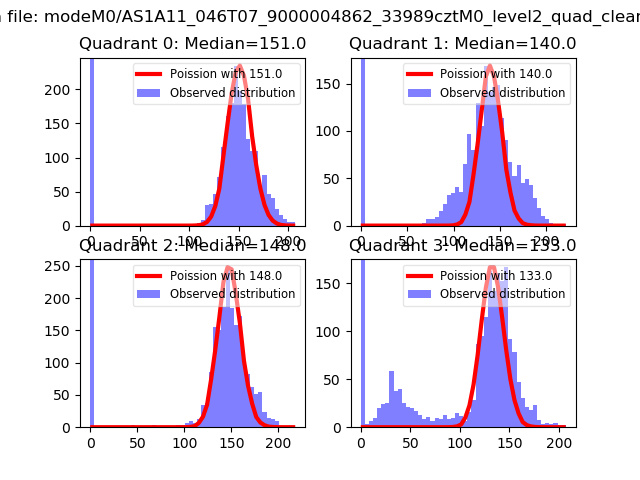 |
 |
| Quadrant-wise count rates Data is divided into 100 sec bins |
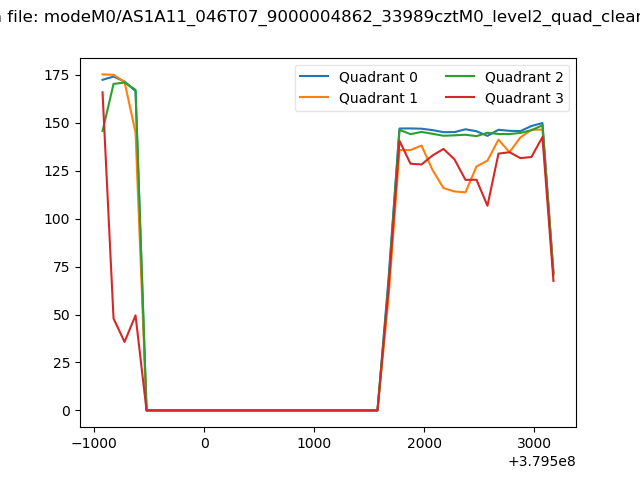 |
|
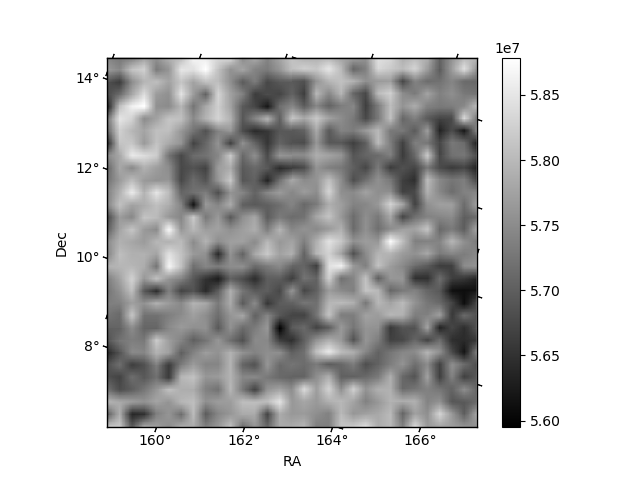
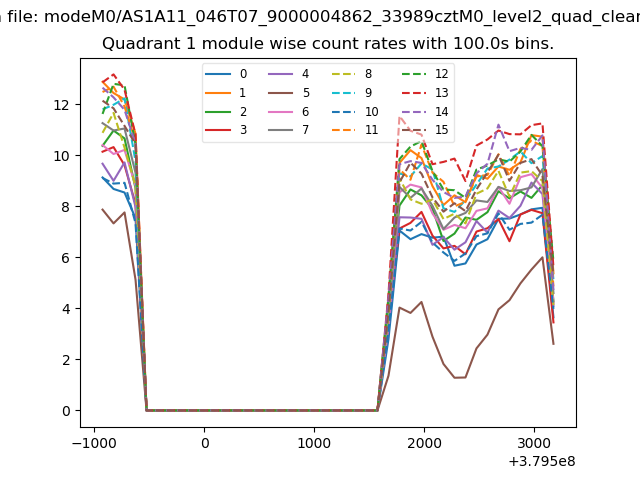
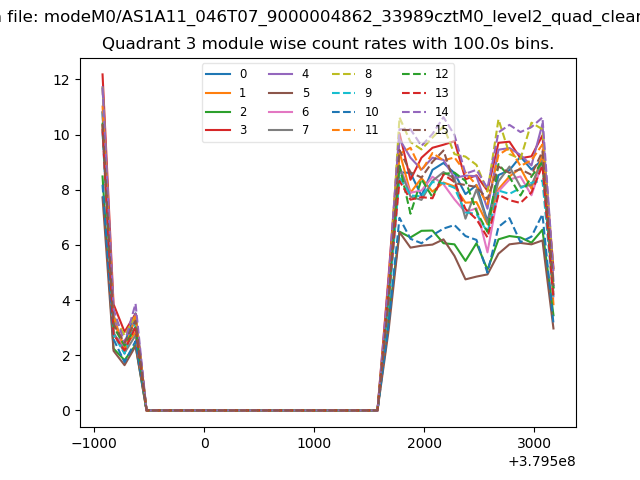
| Module-wise count rates for Quadrant A Data is divided into 100 sec bins |
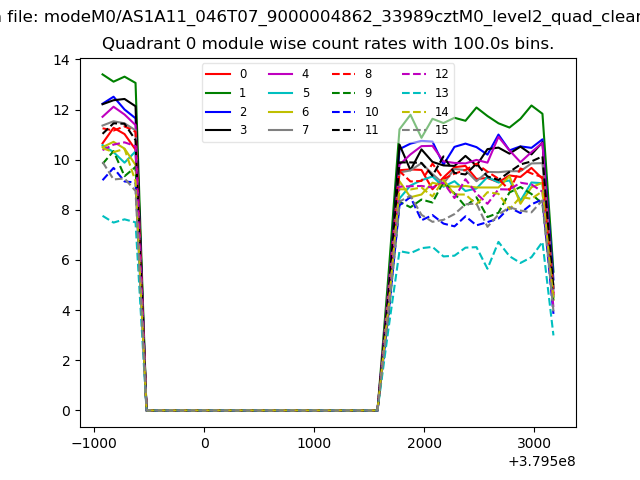 |
 |
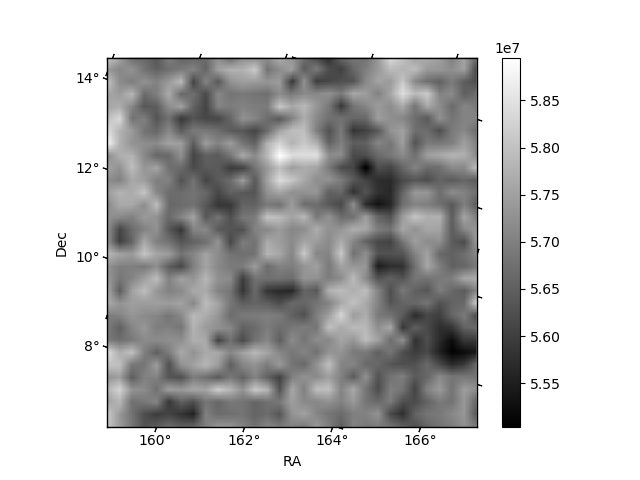
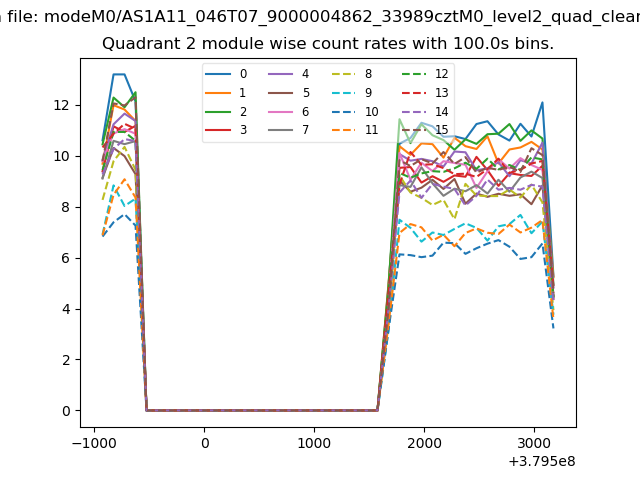
| Module-wise count rates for Quadrant B Data is divided into 100 sec bins |
 |
 |
| Module-wise count rates for Quadrant C Data is divided into 100 sec bins |
 |
 |
| Module-wise count rates for Quadrant D Data is divided into 100 sec bins |
 |
 |
| Parameter | Plot |
|---|---|
| CZT HV Monitor | 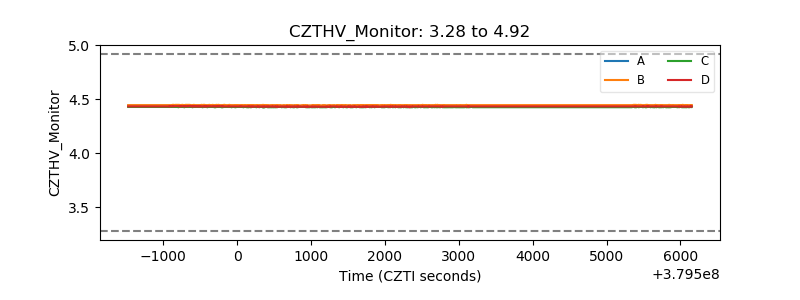 |
| D_VDD | 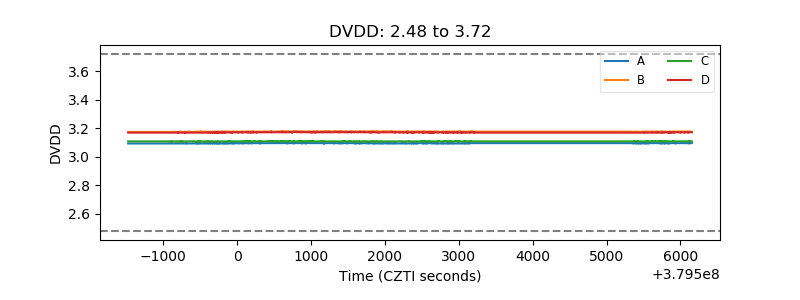 |
| Temperature 1 | 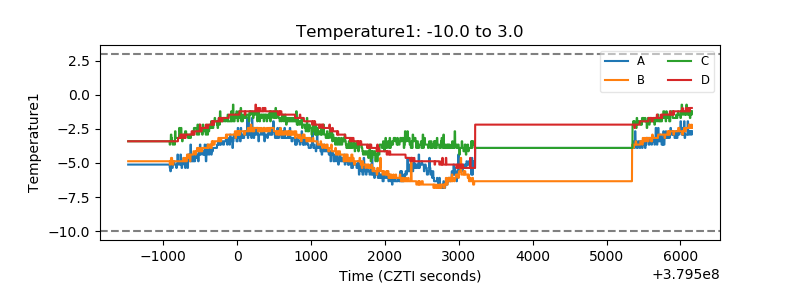 |
| Veto HV Monitor | 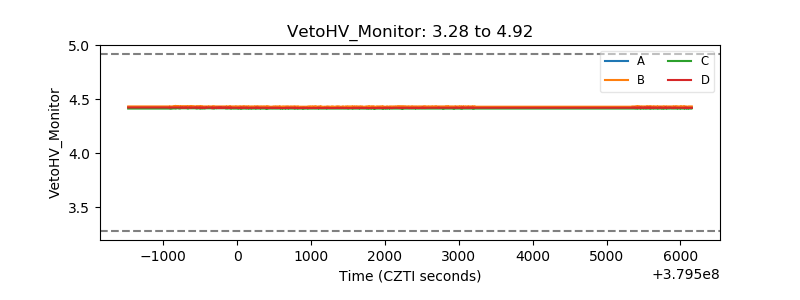 |
| Veto LLD | 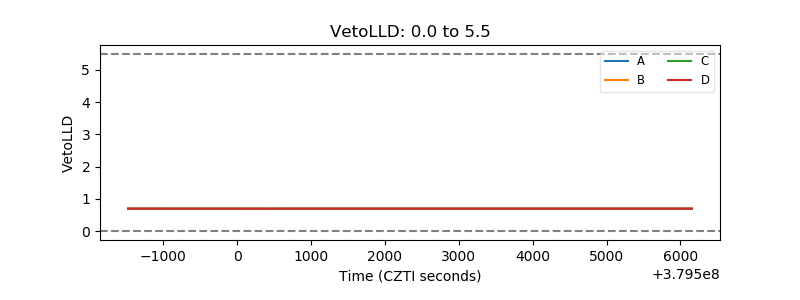 |
| Alpha Counter | 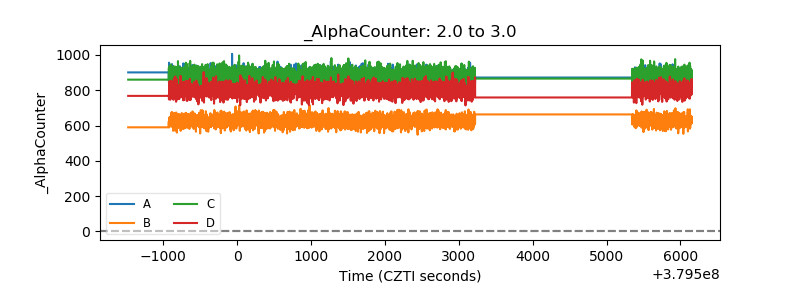 |
| _CPM_Rate | 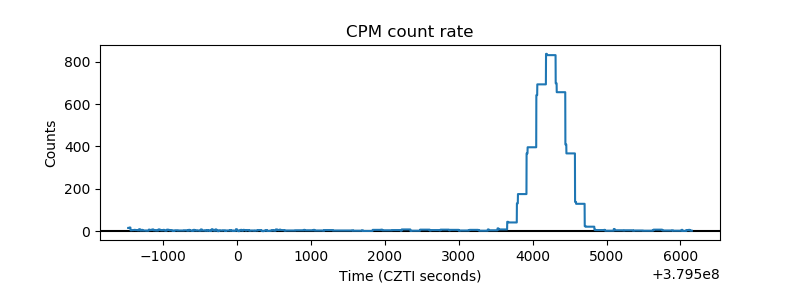 |
| CZT Counter | 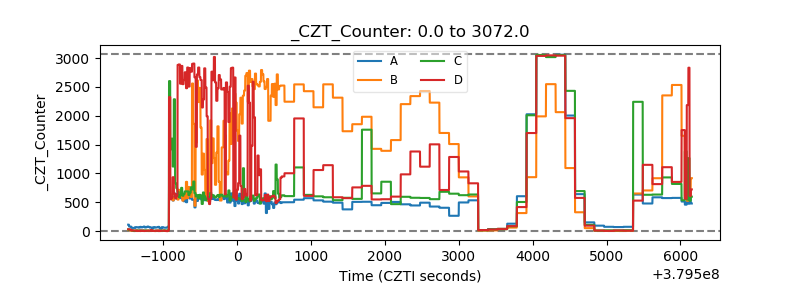 |
| +2.5 Volts monitor |  |
| +5 Volts monitor | 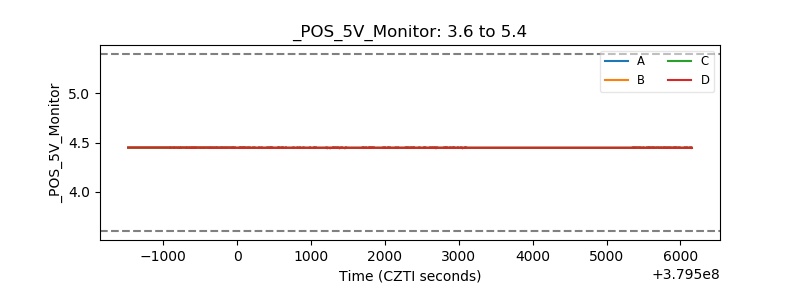 |
| _ROLL_ROT | 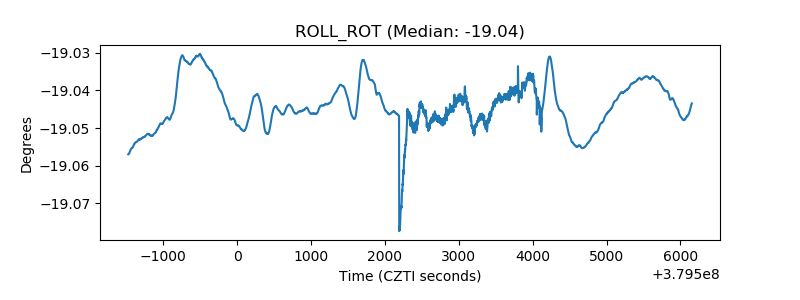 |
| _Roll_DEC | 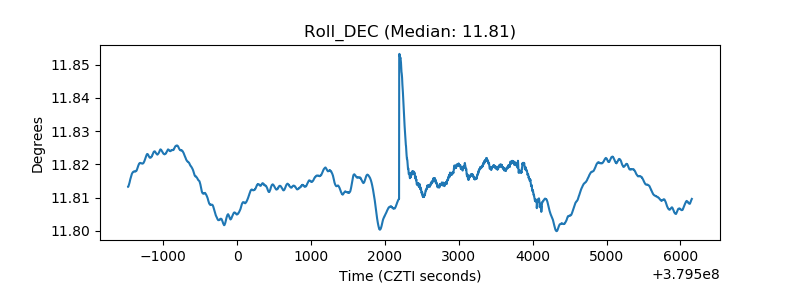 |
| _Roll_RA | 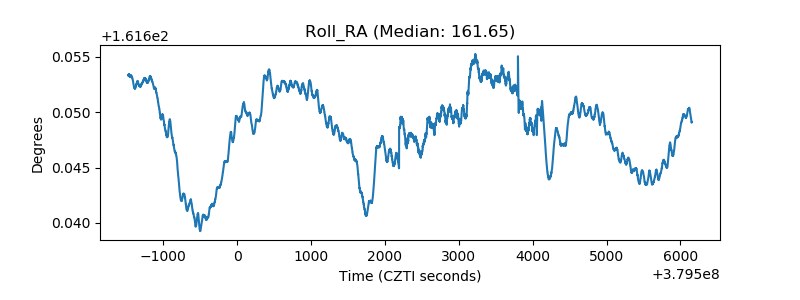 |
| Veto Counter | 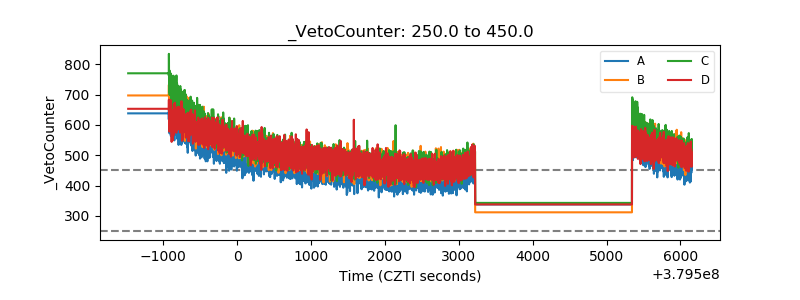 |