| Param | Original file | Final file |
|---|---|---|
| Filename | modeM0/AS1A11_046T07_9000004862_33990cztM0_level2.evt | modeM0/AS1A11_046T07_9000004862_33990cztM0_level2_quad_clean.evt |
| Size (bytes) | 413,343,360 | 36,619,200 |
| Size | 394.2 MB | 34.9 MB |
| Events in quadrant A | 1,856,323 | 216,904 |
| Events in quadrant B | 3,489,254 | 212,213 |
| Events in quadrant C | 3,152,753 | 215,264 |
| Events in quadrant D | 3,762,056 | 195,665 |
| Mode M9 | |||
|---|---|---|---|
| Quadrant | BADHDUFLAG | Total packets | Discarded packets |
| A | 0 | 3 | 0 |
| B | 0 | 3 | 0 |
| C | 0 | 3 | 0 |
| D | 0 | 4 | 0 |
| Mode M0 | |||
|---|---|---|---|
| Quadrant | BADHDUFLAG | Total packets | Discarded packets |
| A | 0 | 7701 | 1 |
| B | 0 | 12747 | 1 |
| C | 0 | 11807 | 1 |
| D | 0 | 13771 | 1 |
| Mode SS | |||
|---|---|---|---|
| Quadrant | BADHDUFLAG | Total packets | Discarded packets |
| A | 0 | 76 | 0 |
| B | 0 | 76 | 0 |
| C | 0 | 76 | 0 |
| D | 0 | 76 | 0 |
| Quadrant | Total seconds | Saturated seconds | Saturation percentage |
|---|---|---|---|
| A | 3794 | 4 | 0.105430% |
| B | 3794 | 667 | 17.580390% |
| C | 3794 | 254 | 6.694781% |
| D | 3794 | 246 | 6.483922% |
Noise dominated data is calculated using 1-second bins in cleaned event files. If a bin has >2000 counts, and if more than 50% of those come from <1% of pixels, then it is considered to be noise-dominated and hence unusable.
| Quadrant | # 1 sec bins | Bins with >0 counts | Bins with >2000 counts | High rate bins dominated by noise | Noise dominated (total time) | Noise dominated (detector-on time) | Marked lightcurve |
|---|---|---|---|---|---|---|---|
| A | 3794 | 3794 | 0 | 0 | 0.00% | 0.00% | 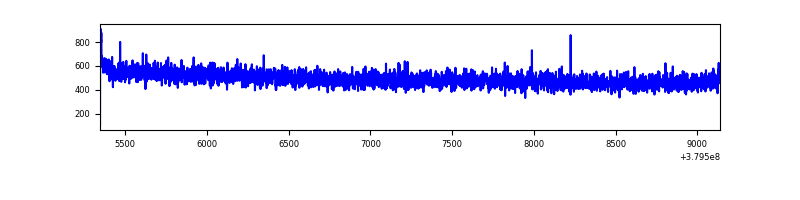 |
| B | 3794 | 3794 | 566 | 566 | 14.92% | 14.92% | 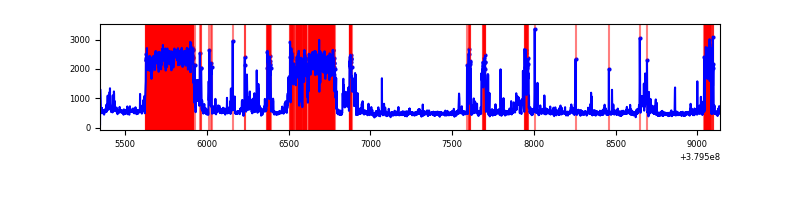 |
| C | 3794 | 3794 | 218 | 218 | 5.75% | 5.75% | 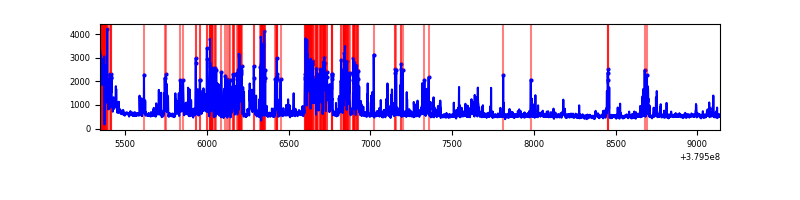 |
| D | 3794 | 3794 | 229 | 229 | 6.04% | 6.04% | 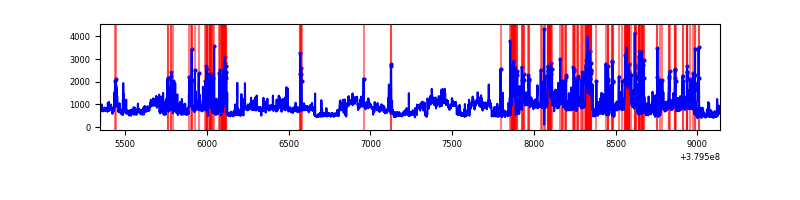 |
Top three noisy pixels from each quadrant. If the there are fewer than three noisy pixels in the level2.evt file, extra rows are filled as -1
| Pixel properties | Quadrant properties | ||||||
|---|---|---|---|---|---|---|---|
| Quadrant | DetID | PixID | Counts | Sigma | Mean | Median | Sigma |
| A | 10 | 83 | 8794 | 87.56 | 477 | 467 | 95.1 |
| A | 13 | 254 | 6751 | 66.08 | 477 | 467 | 95.1 |
| A | 13 | 6 | 6007 | 58.25 | 477 | 467 | 95.1 |
| B | 5 | 31 | 375842 | 4414.37 | 442 | 432 | 85.0 |
| B | 5 | 15 | 373601 | 4388.02 | 442 | 432 | 85.0 |
| B | 5 | 14 | 367857 | 4320.48 | 442 | 432 | 85.0 |
| C | 4 | 254 | 945226 | 8939.1 | 450 | 454 | 105.7 |
| C | 15 | 214 | 158065 | 1491.26 | 450 | 454 | 105.7 |
| C | 0 | 10 | 144567 | 1363.55 | 450 | 454 | 105.7 |
| D | 8 | 195 | 944125 | 8395.5 | 454 | 442 | 112.4 |
| D | 12 | 6 | 448184 | 3983.35 | 454 | 442 | 112.4 |
| D | 13 | 249 | 332860 | 2957.37 | 454 | 442 | 112.4 |
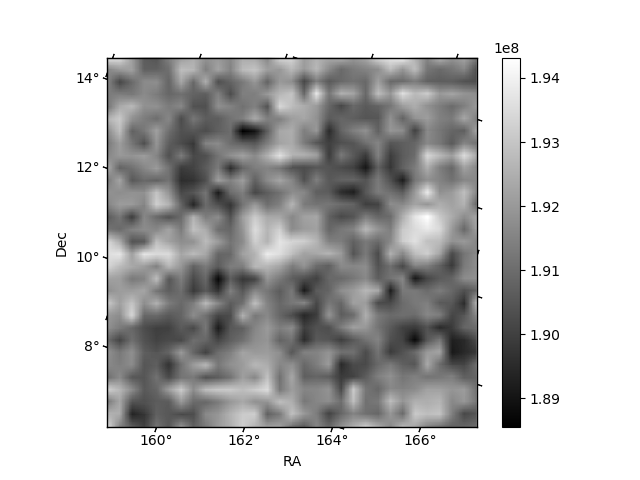
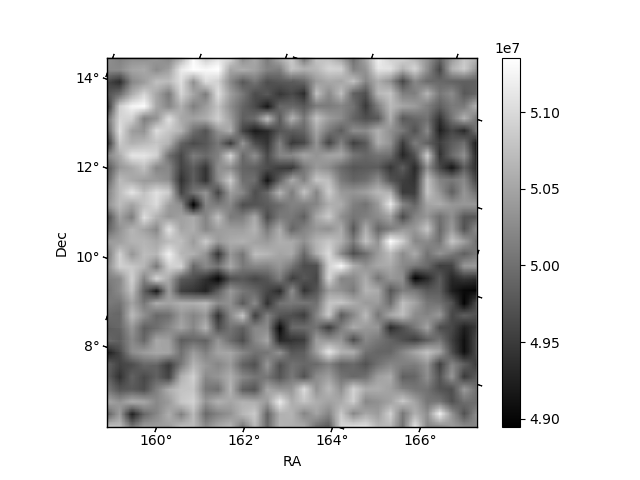
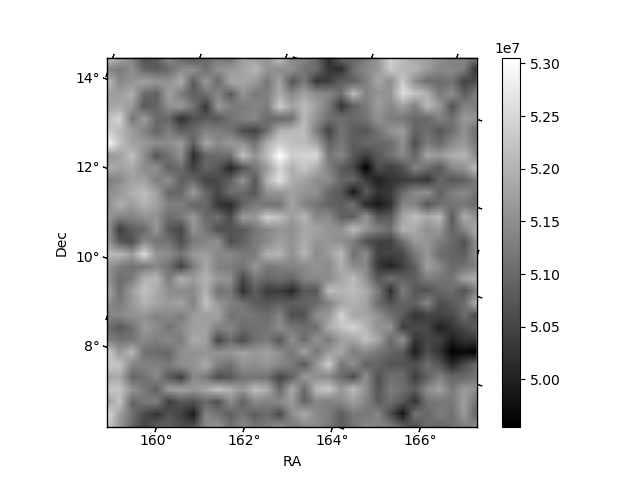
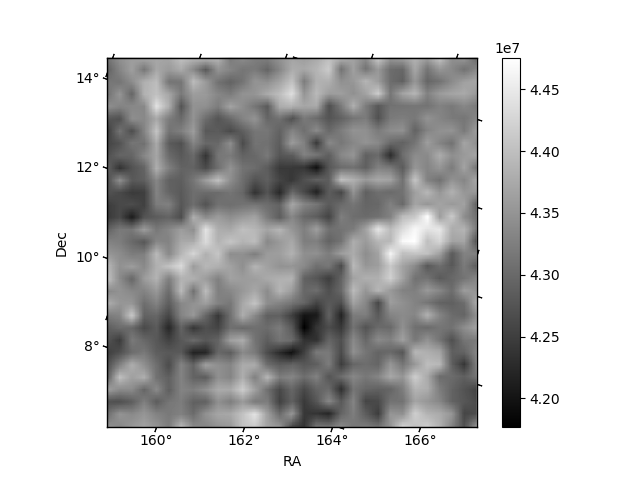
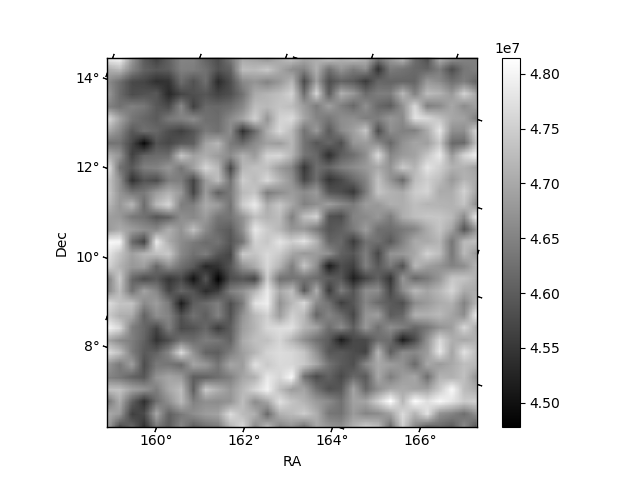
Histogram calculated using DETX and DETY for each event in the final _common_clean file
| Quadrant A | 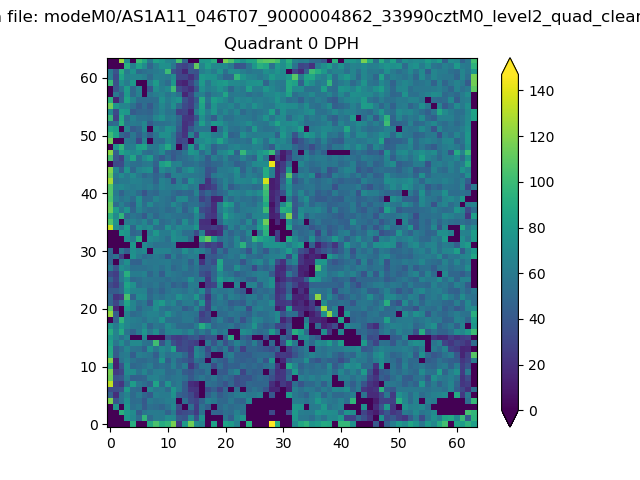 |
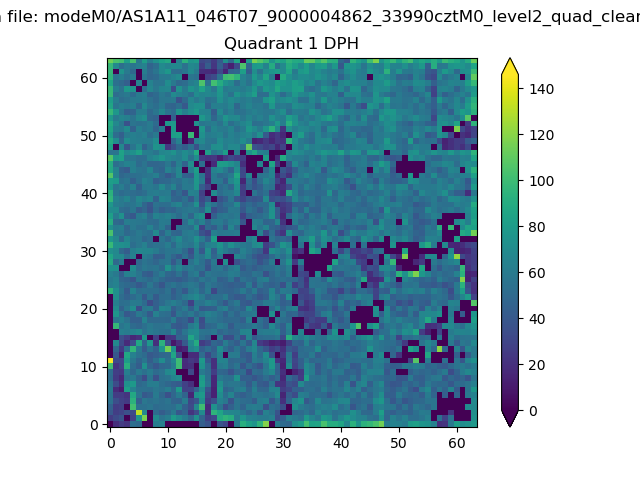 |
Quadrant B |
|---|---|---|---|
| Quadrant D | 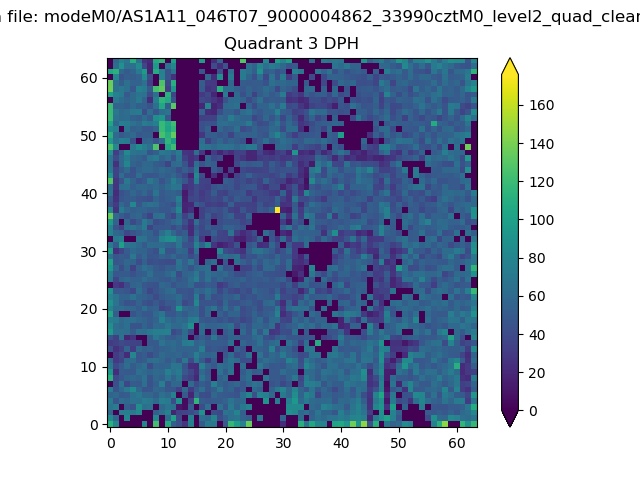 |
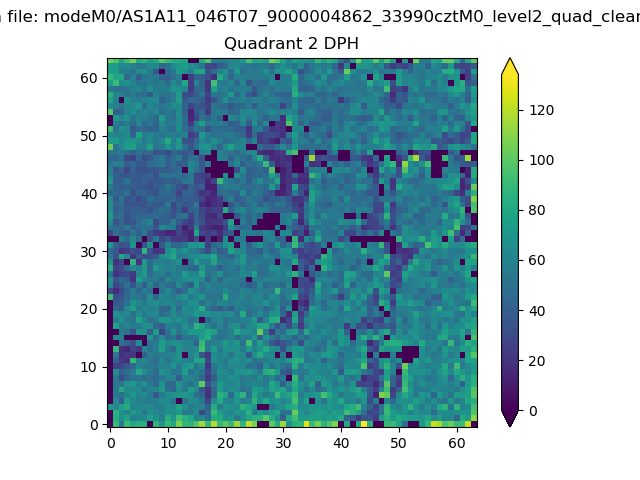 |
Quadrant C |
| Plot type | Count rate plots | Images |
|---|---|---|
| Comparison with Poisson distribution Blue bars denote a histogram of data divided into 1 sec bins. Red curve is a Poisson curve with rate = median count rate of data. |
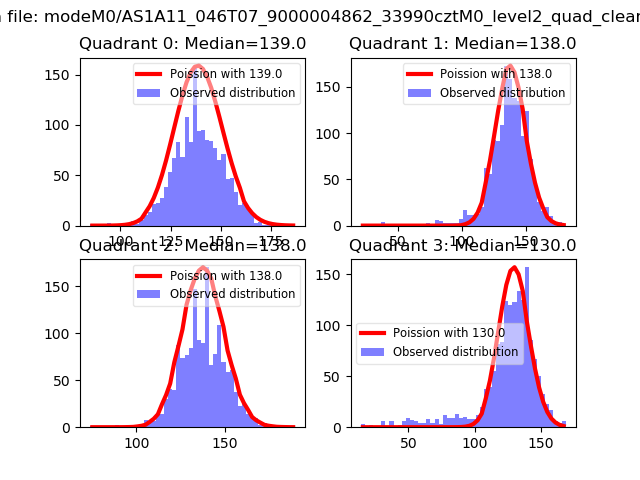 |
 |
| Quadrant-wise count rates Data is divided into 100 sec bins |
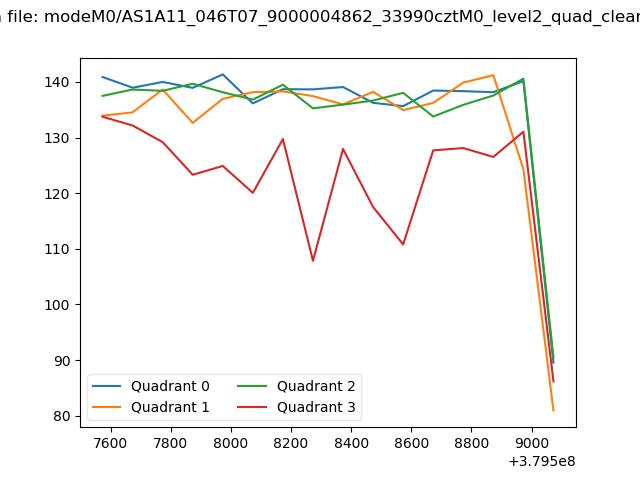 |
|
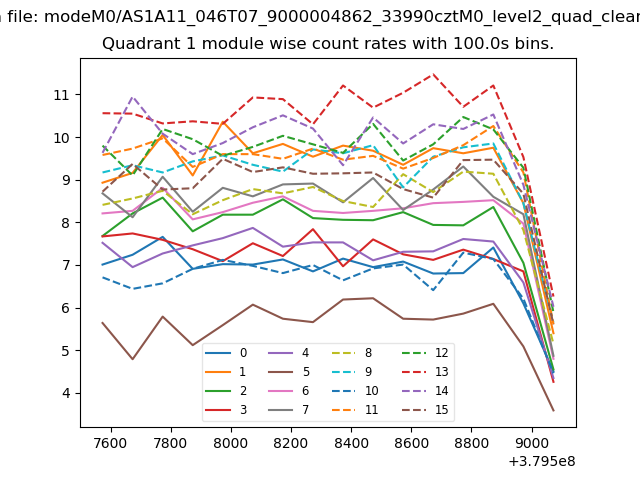
| Module-wise count rates for Quadrant A Data is divided into 100 sec bins |
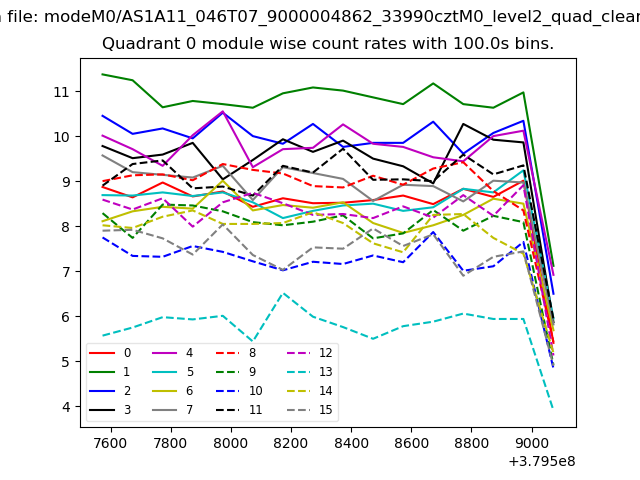 |
 |
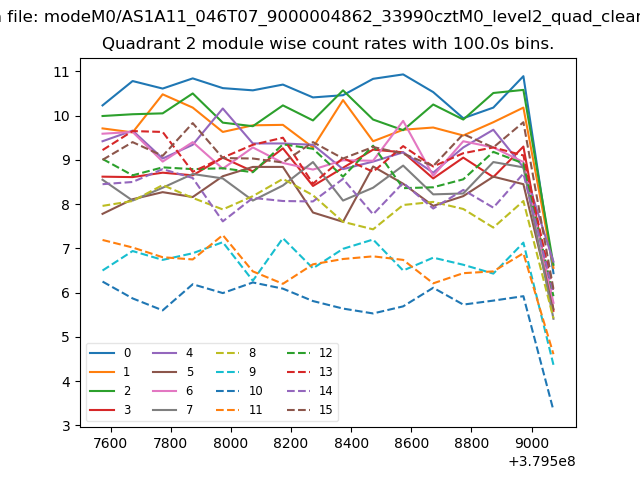
| Module-wise count rates for Quadrant B Data is divided into 100 sec bins |
 |
 |
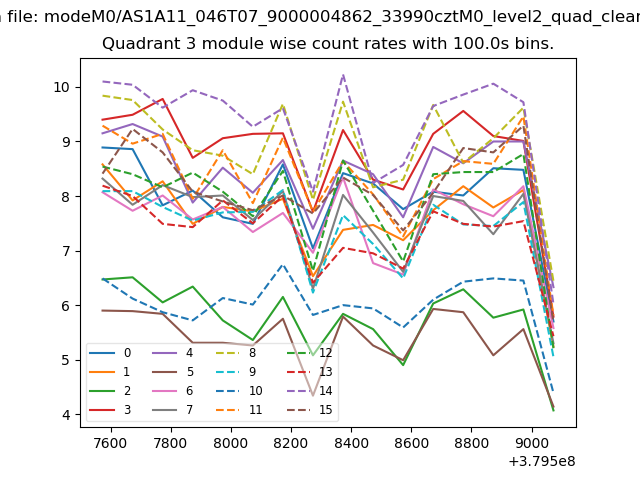
| Module-wise count rates for Quadrant C Data is divided into 100 sec bins |
 |
 |
| Module-wise count rates for Quadrant D Data is divided into 100 sec bins |
 |
 |
| Parameter | Plot |
|---|---|
| CZT HV Monitor | 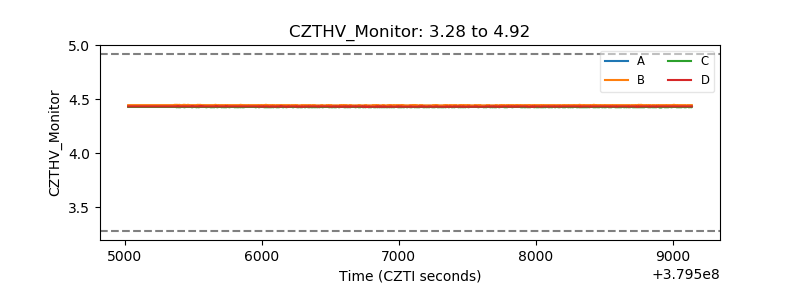 |
| D_VDD | 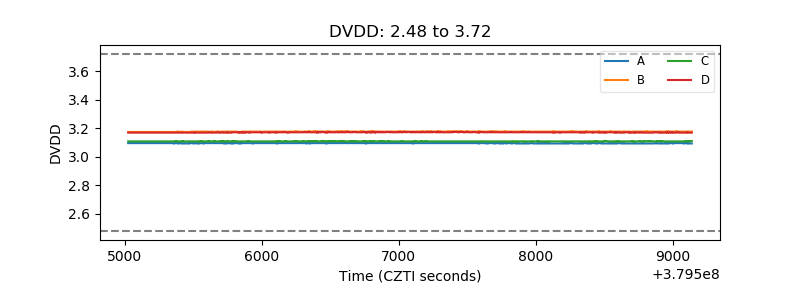 |
| Temperature 1 | 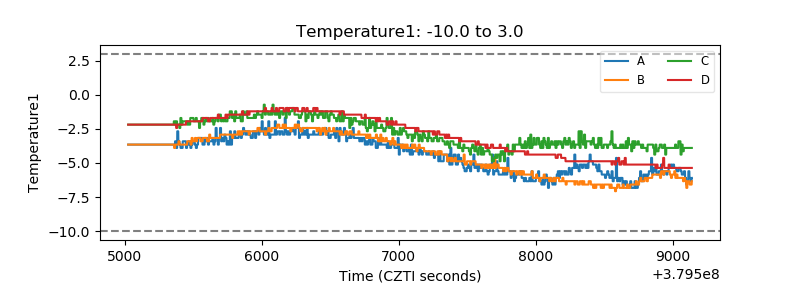 |
| Veto HV Monitor | 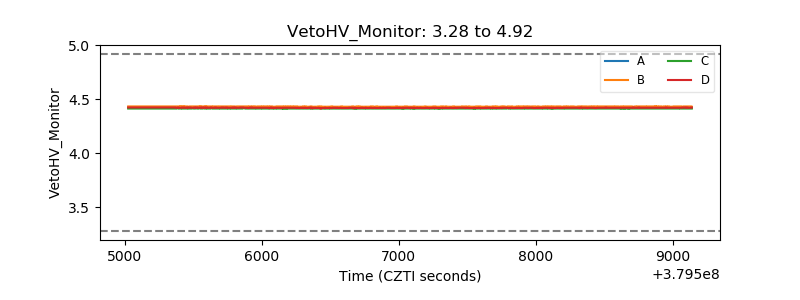 |
| Veto LLD | 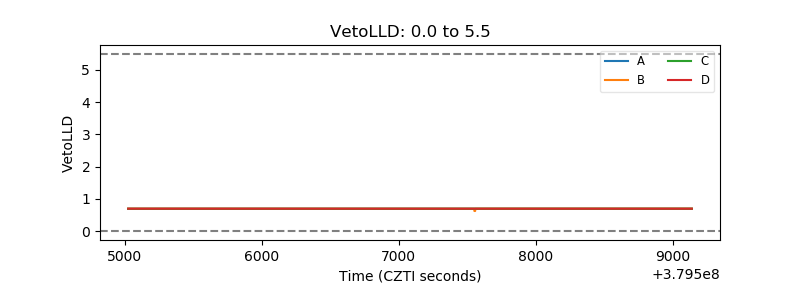 |
| Alpha Counter | 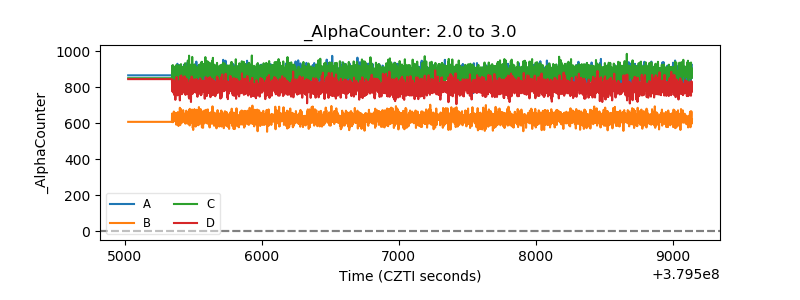 |
| _CPM_Rate | 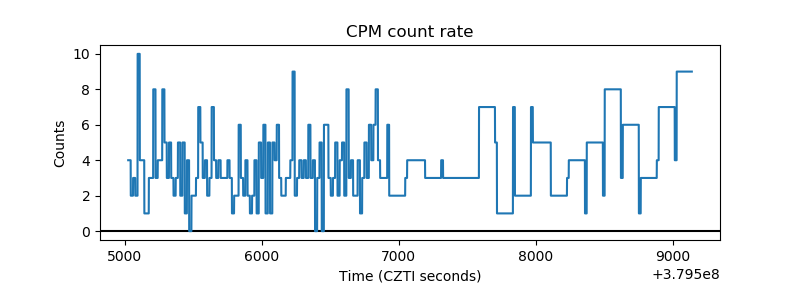 |
| CZT Counter | 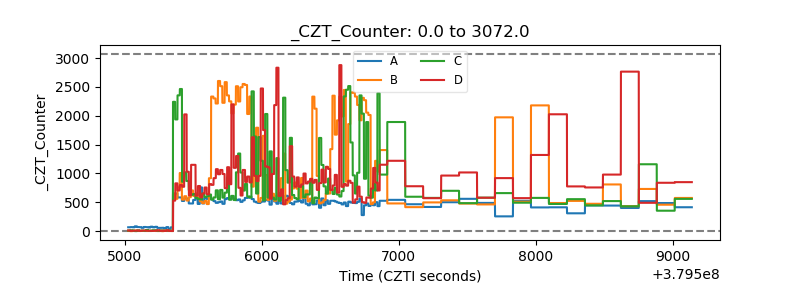 |
| +2.5 Volts monitor | 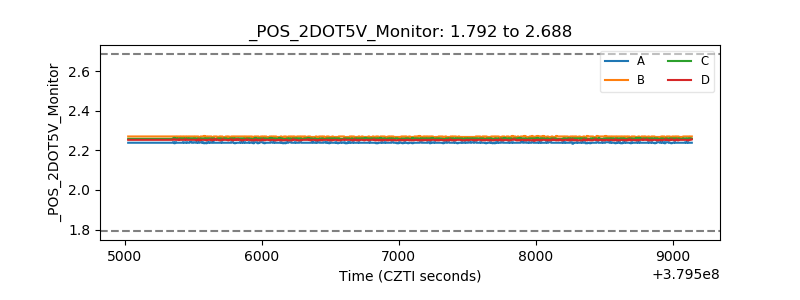 |
| +5 Volts monitor | 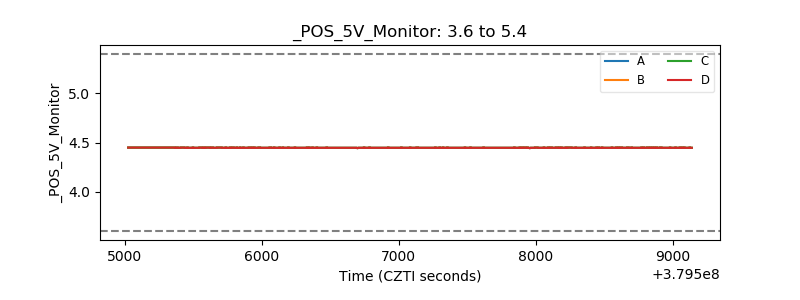 |
| _ROLL_ROT | 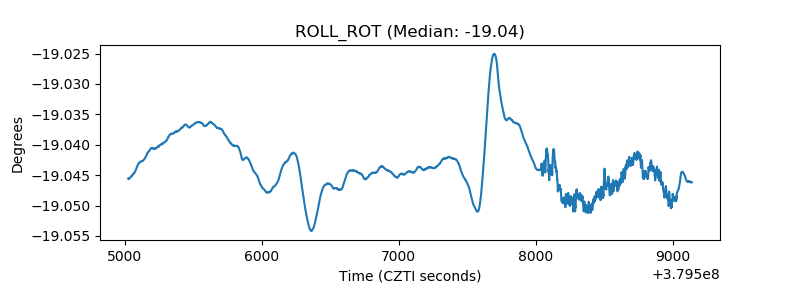 |
| _Roll_DEC |  |
| _Roll_RA | 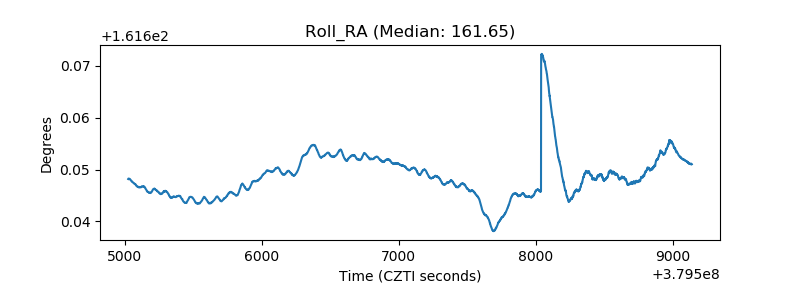 |
| Veto Counter | 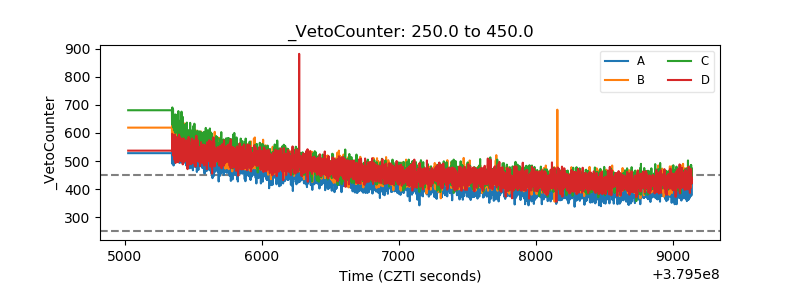 |