| Param | Original file | Final file |
|---|---|---|
| Filename | modeM0/AS1A11_106T03_9000004864_33992cztM0_level2.evt | modeM0/AS1A11_106T03_9000004864_33992cztM0_level2_quad_clean.evt |
| Size (bytes) | 494,101,440 | 74,551,680 |
| Size | 471.2 MB | 71.1 MB |
| Events in quadrant A | 2,644,099 | 476,189 |
| Events in quadrant B | 3,382,519 | 467,674 |
| Events in quadrant C | 3,647,898 | 468,491 |
| Events in quadrant D | 4,900,578 | 444,005 |
| Mode M9 | |||
|---|---|---|---|
| Quadrant | BADHDUFLAG | Total packets | Discarded packets |
| A | 0 | 26 | 0 |
| B | 0 | 26 | 0 |
| C | 0 | 26 | 0 |
| D | 0 | 27 | 0 |
| Mode M0 | |||
|---|---|---|---|
| Quadrant | BADHDUFLAG | Total packets | Discarded packets |
| A | 0 | 11605 | 3 |
| B | 0 | 13698 | 2 |
| C | 0 | 14398 | 2 |
| D | 0 | 18503 | 2 |
| Mode SS | |||
|---|---|---|---|
| Quadrant | BADHDUFLAG | Total packets | Discarded packets |
| A | 0 | 116 | 0 |
| B | 0 | 116 | 0 |
| C | 0 | 116 | 0 |
| D | 0 | 116 | 0 |
| Quadrant | Total seconds | Saturated seconds | Saturation percentage |
|---|---|---|---|
| A | 5739 | 6 | 0.104548% |
| B | 5739 | 136 | 2.369751% |
| C | 5739 | 115 | 2.003833% |
| D | 5739 | 189 | 3.293257% |
Noise dominated data is calculated using 1-second bins in cleaned event files. If a bin has >2000 counts, and if more than 50% of those come from <1% of pixels, then it is considered to be noise-dominated and hence unusable.
| Quadrant | # 1 sec bins | Bins with >0 counts | Bins with >2000 counts | High rate bins dominated by noise | Noise dominated (total time) | Noise dominated (detector-on time) | Marked lightcurve |
|---|---|---|---|---|---|---|---|
| A | 7171 | 5740 | 1 | 1 | 0.01% | 0.02% | 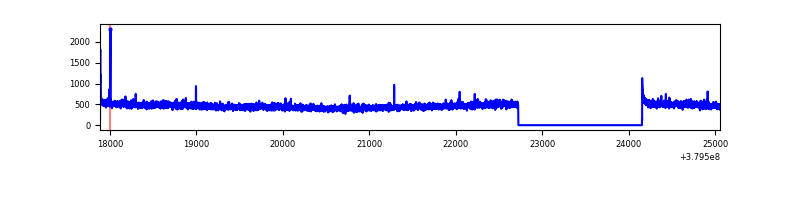 |
| B | 7171 | 5740 | 92 | 92 | 1.28% | 1.60% | 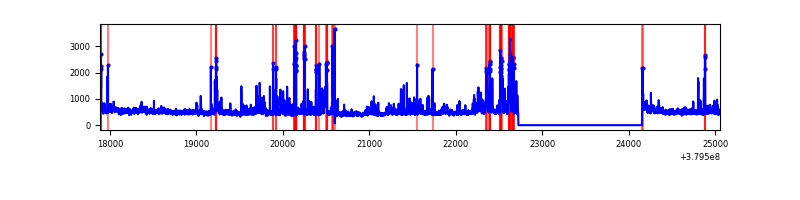 |
| C | 7171 | 5740 | 95 | 95 | 1.32% | 1.66% | 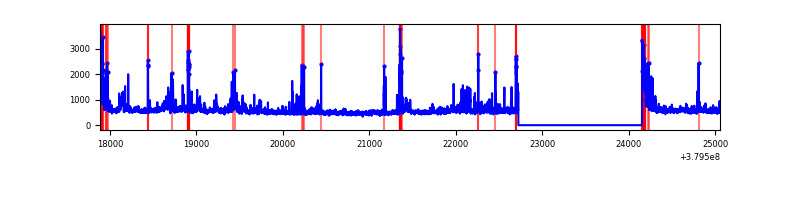 |
| D | 7171 | 5740 | 179 | 179 | 2.50% | 3.12% | 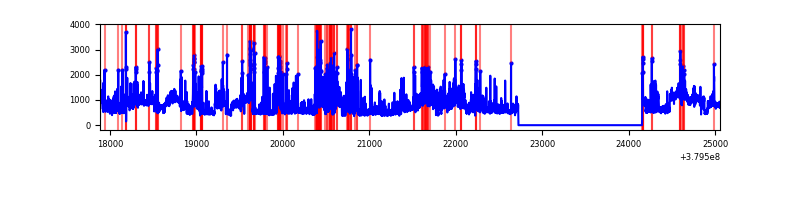 |
Top three noisy pixels from each quadrant. If the there are fewer than three noisy pixels in the level2.evt file, extra rows are filled as -1
| Pixel properties | Quadrant properties | ||||||
|---|---|---|---|---|---|---|---|
| Quadrant | DetID | PixID | Counts | Sigma | Mean | Median | Sigma |
| A | 10 | 83 | 17400 | 123.75 | 670 | 656 | 135.3 |
| A | 13 | 6 | 12170 | 85.1 | 670 | 656 | 135.3 |
| A | 13 | 254 | 10505 | 72.79 | 670 | 656 | 135.3 |
| B | 5 | 172 | 469013 | 3684.84 | 661 | 644 | 127.1 |
| B | 0 | 190 | 89552 | 699.47 | 661 | 644 | 127.1 |
| B | 0 | 219 | 43680 | 338.58 | 661 | 644 | 127.1 |
| C | 3 | 233 | 396875 | 2655.7 | 646 | 651 | 149.2 |
| C | 15 | 214 | 247493 | 1654.46 | 646 | 651 | 149.2 |
| C | 4 | 254 | 229219 | 1531.98 | 646 | 651 | 149.2 |
| D | 8 | 195 | 1267720 | 7202.71 | 641 | 627 | 175.9 |
| D | 12 | 6 | 304304 | 1726.23 | 641 | 627 | 175.9 |
| D | 13 | 249 | 300509 | 1704.66 | 641 | 627 | 175.9 |
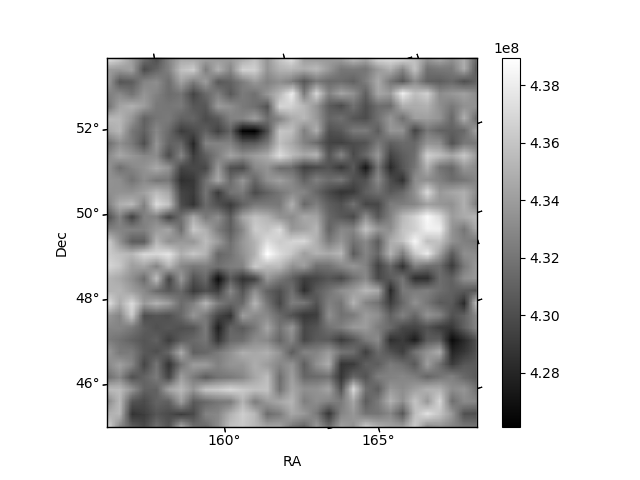
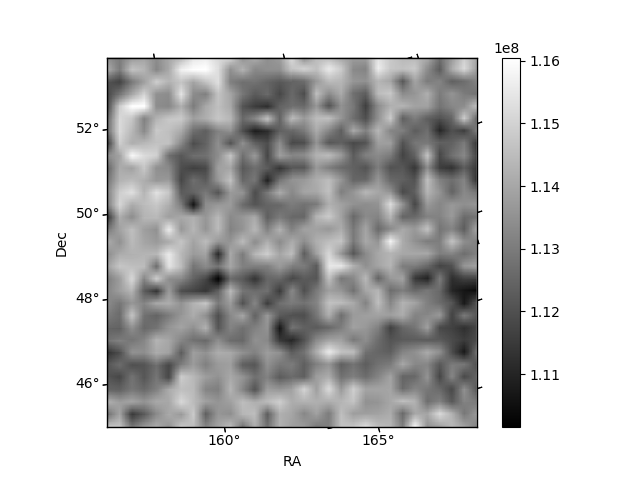
Histogram calculated using DETX and DETY for each event in the final _common_clean file
| Quadrant A | 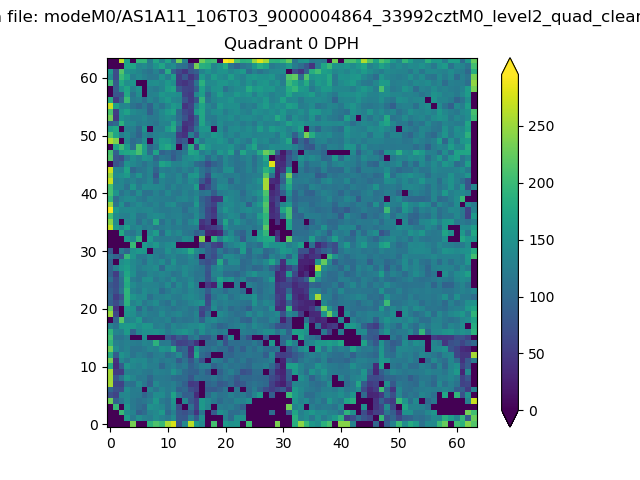 |
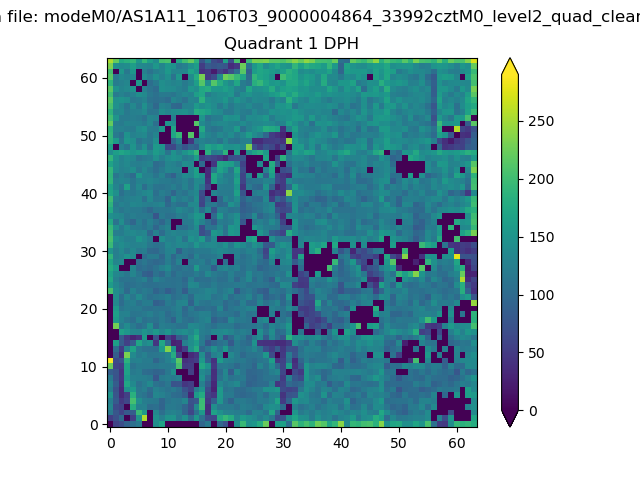 |
Quadrant B |
|---|---|---|---|
| Quadrant D | 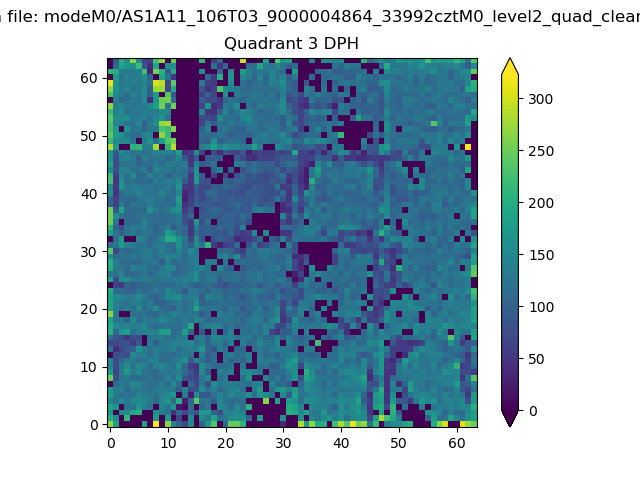 |
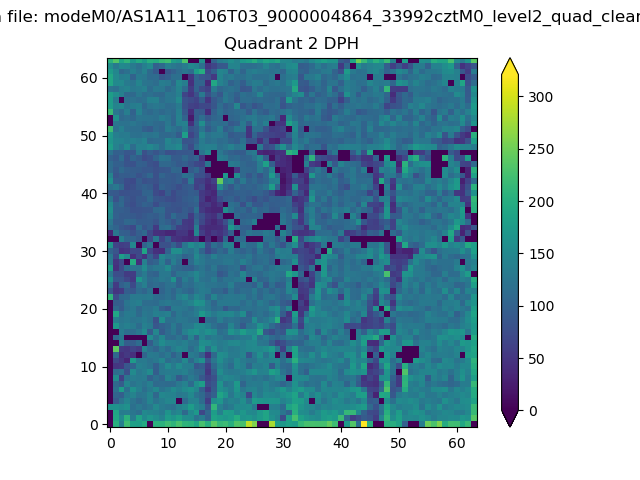 |
Quadrant C |
| Plot type | Count rate plots | Images |
|---|---|---|
| Comparison with Poisson distribution Blue bars denote a histogram of data divided into 1 sec bins. Red curve is a Poisson curve with rate = median count rate of data. |
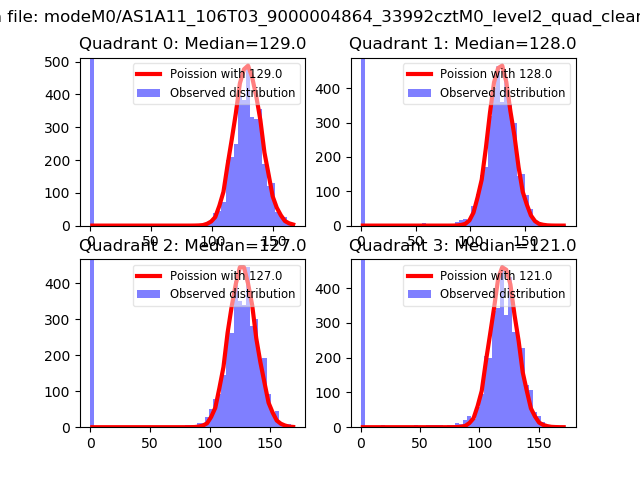 |
 |
| Quadrant-wise count rates Data is divided into 100 sec bins |
 |
|
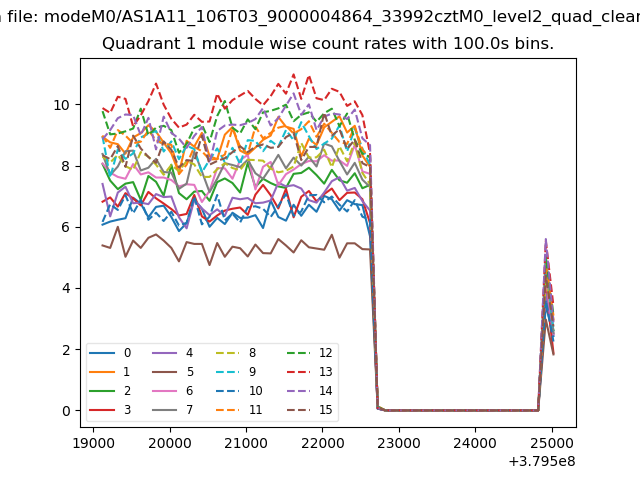
| Module-wise count rates for Quadrant A Data is divided into 100 sec bins |
 |
 |
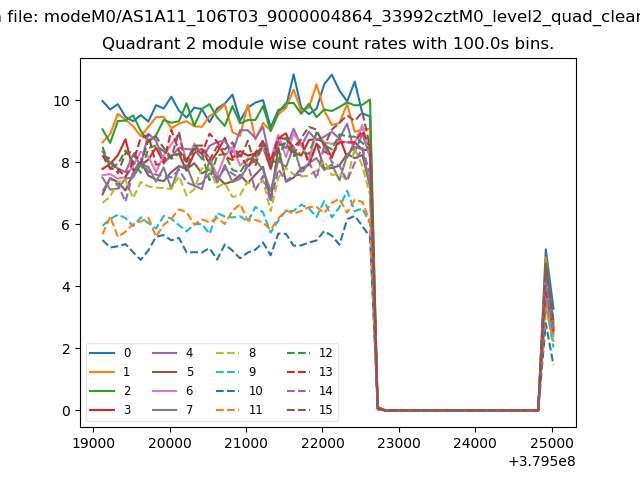
| Module-wise count rates for Quadrant B Data is divided into 100 sec bins |
 |
 |
| Module-wise count rates for Quadrant C Data is divided into 100 sec bins |
 |
 |
| Module-wise count rates for Quadrant D Data is divided into 100 sec bins |
 |
 |
| Parameter | Plot |
|---|---|
| CZT HV Monitor |  |
| D_VDD |  |
| Temperature 1 | 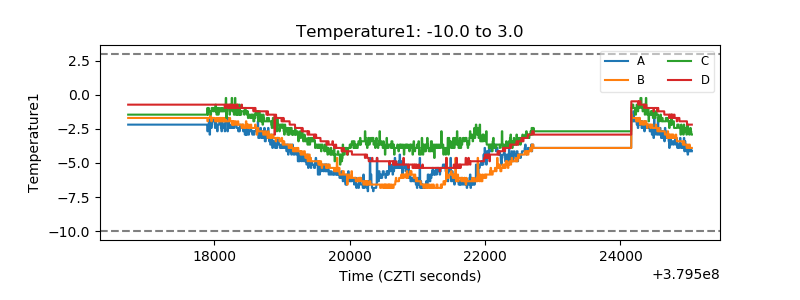 |
| Veto HV Monitor | 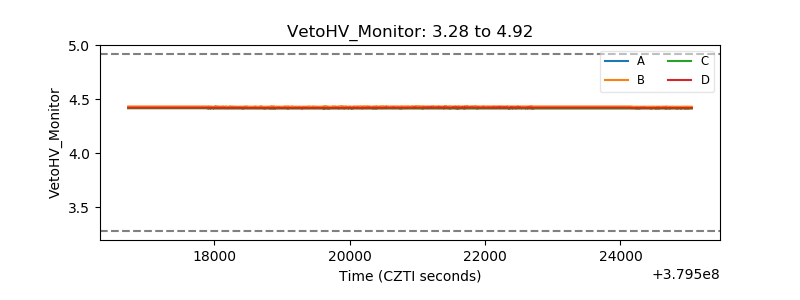 |
| Veto LLD |  |
| Alpha Counter | 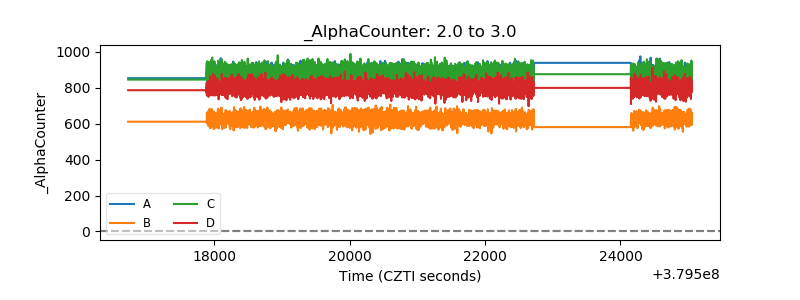 |
| _CPM_Rate | 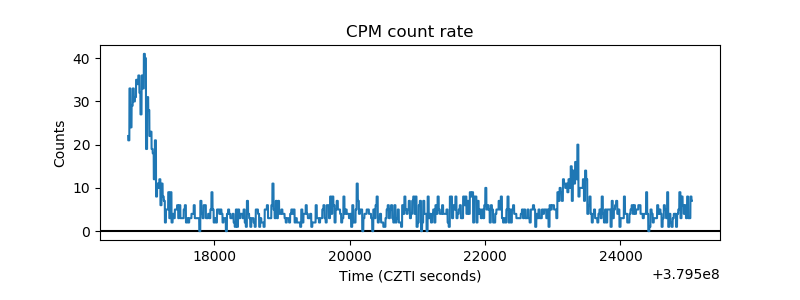 |
| CZT Counter | 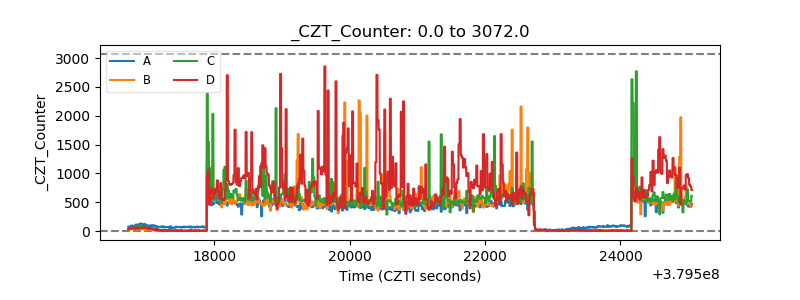 |
| +2.5 Volts monitor |  |
| +5 Volts monitor |  |
| _ROLL_ROT | 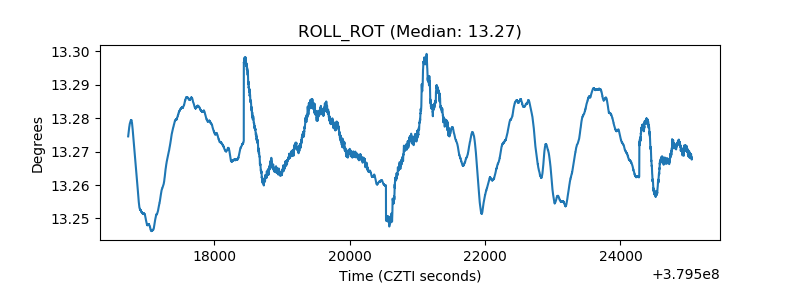 |
| _Roll_DEC | 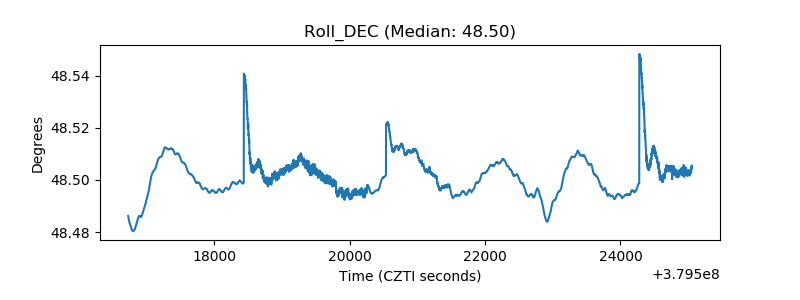 |
| _Roll_RA | 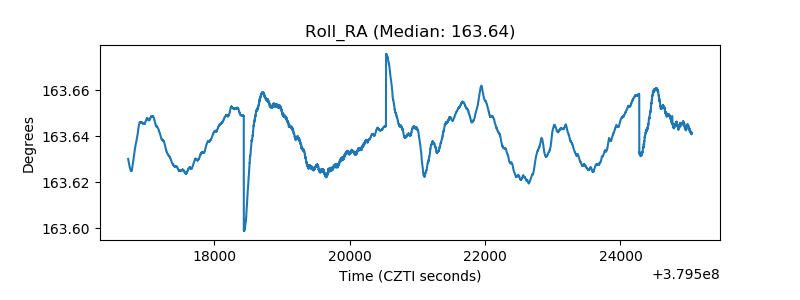 |
| Veto Counter |  |