| Param | Original file | Final file |
|---|---|---|
| Filename | modeM0/AS1A11_106T03_9000004864_33993cztM0_level2.evt | modeM0/AS1A11_106T03_9000004864_33993cztM0_level2_quad_clean.evt |
| Size (bytes) | 534,697,920 | 89,066,880 |
| Size | 509.9 MB | 84.9 MB |
| Events in quadrant A | 3,829,213 | 562,338 |
| Events in quadrant B | 3,406,745 | 588,729 |
| Events in quadrant C | 3,403,737 | 583,658 |
| Events in quadrant D | 5,150,473 | 546,710 |
| Mode M9 | |||
|---|---|---|---|
| Quadrant | BADHDUFLAG | Total packets | Discarded packets |
| A | 0 | 29 | 0 |
| B | 0 | 29 | 0 |
| C | 0 | 29 | 0 |
| D | 0 | 29 | 0 |
| Mode M0 | |||
|---|---|---|---|
| Quadrant | BADHDUFLAG | Total packets | Discarded packets |
| A | 0 | 15386 | 2 |
| B | 0 | 14024 | 1 |
| C | 0 | 13604 | 1 |
| D | 0 | 19446 | 1 |
| Mode SS | |||
|---|---|---|---|
| Quadrant | BADHDUFLAG | Total packets | Discarded packets |
| A | 0 | 120 | 0 |
| B | 0 | 120 | 0 |
| C | 0 | 120 | 0 |
| D | 0 | 120 | 0 |
| Quadrant | Total seconds | Saturated seconds | Saturation percentage |
|---|---|---|---|
| A | 5959 | 529 | 8.877328% |
| B | 5959 | 102 | 1.711697% |
| C | 5959 | 106 | 1.778822% |
| D | 5959 | 324 | 5.437154% |
Noise dominated data is calculated using 1-second bins in cleaned event files. If a bin has >2000 counts, and if more than 50% of those come from <1% of pixels, then it is considered to be noise-dominated and hence unusable.
| Quadrant | # 1 sec bins | Bins with >0 counts | Bins with >2000 counts | High rate bins dominated by noise | Noise dominated (total time) | Noise dominated (detector-on time) | Marked lightcurve |
|---|---|---|---|---|---|---|---|
| A | 8704 | 5961 | 398 | 398 | 4.57% | 6.68% | 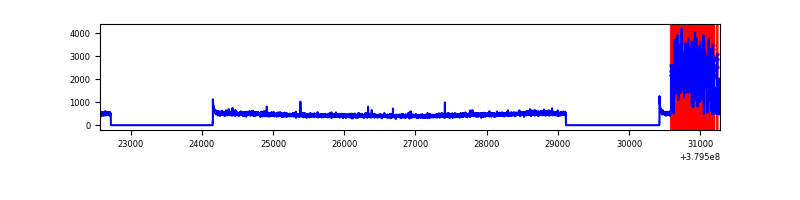 |
| B | 8704 | 5961 | 64 | 64 | 0.74% | 1.07% | 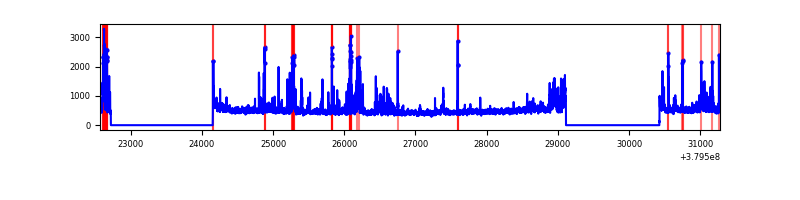 |
| C | 8704 | 5961 | 76 | 76 | 0.87% | 1.27% | 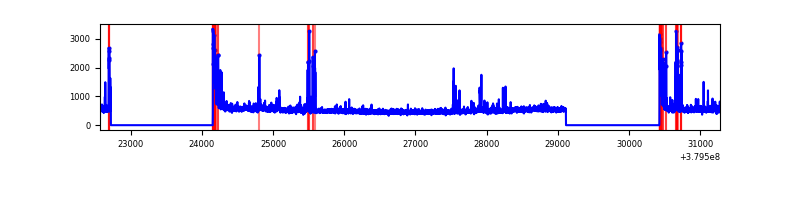 |
| D | 8704 | 5961 | 279 | 279 | 3.21% | 4.68% | 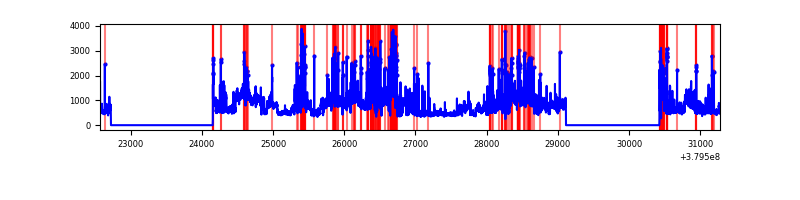 |
Top three noisy pixels from each quadrant. If the there are fewer than three noisy pixels in the level2.evt file, extra rows are filled as -1
| Pixel properties | Quadrant properties | ||||||
|---|---|---|---|---|---|---|---|
| Quadrant | DetID | PixID | Counts | Sigma | Mean | Median | Sigma |
| A | 14 | 238 | 1253106 | 9419.52 | 657 | 645 | 133.0 |
| A | 10 | 83 | 17725 | 128.46 | 657 | 645 | 133.0 |
| A | 13 | 6 | 15858 | 114.41 | 657 | 645 | 133.0 |
| B | 5 | 172 | 200086 | 1513.96 | 688 | 672 | 131.7 |
| B | 5 | 31 | 92943 | 700.53 | 688 | 672 | 131.7 |
| B | 5 | 15 | 90162 | 679.41 | 688 | 672 | 131.7 |
| C | 0 | 10 | 270537 | 1736.22 | 670 | 674 | 155.4 |
| C | 15 | 214 | 254125 | 1630.63 | 670 | 674 | 155.4 |
| C | 3 | 233 | 142673 | 913.58 | 670 | 674 | 155.4 |
| D | 8 | 195 | 1258751 | 7137.35 | 657 | 643 | 176.3 |
| D | 12 | 6 | 460099 | 2606.53 | 657 | 643 | 176.3 |
| D | 13 | 249 | 361805 | 2048.9 | 657 | 643 | 176.3 |
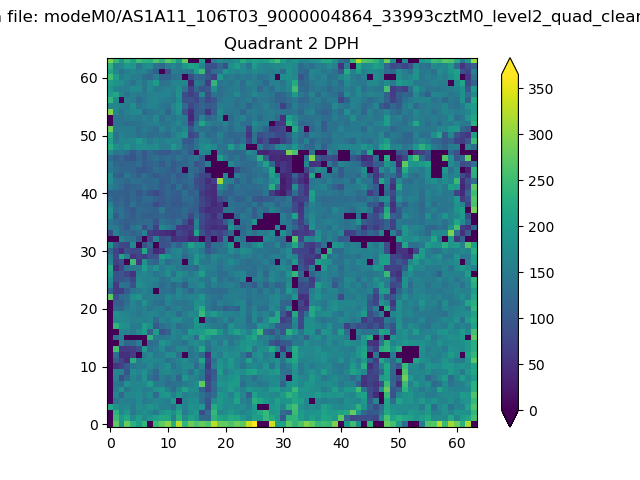
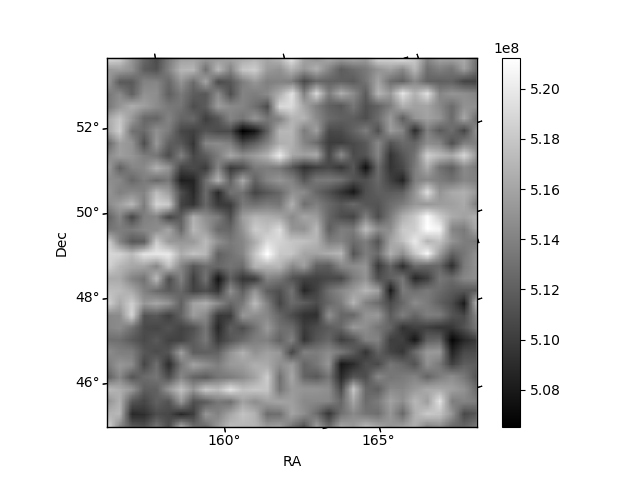
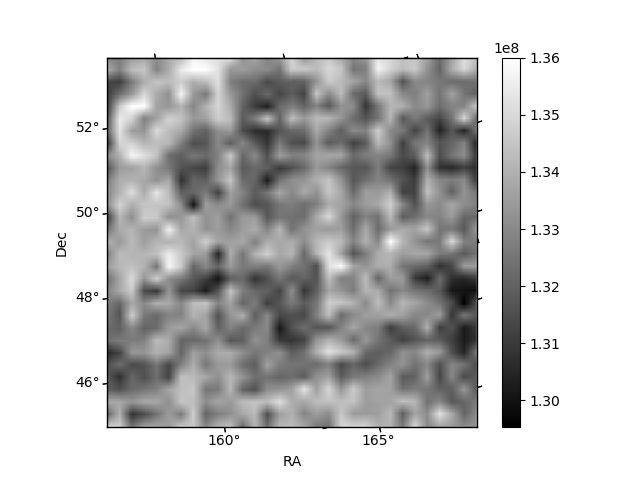
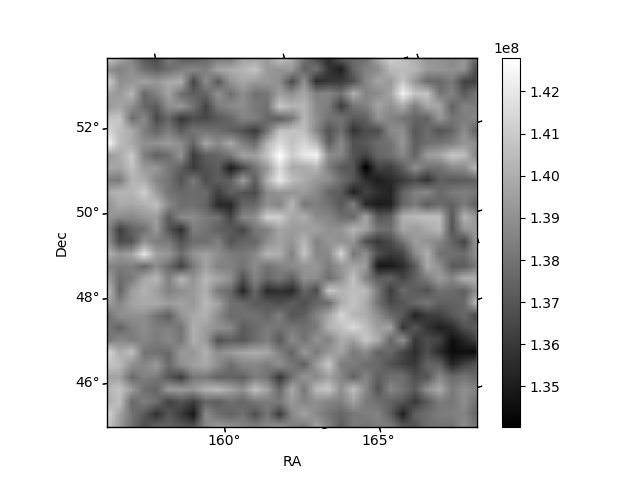
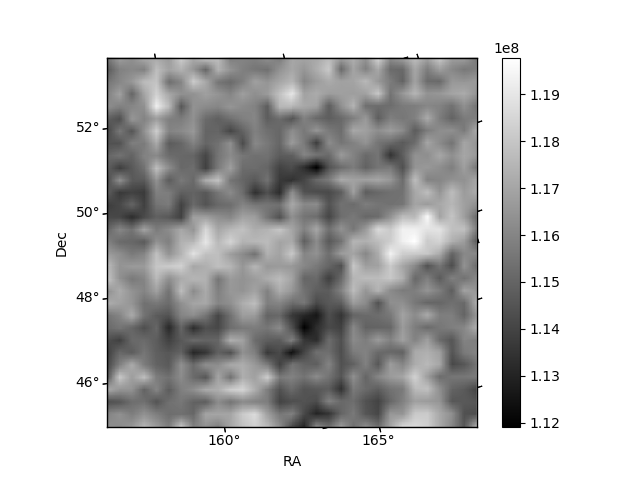
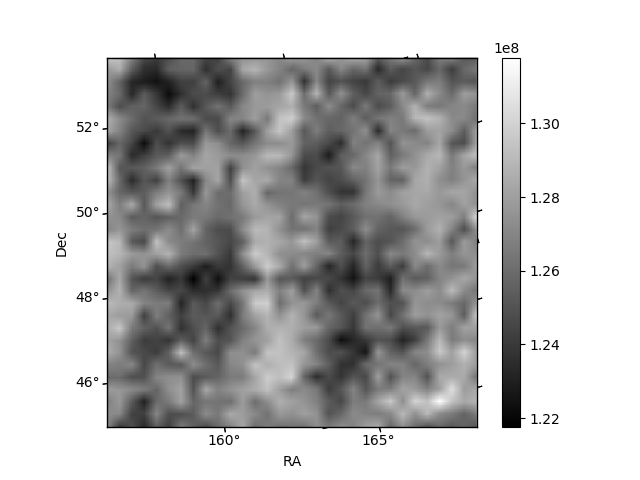
Histogram calculated using DETX and DETY for each event in the final _common_clean file
| Quadrant A | 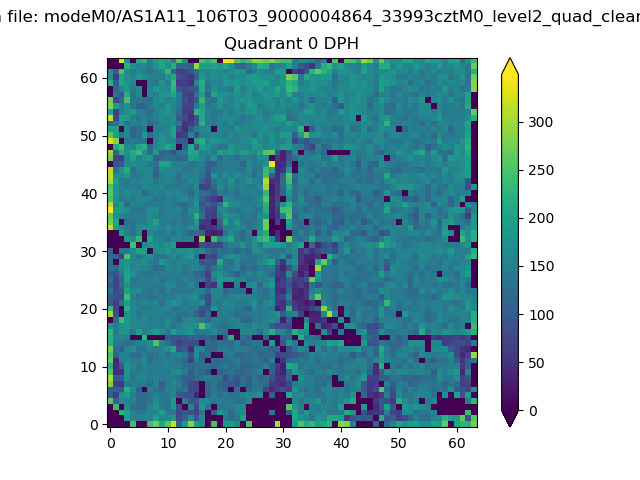 |
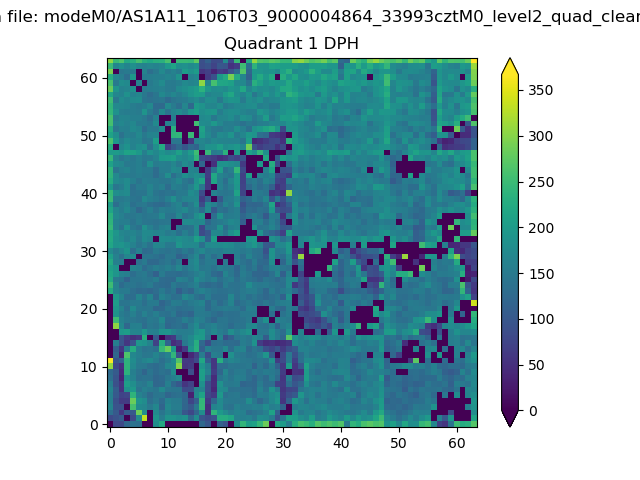 |
Quadrant B |
|---|---|---|---|
| Quadrant D | 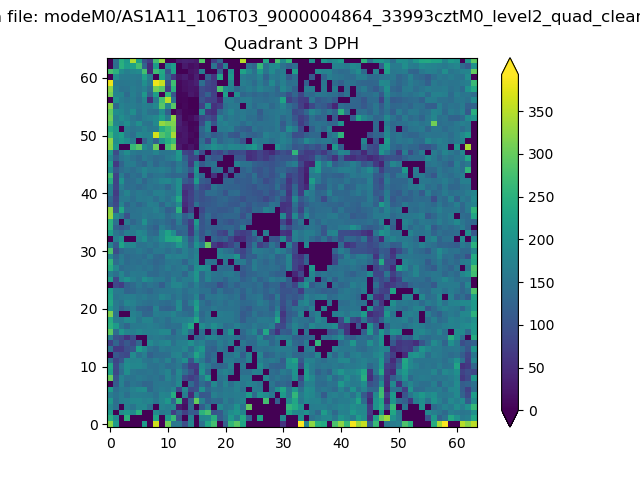 |
 |
Quadrant C |
| Plot type | Count rate plots | Images |
|---|---|---|
| Comparison with Poisson distribution Blue bars denote a histogram of data divided into 1 sec bins. Red curve is a Poisson curve with rate = median count rate of data. |
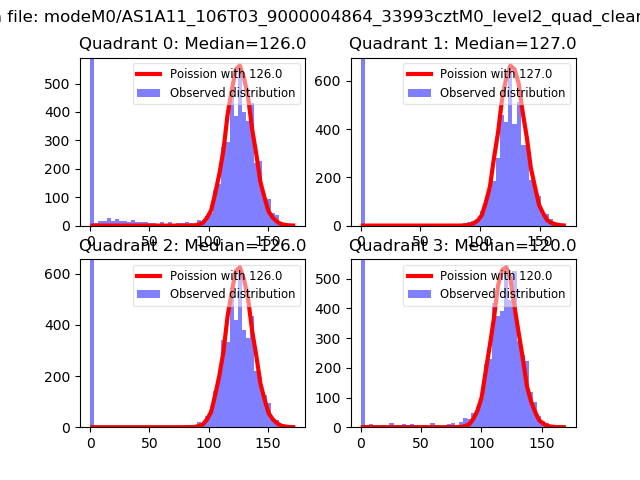 |
 |
| Quadrant-wise count rates Data is divided into 100 sec bins |
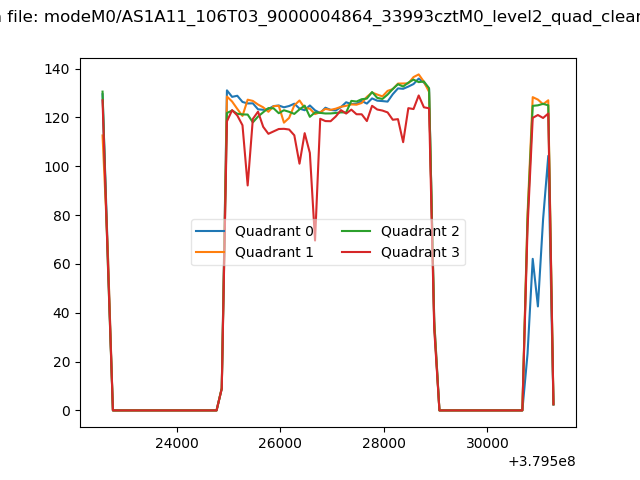 |
|
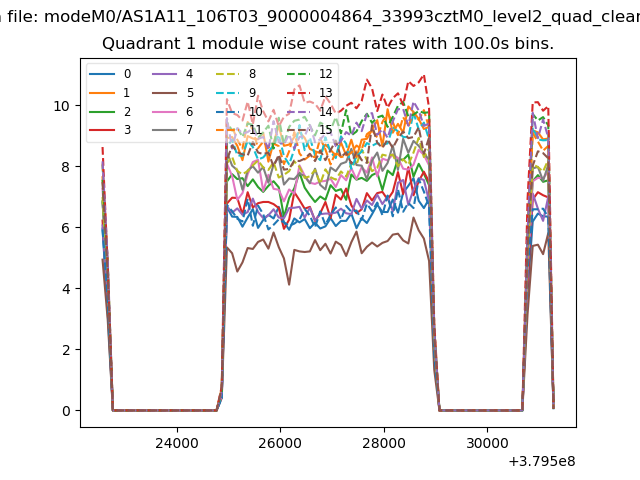
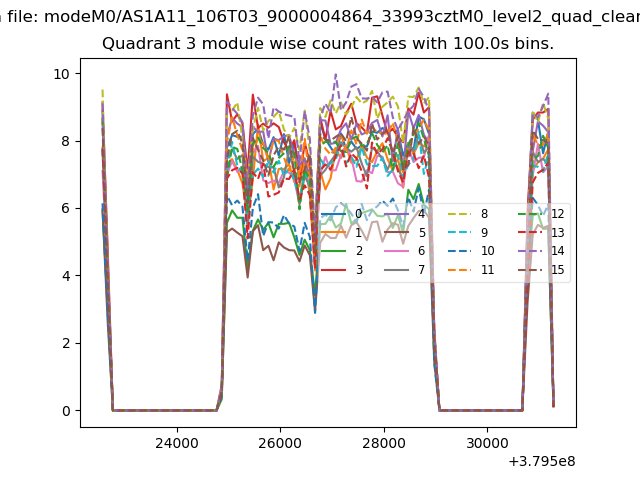
| Module-wise count rates for Quadrant A Data is divided into 100 sec bins |
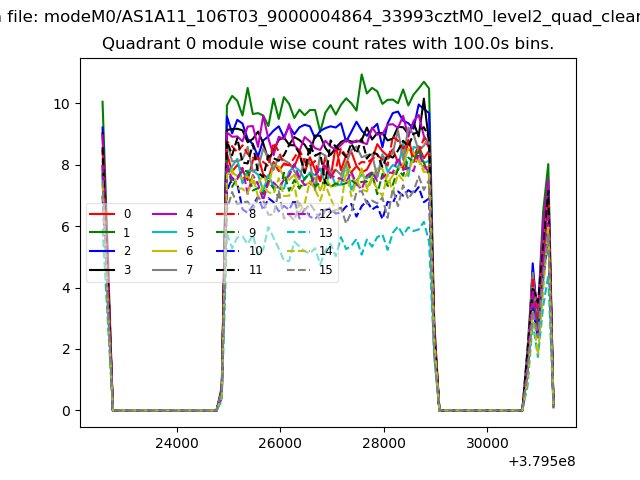 |
 |
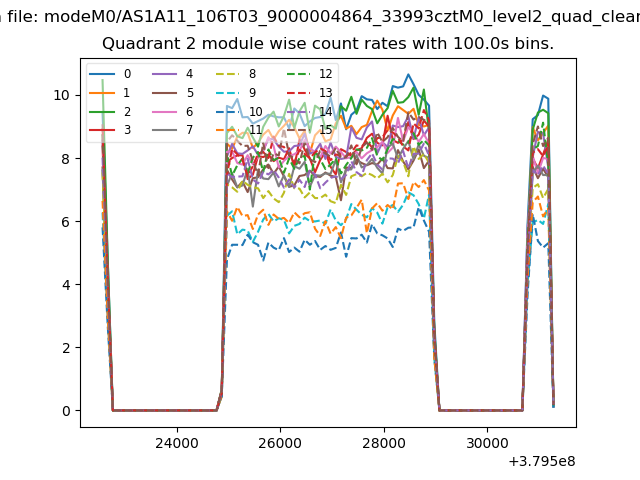
| Module-wise count rates for Quadrant B Data is divided into 100 sec bins |
 |
 |
| Module-wise count rates for Quadrant C Data is divided into 100 sec bins |
 |
 |
| Module-wise count rates for Quadrant D Data is divided into 100 sec bins |
 |
 |
| Parameter | Plot |
|---|---|
| CZT HV Monitor | 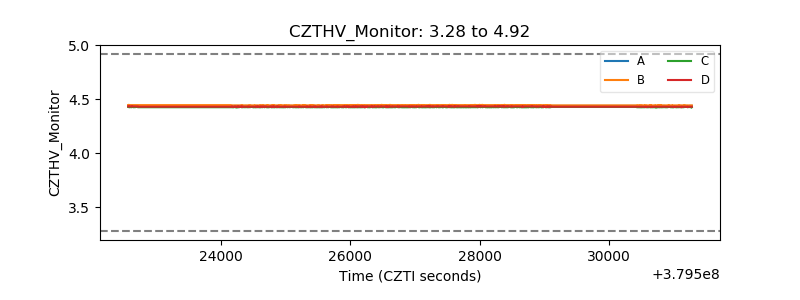 |
| D_VDD | 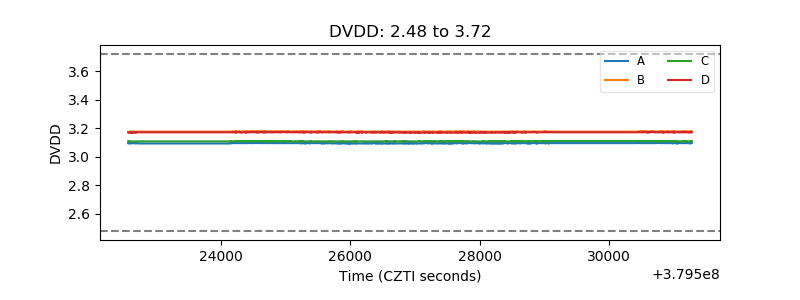 |
| Temperature 1 | 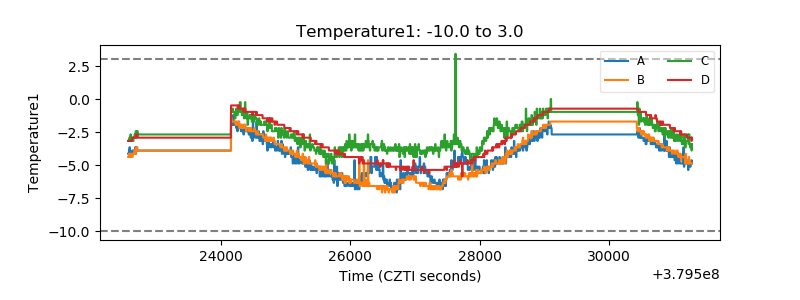 |
| Veto HV Monitor | 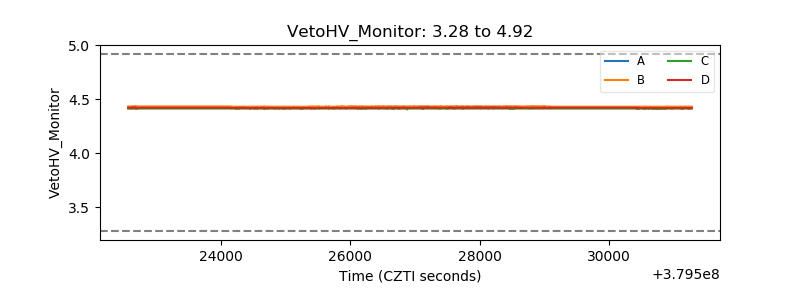 |
| Veto LLD | 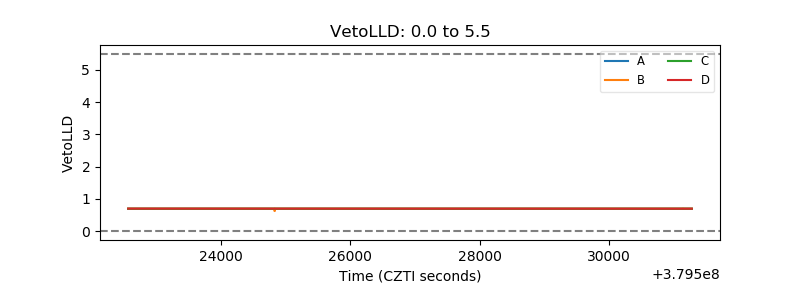 |
| Alpha Counter | 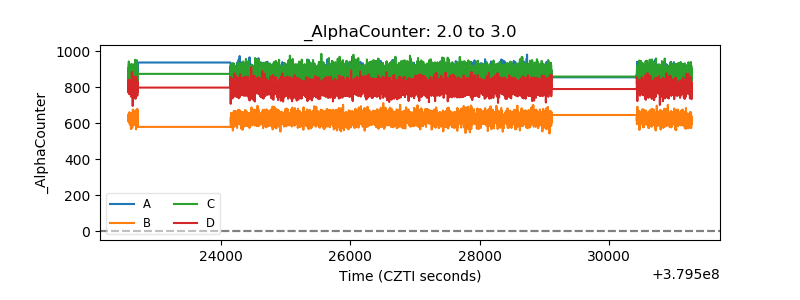 |
| _CPM_Rate | 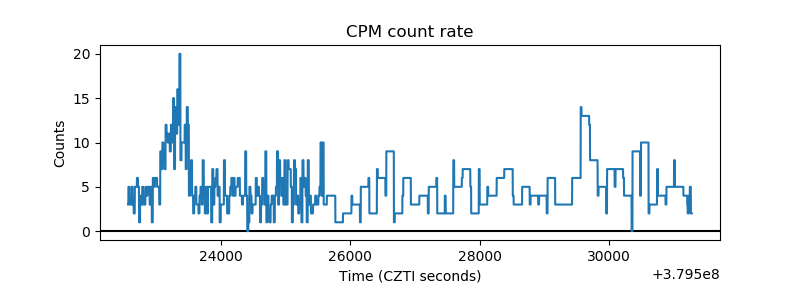 |
| CZT Counter | 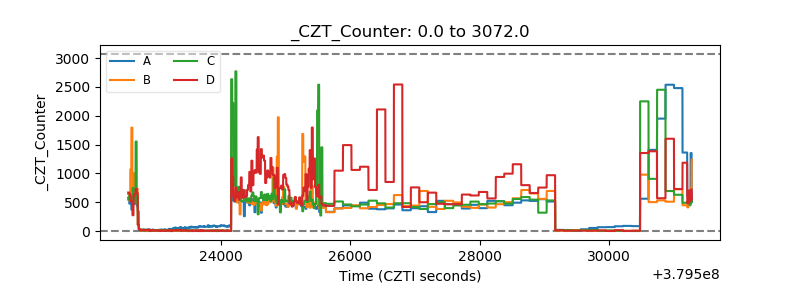 |
| +2.5 Volts monitor |  |
| +5 Volts monitor |  |
| _ROLL_ROT | 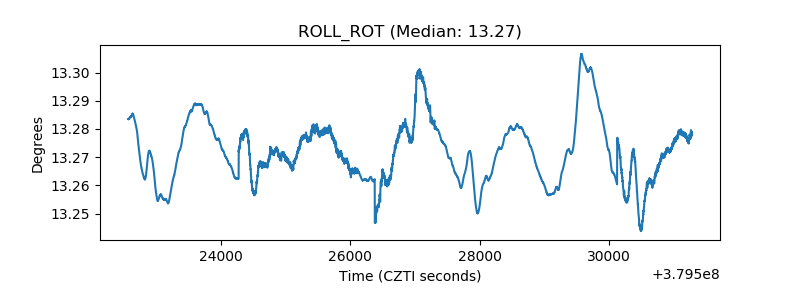 |
| _Roll_DEC | 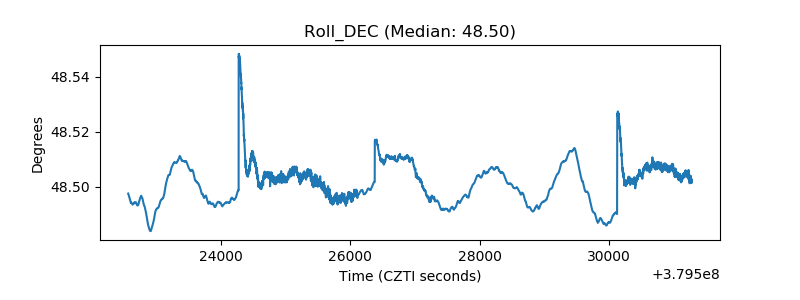 |
| _Roll_RA | 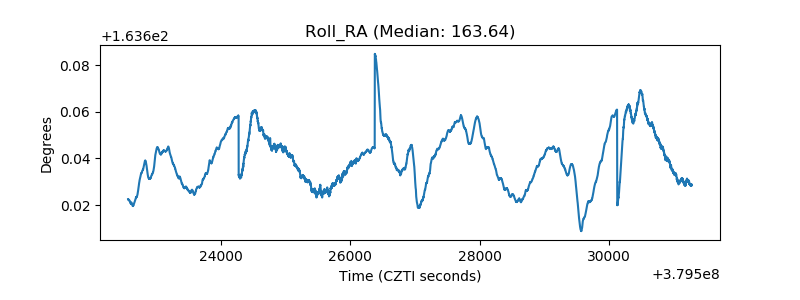 |
| Veto Counter | 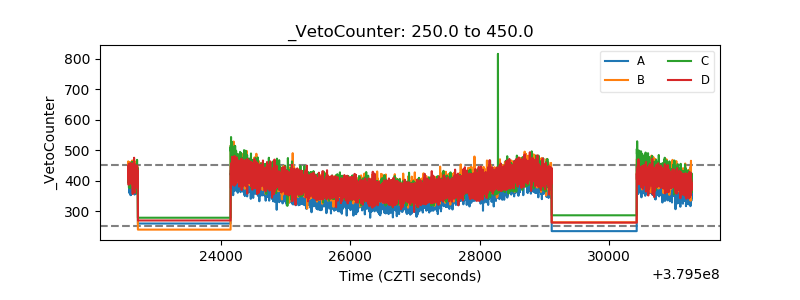 |