| Param | Original file | Final file |
|---|---|---|
| Filename | modeM0/AS1A11_106T03_9000004864_33997cztM0_level2.evt | modeM0/AS1A11_106T03_9000004864_33997cztM0_level2_quad_clean.evt |
| Size (bytes) | 723,775,680 | 103,288,320 |
| Size | 690.2 MB | 98.5 MB |
| Events in quadrant A | 4,157,626 | 653,623 |
| Events in quadrant B | 4,583,885 | 662,697 |
| Events in quadrant C | 5,075,763 | 648,599 |
| Events in quadrant D | 7,556,674 | 601,532 |
| Mode M9 | |||
|---|---|---|---|
| Quadrant | BADHDUFLAG | Total packets | Discarded packets |
| A | 0 | 31 | 0 |
| B | 0 | 31 | 0 |
| C | 0 | 31 | 0 |
| D | 0 | 31 | 0 |
| Mode M0 | |||
|---|---|---|---|
| Quadrant | BADHDUFLAG | Total packets | Discarded packets |
| A | 0 | 17862 | 3 |
| B | 0 | 18943 | 2 |
| C | 0 | 20147 | 2 |
| D | 0 | 28154 | 2 |
| Mode SS | |||
|---|---|---|---|
| Quadrant | BADHDUFLAG | Total packets | Discarded packets |
| A | 0 | 164 | 0 |
| B | 0 | 164 | 0 |
| C | 0 | 164 | 0 |
| D | 0 | 164 | 0 |
| Quadrant | Total seconds | Saturated seconds | Saturation percentage |
|---|---|---|---|
| A | 8082 | 17 | 0.210344% |
| B | 8082 | 123 | 1.521901% |
| C | 8082 | 193 | 2.388023% |
| D | 8082 | 532 | 6.582529% |
Noise dominated data is calculated using 1-second bins in cleaned event files. If a bin has >2000 counts, and if more than 50% of those come from <1% of pixels, then it is considered to be noise-dominated and hence unusable.
| Quadrant | # 1 sec bins | Bins with >0 counts | Bins with >2000 counts | High rate bins dominated by noise | Noise dominated (total time) | Noise dominated (detector-on time) | Marked lightcurve |
|---|---|---|---|---|---|---|---|
| A | 11156 | 8084 | 0 | 0 | 0.00% | 0.00% | 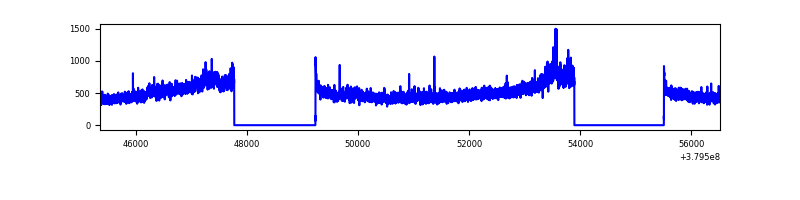 |
| B | 11156 | 8084 | 60 | 60 | 0.54% | 0.74% | 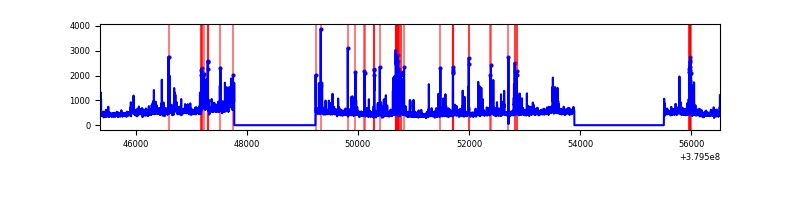 |
| C | 11156 | 8084 | 174 | 174 | 1.56% | 2.15% | 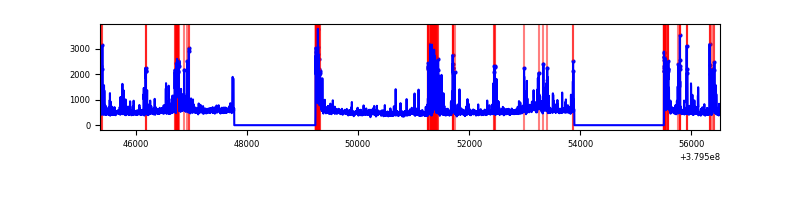 |
| D | 11156 | 8084 | 501 | 501 | 4.49% | 6.20% | 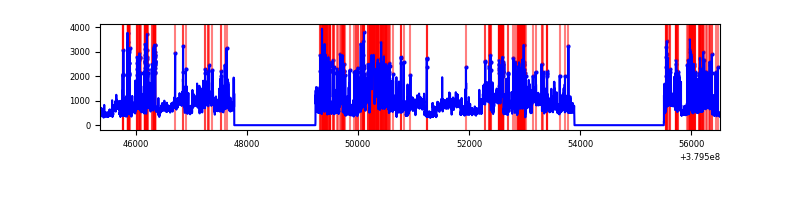 |
Top three noisy pixels from each quadrant. If the there are fewer than three noisy pixels in the level2.evt file, extra rows are filled as -1
| Pixel properties | Quadrant properties | ||||||
|---|---|---|---|---|---|---|---|
| Quadrant | DetID | PixID | Counts | Sigma | Mean | Median | Sigma |
| A | 15 | 169 | 501311 | 2673.36 | 937 | 918 | 187.2 |
| A | 13 | 6 | 17897 | 90.71 | 937 | 918 | 187.2 |
| A | 10 | 83 | 17705 | 89.68 | 937 | 918 | 187.2 |
| B | 5 | 172 | 185892 | 1045.8 | 929 | 905 | 176.9 |
| B | 0 | 189 | 142048 | 797.93 | 929 | 905 | 176.9 |
| B | 0 | 190 | 121832 | 683.64 | 929 | 905 | 176.9 |
| C | 4 | 254 | 539928 | 2611.5 | 897 | 907 | 206.4 |
| C | 15 | 214 | 341783 | 1651.51 | 897 | 907 | 206.4 |
| C | 0 | 10 | 256616 | 1238.88 | 897 | 907 | 206.4 |
| D | 8 | 195 | 1805606 | 7684.24 | 878 | 859 | 234.9 |
| D | 13 | 249 | 495923 | 2107.88 | 878 | 859 | 234.9 |
| D | 12 | 6 | 490801 | 2086.07 | 878 | 859 | 234.9 |
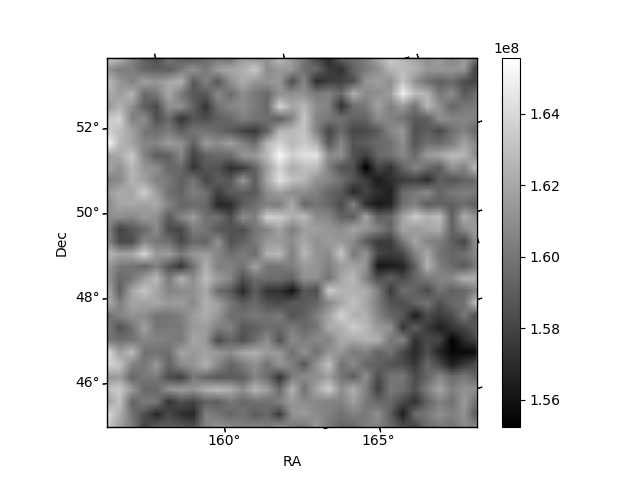
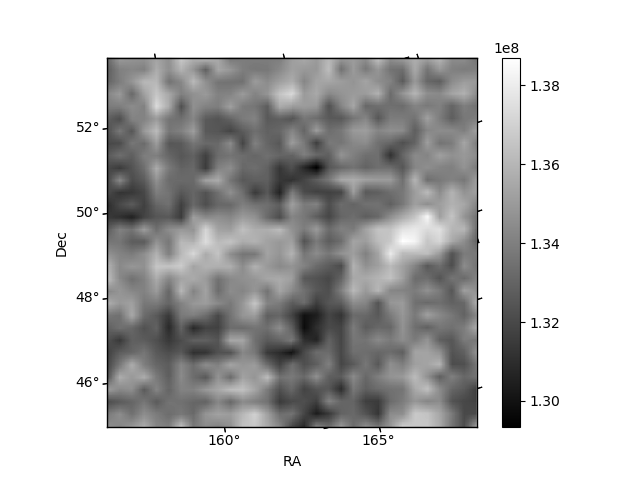
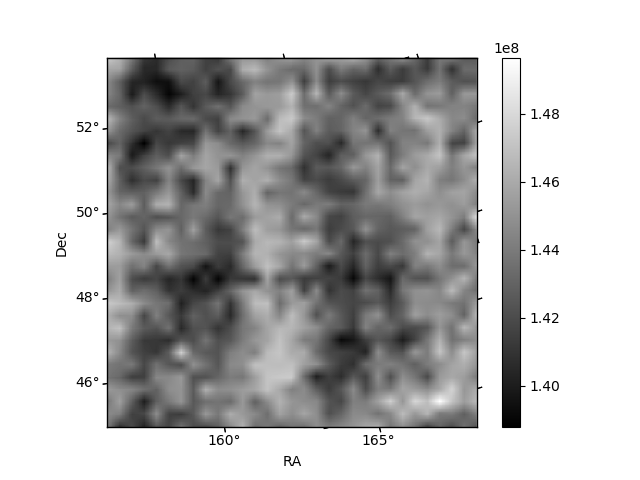
Histogram calculated using DETX and DETY for each event in the final _common_clean file
| Quadrant A | 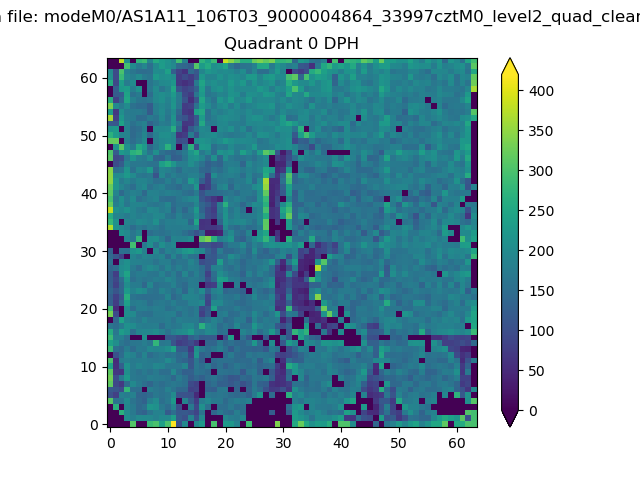 |
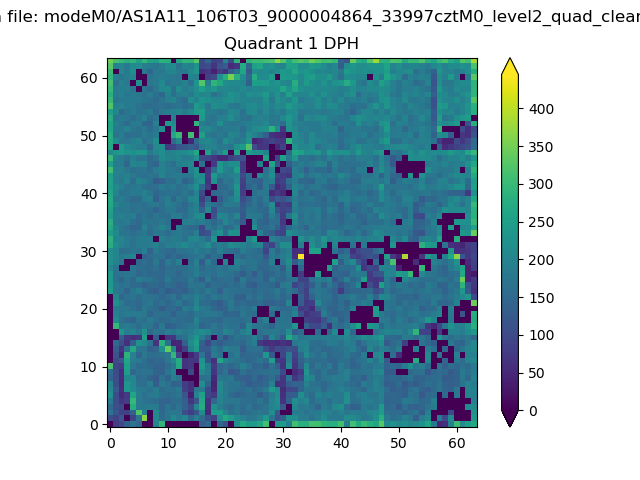 |
Quadrant B |
|---|---|---|---|
| Quadrant D | 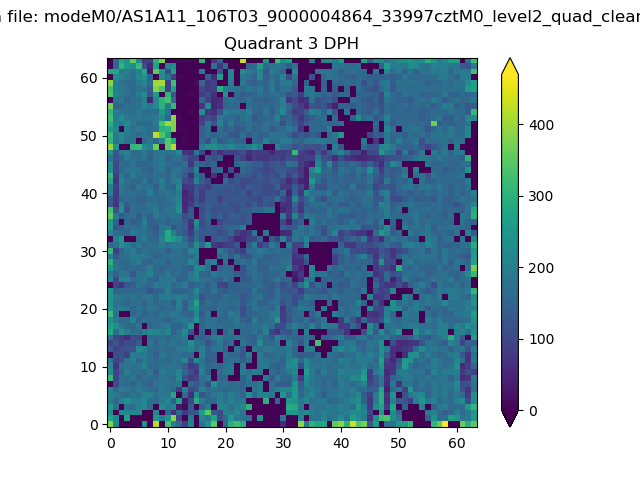 |
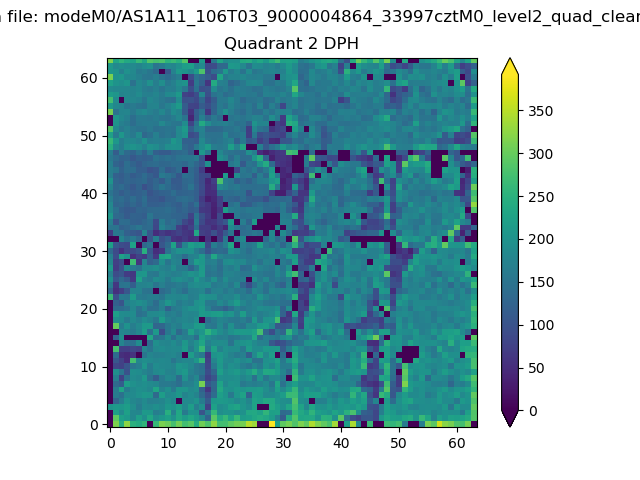 |
Quadrant C |
| Plot type | Count rate plots | Images |
|---|---|---|
| Comparison with Poisson distribution Blue bars denote a histogram of data divided into 1 sec bins. Red curve is a Poisson curve with rate = median count rate of data. |
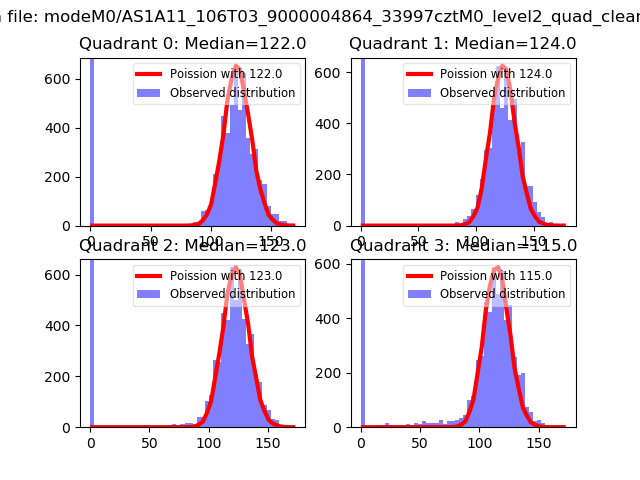 |
 |
| Quadrant-wise count rates Data is divided into 100 sec bins |
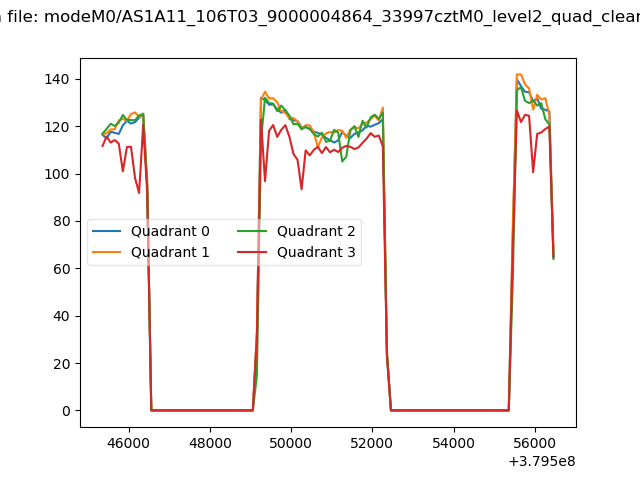 |
|
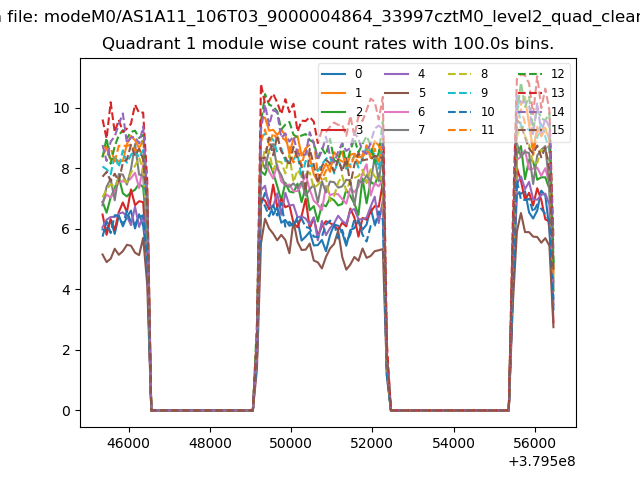
| Module-wise count rates for Quadrant A Data is divided into 100 sec bins |
 |
 |
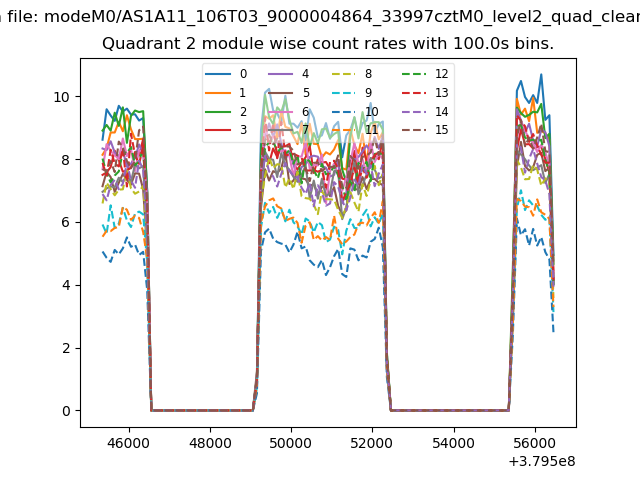
| Module-wise count rates for Quadrant B Data is divided into 100 sec bins |
 |
 |
| Module-wise count rates for Quadrant C Data is divided into 100 sec bins |
 |
 |
| Module-wise count rates for Quadrant D Data is divided into 100 sec bins |
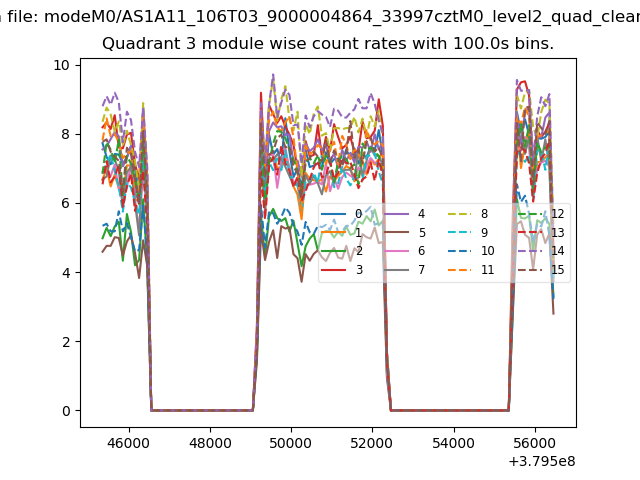 |
 |
| Parameter | Plot |
|---|---|
| CZT HV Monitor | 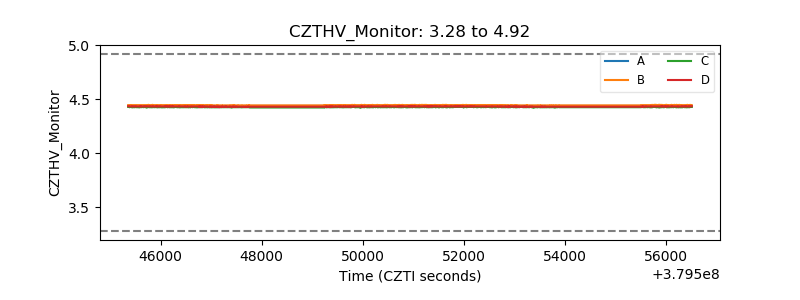 |
| D_VDD | 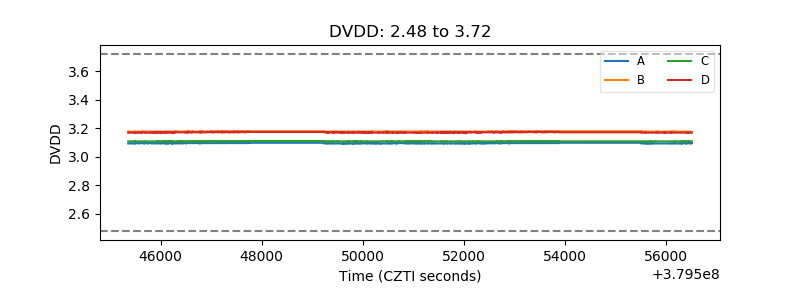 |
| Temperature 1 | 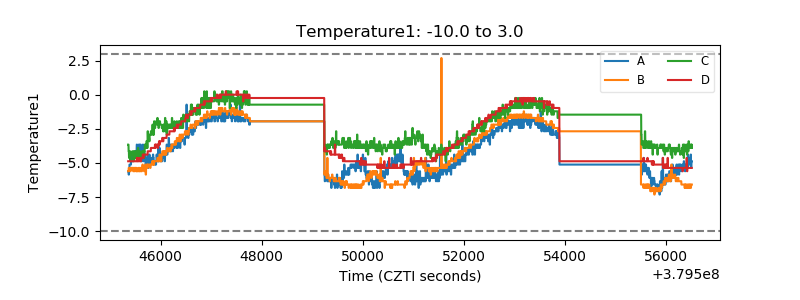 |
| Veto HV Monitor | 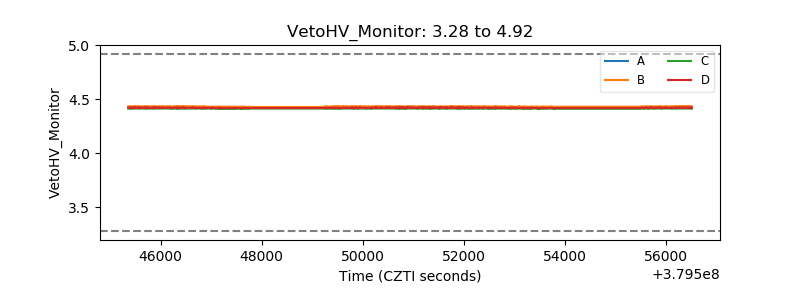 |
| Veto LLD | 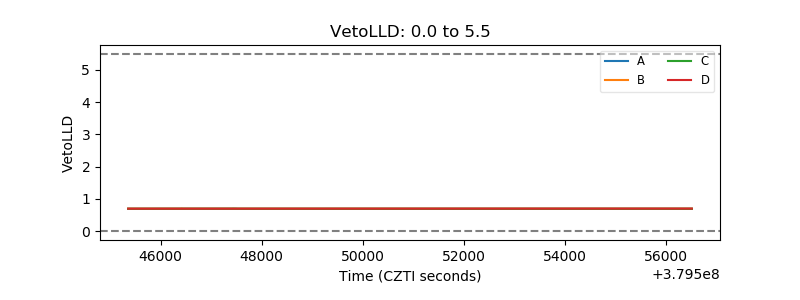 |
| Alpha Counter | 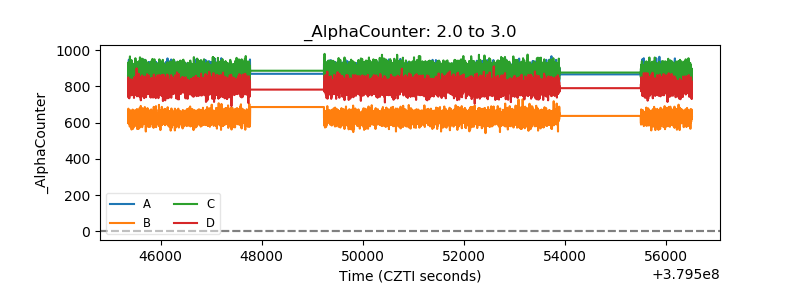 |
| _CPM_Rate | 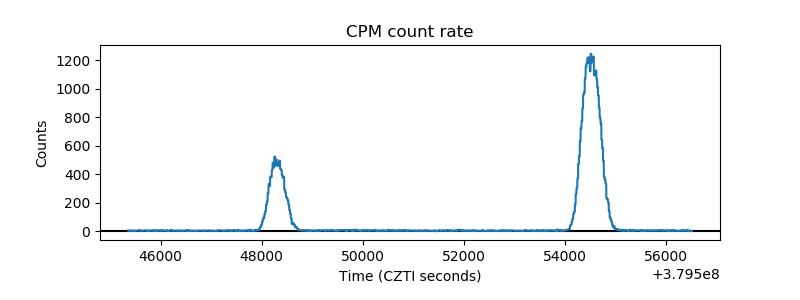 |
| CZT Counter | 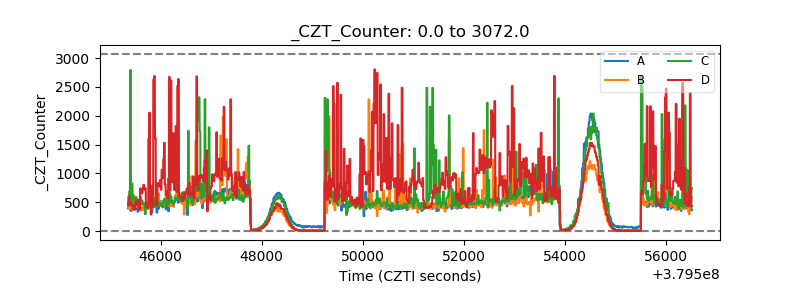 |
| +2.5 Volts monitor |  |
| +5 Volts monitor |  |
| _ROLL_ROT |  |
| _Roll_DEC | 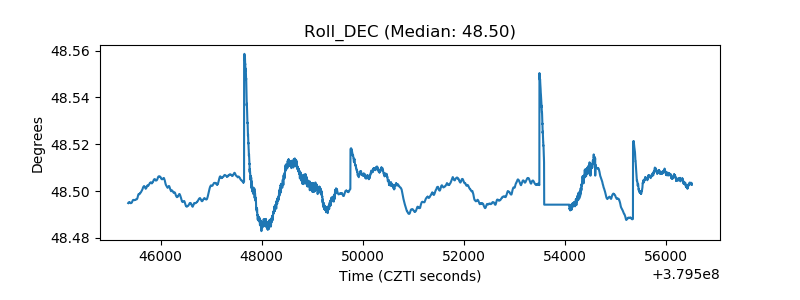 |
| _Roll_RA | 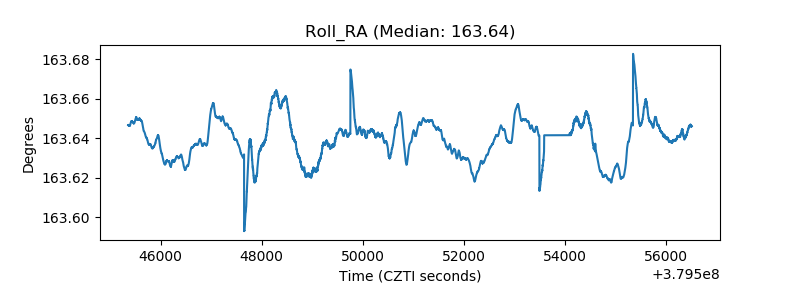 |
| Veto Counter |  |