| Param | Original file | Final file |
|---|---|---|
| Filename | modeM0/AS1A11_106T03_9000004864_33999cztM0_level2.evt | modeM0/AS1A11_106T03_9000004864_33999cztM0_level2_quad_clean.evt |
| Size (bytes) | 488,825,280 | 76,109,760 |
| Size | 466.2 MB | 72.6 MB |
| Events in quadrant A | 2,558,445 | 488,504 |
| Events in quadrant B | 3,056,194 | 498,081 |
| Events in quadrant C | 3,913,219 | 475,104 |
| Events in quadrant D | 4,895,963 | 450,435 |
| Mode M9 | |||
|---|---|---|---|
| Quadrant | BADHDUFLAG | Total packets | Discarded packets |
| A | 0 | 30 | 0 |
| B | 0 | 30 | 0 |
| C | 0 | 30 | 0 |
| D | 0 | 31 | 0 |
| Mode M0 | |||
|---|---|---|---|
| Quadrant | BADHDUFLAG | Total packets | Discarded packets |
| A | 0 | 11357 | 3 |
| B | 0 | 12775 | 2 |
| C | 0 | 15057 | 2 |
| D | 0 | 18500 | 2 |
| Mode SS | |||
|---|---|---|---|
| Quadrant | BADHDUFLAG | Total packets | Discarded packets |
| A | 0 | 116 | 0 |
| B | 0 | 116 | 0 |
| C | 0 | 116 | 0 |
| D | 0 | 116 | 0 |
| Quadrant | Total seconds | Saturated seconds | Saturation percentage |
|---|---|---|---|
| A | 5604 | 7 | 0.124911% |
| B | 5604 | 63 | 1.124197% |
| C | 5604 | 223 | 3.979300% |
| D | 5604 | 216 | 3.854390% |
Noise dominated data is calculated using 1-second bins in cleaned event files. If a bin has >2000 counts, and if more than 50% of those come from <1% of pixels, then it is considered to be noise-dominated and hence unusable.
| Quadrant | # 1 sec bins | Bins with >0 counts | Bins with >2000 counts | High rate bins dominated by noise | Noise dominated (total time) | Noise dominated (detector-on time) | Marked lightcurve |
|---|---|---|---|---|---|---|---|
| A | 7337 | 5605 | 2 | 2 | 0.03% | 0.04% | 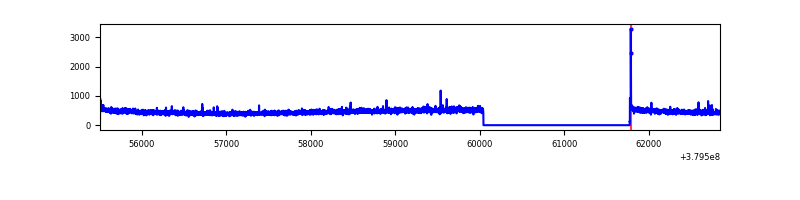 |
| B | 7337 | 5605 | 40 | 40 | 0.55% | 0.71% | 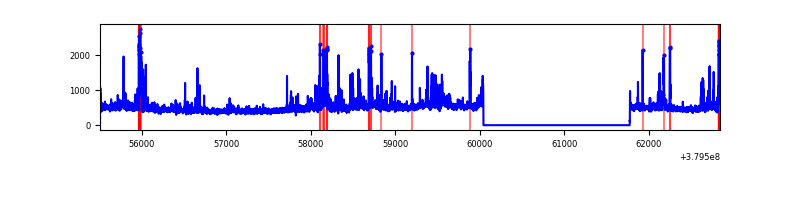 |
| C | 7337 | 5605 | 225 | 225 | 3.07% | 4.01% | 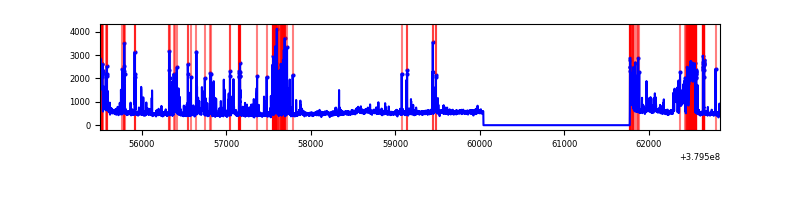 |
| D | 7337 | 5605 | 182 | 182 | 2.48% | 3.25% | 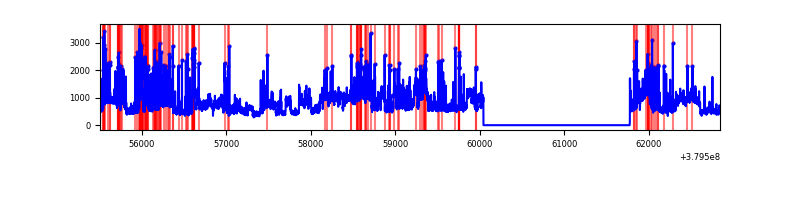 |
Top three noisy pixels from each quadrant. If the there are fewer than three noisy pixels in the level2.evt file, extra rows are filled as -1
| Pixel properties | Quadrant properties | ||||||
|---|---|---|---|---|---|---|---|
| Quadrant | DetID | PixID | Counts | Sigma | Mean | Median | Sigma |
| A | 15 | 169 | 22088 | 166.81 | 647 | 635 | 128.6 |
| A | 10 | 83 | 16128 | 120.46 | 647 | 635 | 128.6 |
| A | 13 | 6 | 14419 | 107.18 | 647 | 635 | 128.6 |
| B | 5 | 172 | 145516 | 1191.45 | 644 | 628 | 121.6 |
| B | 0 | 190 | 120565 | 986.27 | 644 | 628 | 121.6 |
| B | 15 | 201 | 51738 | 420.29 | 644 | 628 | 121.6 |
| C | 4 | 254 | 454013 | 3205.61 | 617 | 623 | 141.4 |
| C | 9 | 69 | 372393 | 2628.53 | 617 | 623 | 141.4 |
| C | 15 | 214 | 240524 | 1696.18 | 617 | 623 | 141.4 |
| D | 8 | 195 | 1371188 | 9072.34 | 614 | 599 | 151.1 |
| D | 13 | 249 | 521037 | 3444.94 | 614 | 599 | 151.1 |
| D | 12 | 6 | 131586 | 867.04 | 614 | 599 | 151.1 |
Histogram calculated using DETX and DETY for each event in the final _common_clean file
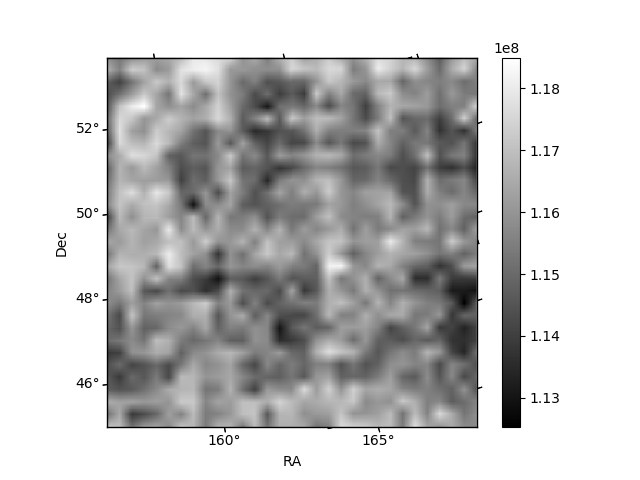
| Quadrant A | 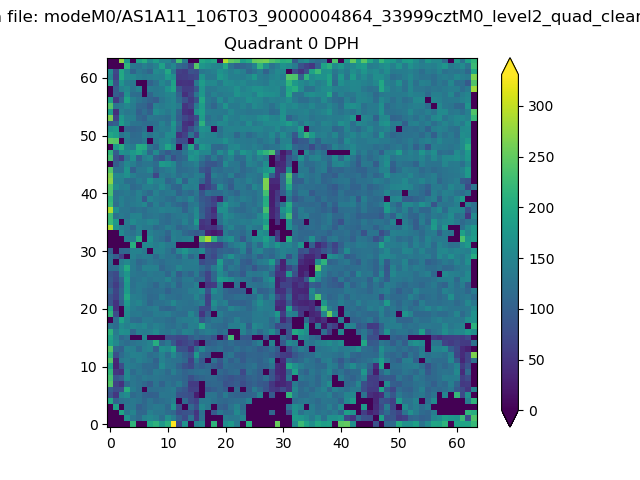 |
 |
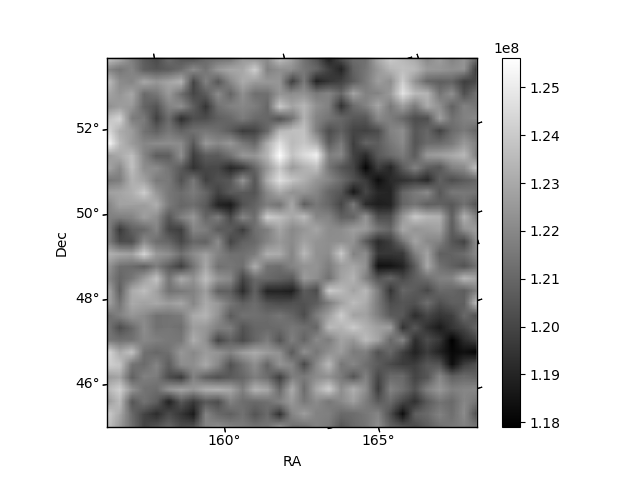
Quadrant B |
|---|---|---|---|
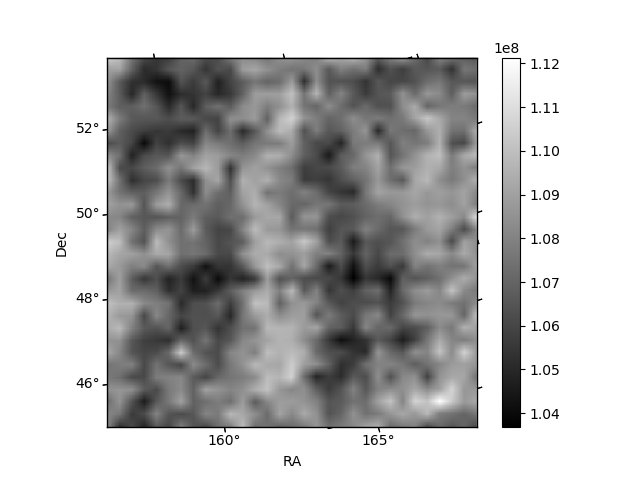
| Quadrant D | 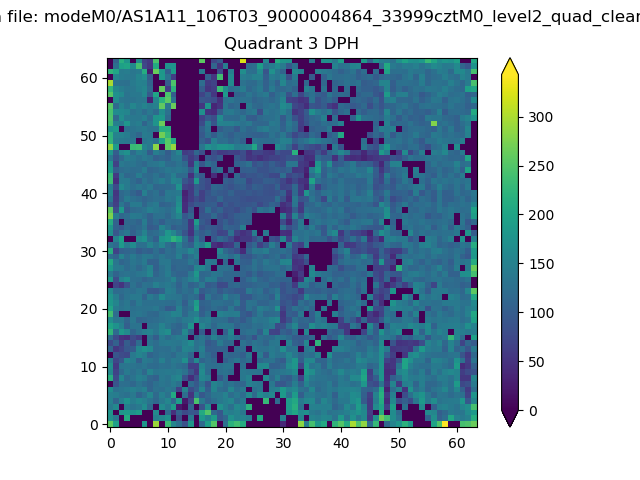 |
 |
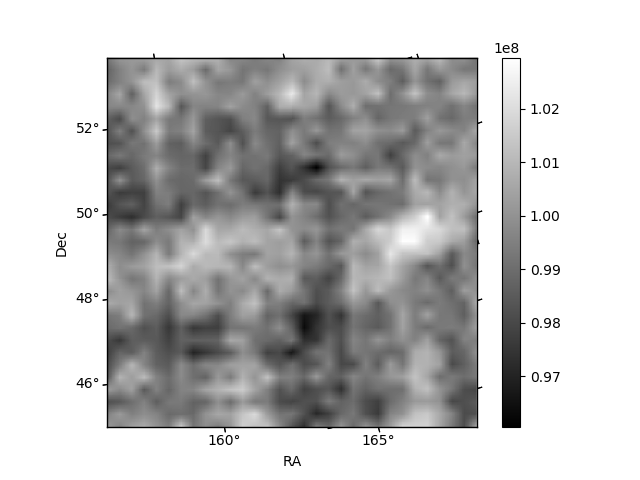
Quadrant C |
| Plot type | Count rate plots | Images |
|---|---|---|
| Comparison with Poisson distribution Blue bars denote a histogram of data divided into 1 sec bins. Red curve is a Poisson curve with rate = median count rate of data. |
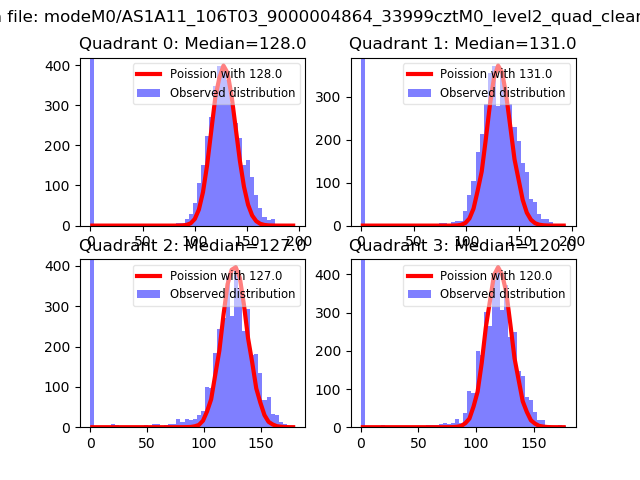 |
 |
| Quadrant-wise count rates Data is divided into 100 sec bins |
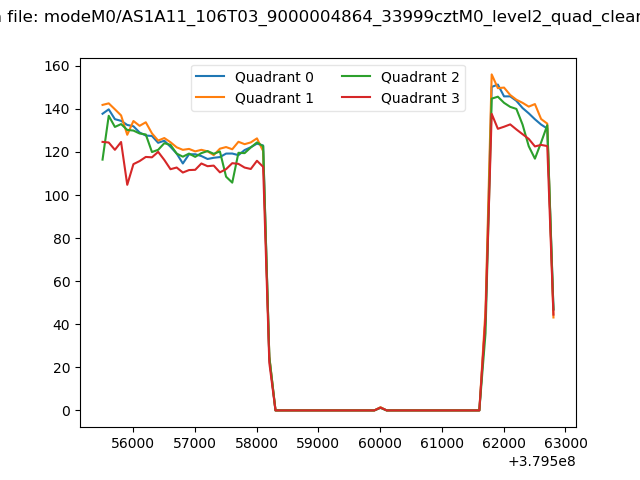 |
|
| Module-wise count rates for Quadrant A Data is divided into 100 sec bins |
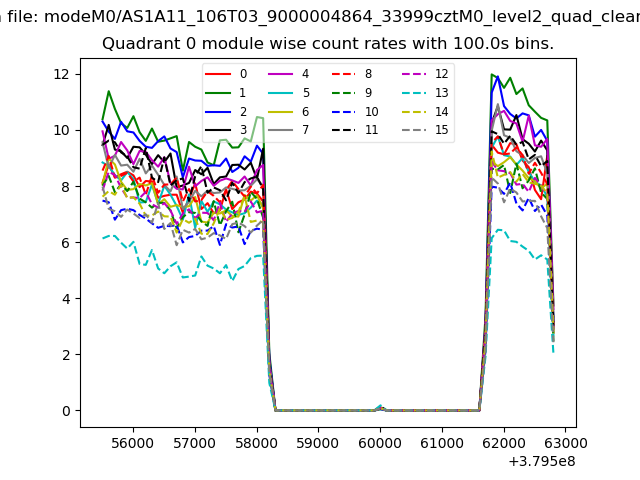 |
 |
| Module-wise count rates for Quadrant B Data is divided into 100 sec bins |
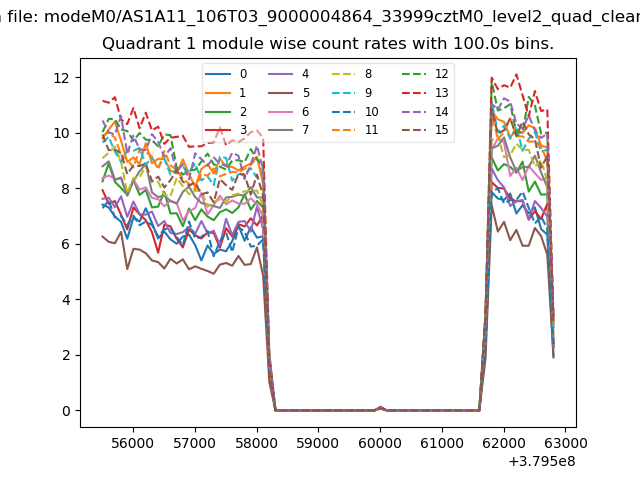 |
 |
| Module-wise count rates for Quadrant C Data is divided into 100 sec bins |
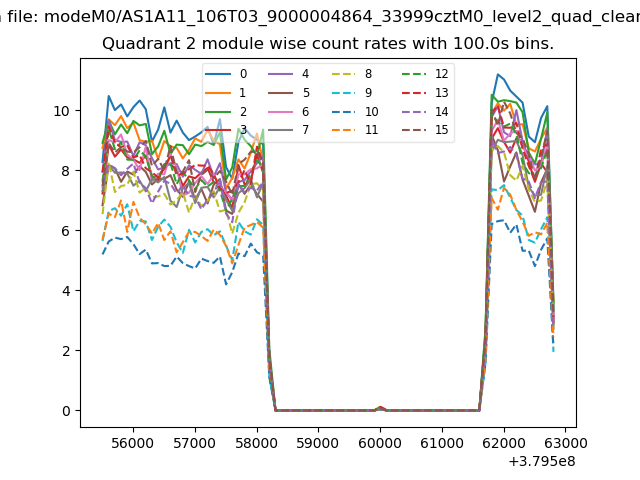 |
 |
| Module-wise count rates for Quadrant D Data is divided into 100 sec bins |
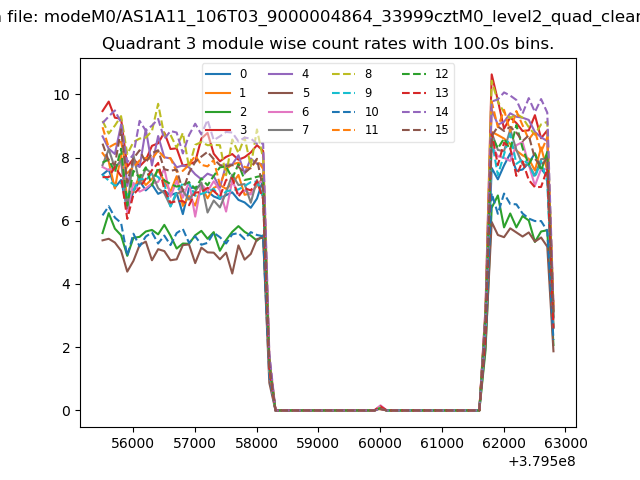 |
 |
| Parameter | Plot |
|---|---|
| CZT HV Monitor | 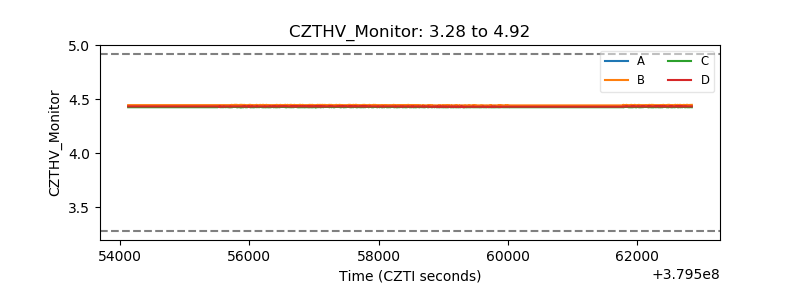 |
| D_VDD | 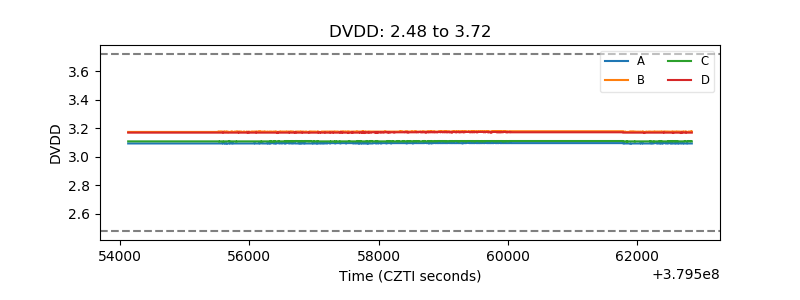 |
| Temperature 1 | 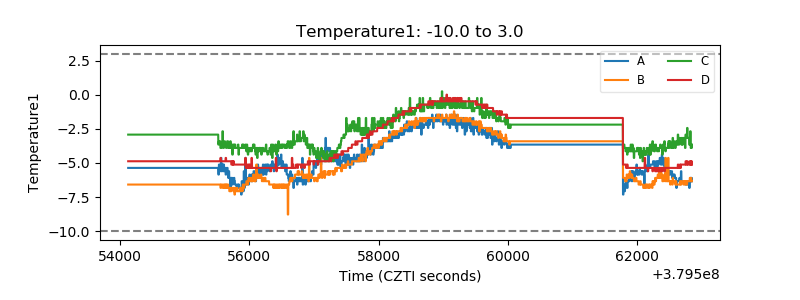 |
| Veto HV Monitor | 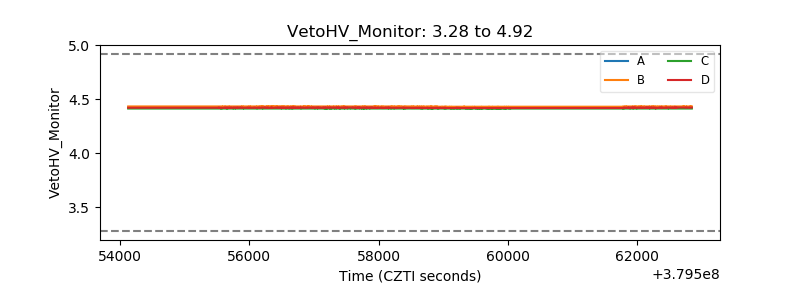 |
| Veto LLD | 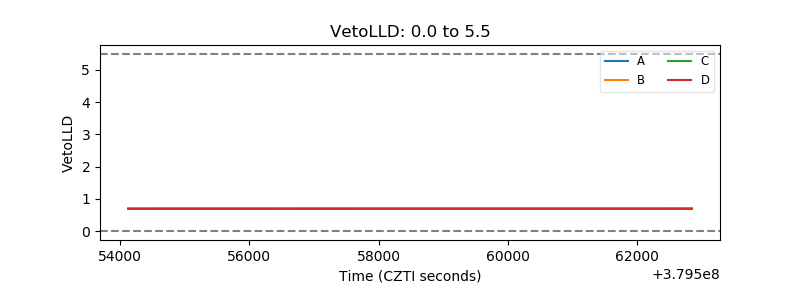 |
| Alpha Counter | 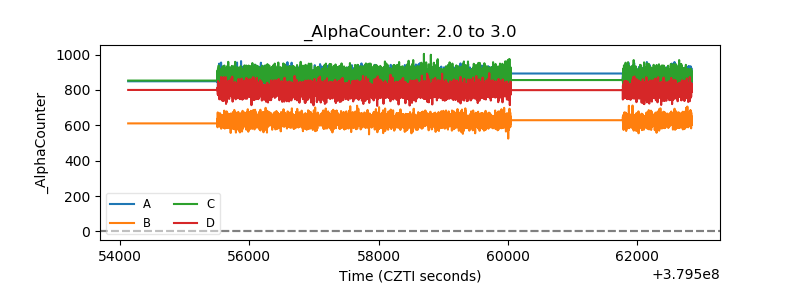 |
| _CPM_Rate | 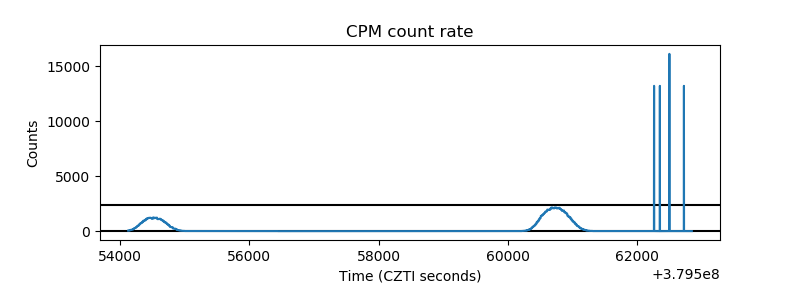 |
| CZT Counter |  |
| +2.5 Volts monitor |  |
| +5 Volts monitor | 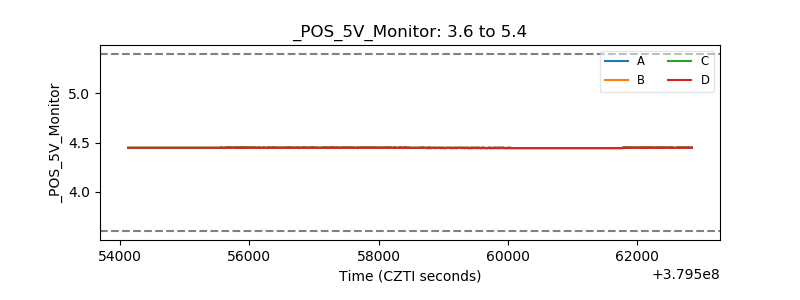 |
| _ROLL_ROT | 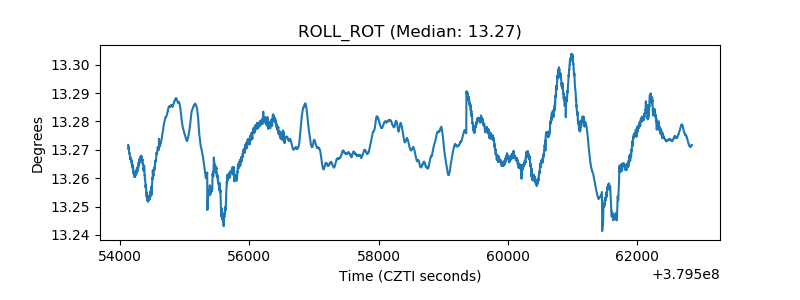 |
| _Roll_DEC | 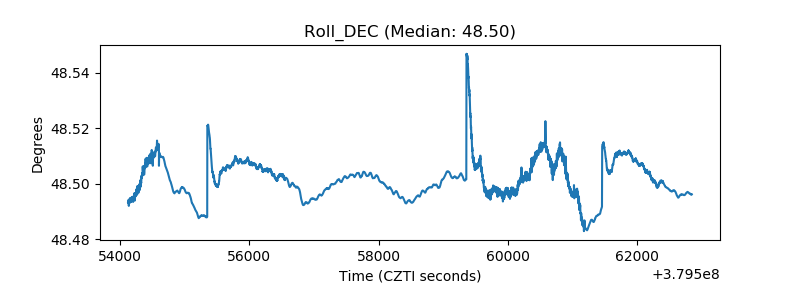 |
| _Roll_RA |  |
| Veto Counter | 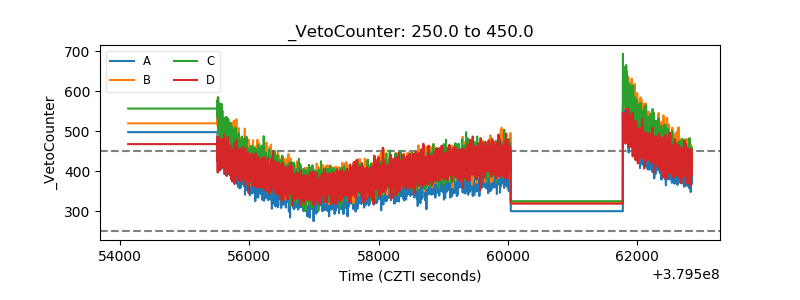 |