| Param | Original file | Final file |
|---|---|---|
| Filename | modeM0/AS1A11_106T03_9000004864_34001cztM0_level2.evt | modeM0/AS1A11_106T03_9000004864_34001cztM0_level2_quad_clean.evt |
| Size (bytes) | 815,932,800 | 120,674,880 |
| Size | 778.1 MB | 115.1 MB |
| Events in quadrant A | 4,474,903 | 778,148 |
| Events in quadrant B | 5,110,750 | 788,552 |
| Events in quadrant C | 6,235,237 | 745,175 |
| Events in quadrant D | 8,279,808 | 715,770 |
| Mode M9 | |||
|---|---|---|---|
| Quadrant | BADHDUFLAG | Total packets | Discarded packets |
| A | 0 | 38 | 0 |
| B | 0 | 38 | 0 |
| C | 0 | 38 | 0 |
| D | 0 | 38 | 0 |
| Mode M0 | |||
|---|---|---|---|
| Quadrant | BADHDUFLAG | Total packets | Discarded packets |
| A | 0 | 18671 | 3 |
| B | 0 | 20708 | 2 |
| C | 0 | 24281 | 2 |
| D | 0 | 30857 | 2 |
| Mode SS | |||
|---|---|---|---|
| Quadrant | BADHDUFLAG | Total packets | Discarded packets |
| A | 0 | 184 | 0 |
| B | 0 | 184 | 0 |
| C | 0 | 184 | 0 |
| D | 0 | 184 | 0 |
| Quadrant | Total seconds | Saturated seconds | Saturation percentage |
|---|---|---|---|
| A | 9037 | 18 | 0.199181% |
| B | 9037 | 65 | 0.719265% |
| C | 9037 | 289 | 3.197964% |
| D | 9037 | 690 | 7.635277% |
Noise dominated data is calculated using 1-second bins in cleaned event files. If a bin has >2000 counts, and if more than 50% of those come from <1% of pixels, then it is considered to be noise-dominated and hence unusable.
| Quadrant | # 1 sec bins | Bins with >0 counts | Bins with >2000 counts | High rate bins dominated by noise | Noise dominated (total time) | Noise dominated (detector-on time) | Marked lightcurve |
|---|---|---|---|---|---|---|---|
| A | 12859 | 9039 | 12 | 12 | 0.09% | 0.13% | 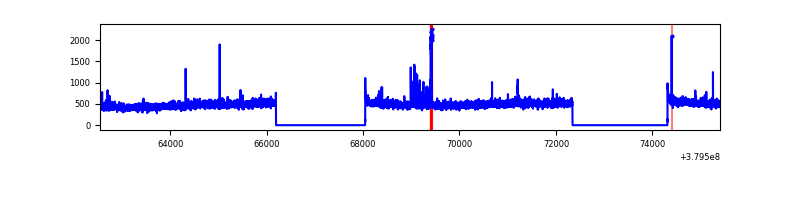 |
| B | 12859 | 9039 | 34 | 34 | 0.26% | 0.38% | 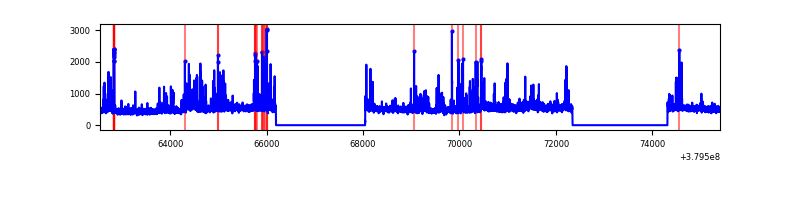 |
| C | 12859 | 9039 | 257 | 257 | 2.00% | 2.84% | 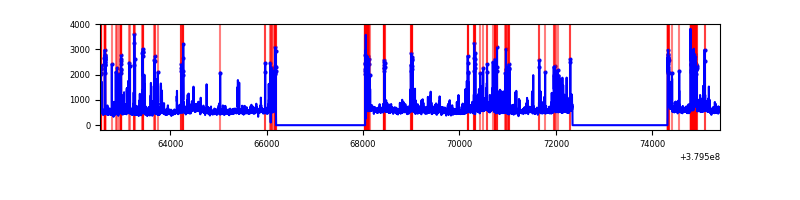 |
| D | 12859 | 9039 | 583 | 583 | 4.53% | 6.45% | 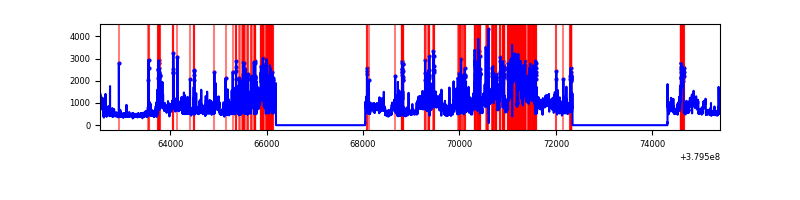 |
Top three noisy pixels from each quadrant. If the there are fewer than three noisy pixels in the level2.evt file, extra rows are filled as -1
| Pixel properties | Quadrant properties | ||||||
|---|---|---|---|---|---|---|---|
| Quadrant | DetID | PixID | Counts | Sigma | Mean | Median | Sigma |
| A | 15 | 169 | 126547 | 575.6 | 1115 | 1094 | 218.0 |
| A | 13 | 6 | 26697 | 117.47 | 1115 | 1094 | 218.0 |
| A | 10 | 83 | 19268 | 83.38 | 1115 | 1094 | 218.0 |
| B | 5 | 172 | 247032 | 1204.13 | 1101 | 1075 | 204.3 |
| B | 0 | 190 | 94960 | 459.63 | 1101 | 1075 | 204.3 |
| B | 3 | 112 | 93763 | 453.77 | 1101 | 1075 | 204.3 |
| C | 4 | 254 | 751916 | 3160.8 | 1048 | 1057 | 237.6 |
| C | 3 | 233 | 455637 | 1913.59 | 1048 | 1057 | 237.6 |
| C | 15 | 214 | 386246 | 1621.48 | 1048 | 1057 | 237.6 |
| D | 8 | 195 | 2033042 | 7310.3 | 1027 | 1008 | 278.0 |
| D | 8 | 230 | 522760 | 1877.02 | 1027 | 1008 | 278.0 |
| D | 13 | 249 | 500859 | 1798.23 | 1027 | 1008 | 278.0 |
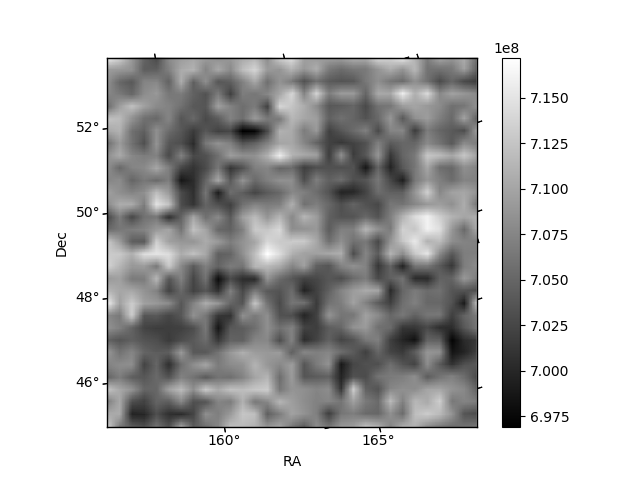
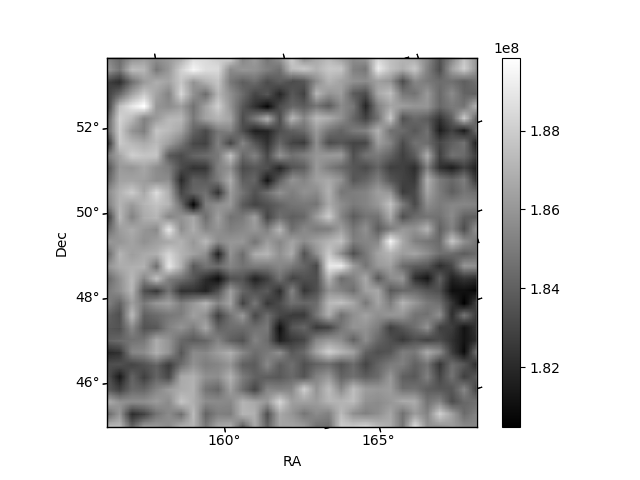
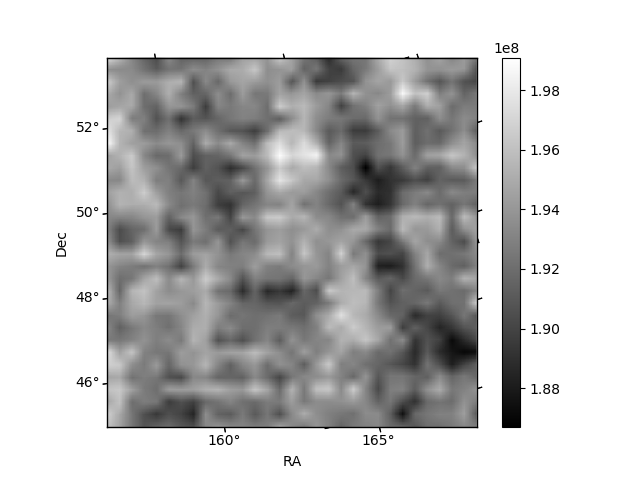
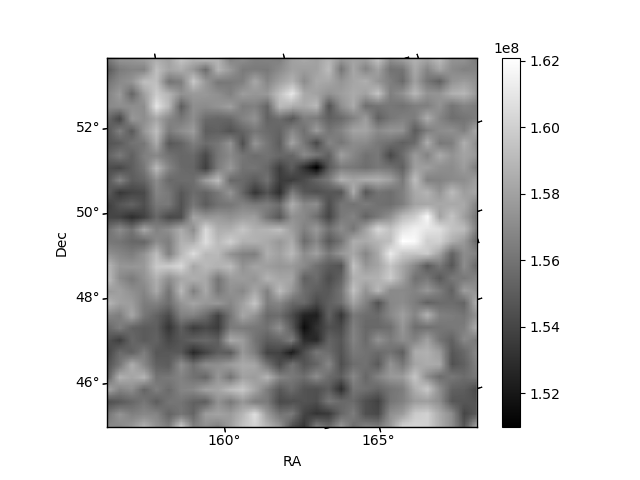
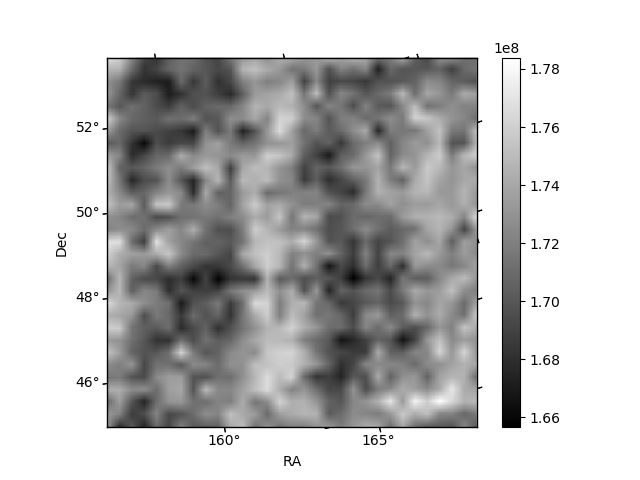
Histogram calculated using DETX and DETY for each event in the final _common_clean file
| Quadrant A | 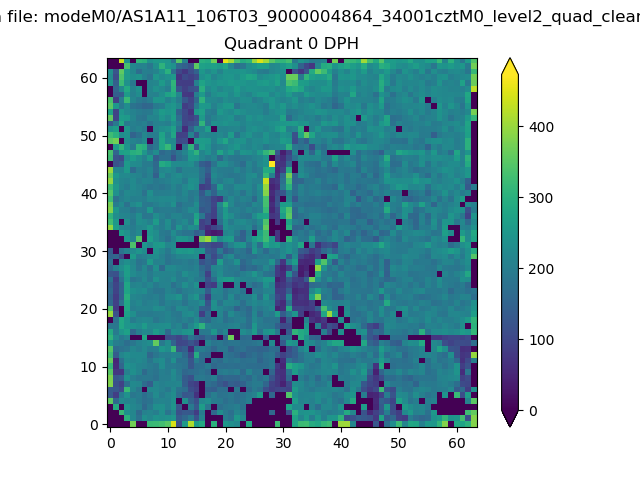 |
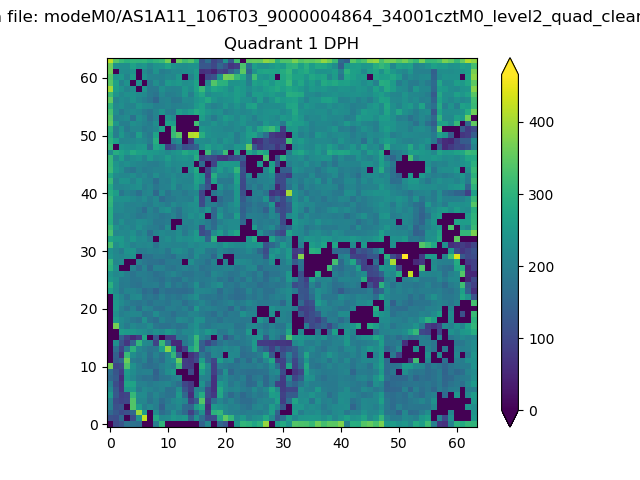 |
Quadrant B |
|---|---|---|---|
| Quadrant D | 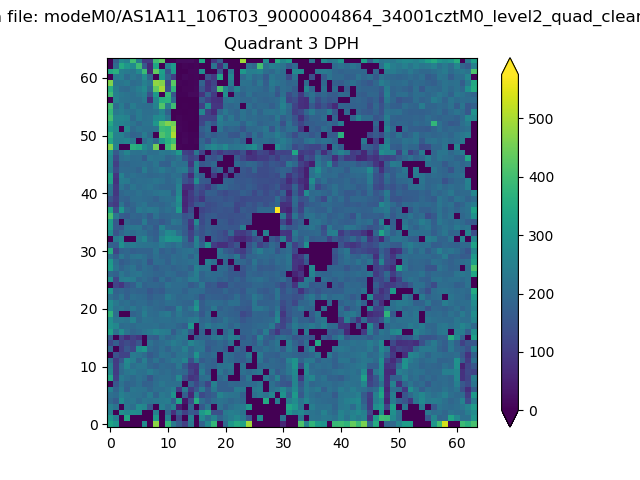 |
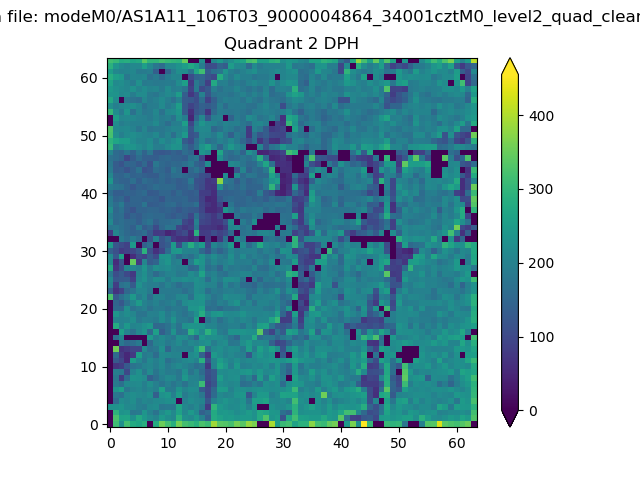 |
Quadrant C |
| Plot type | Count rate plots | Images |
|---|---|---|
| Comparison with Poisson distribution Blue bars denote a histogram of data divided into 1 sec bins. Red curve is a Poisson curve with rate = median count rate of data. |
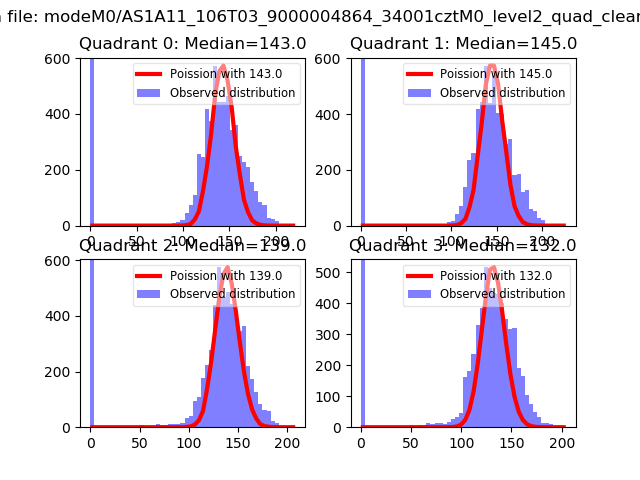 |
 |
| Quadrant-wise count rates Data is divided into 100 sec bins |
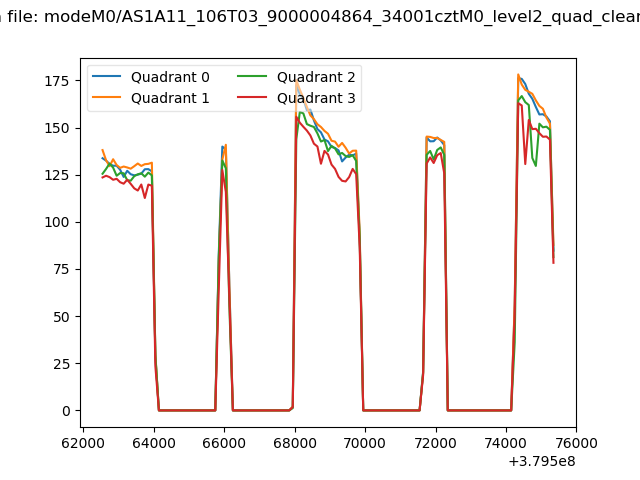 |
|
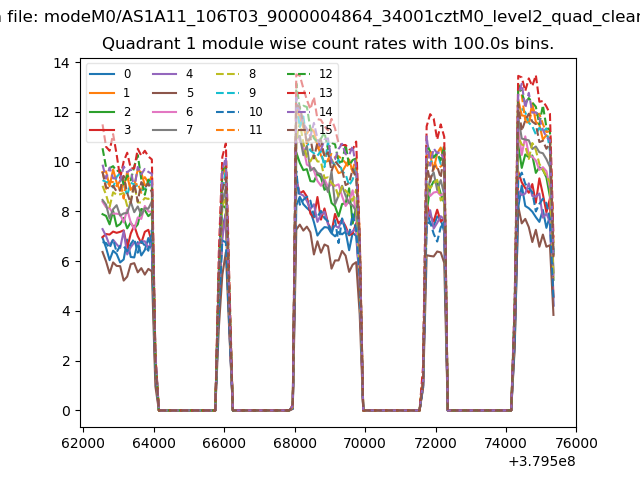
| Module-wise count rates for Quadrant A Data is divided into 100 sec bins |
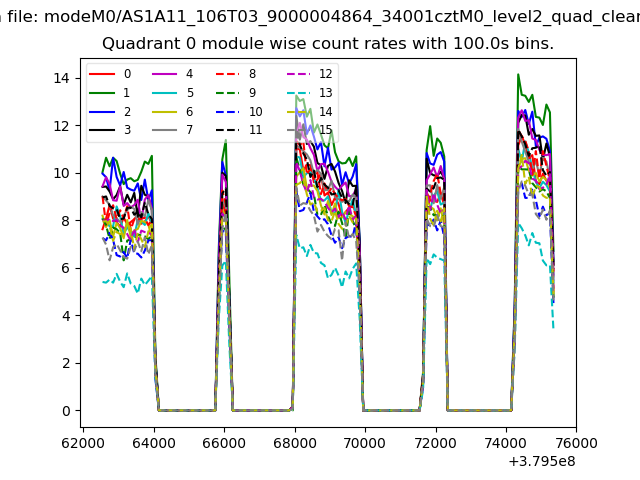 |
 |
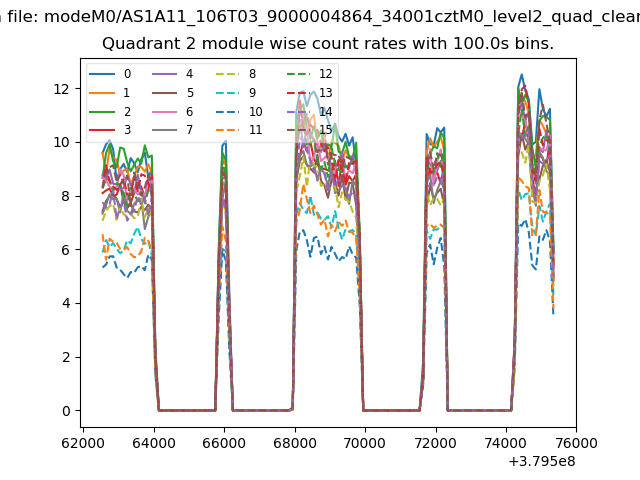
| Module-wise count rates for Quadrant B Data is divided into 100 sec bins |
 |
 |
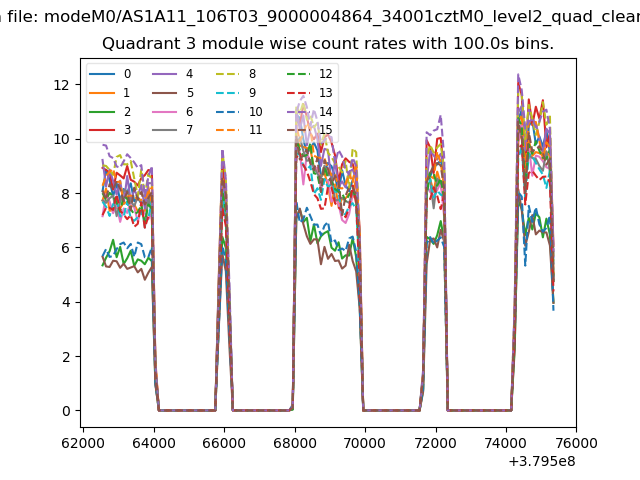
| Module-wise count rates for Quadrant C Data is divided into 100 sec bins |
 |
 |
| Module-wise count rates for Quadrant D Data is divided into 100 sec bins |
 |
 |
| Parameter | Plot |
|---|---|
| CZT HV Monitor | 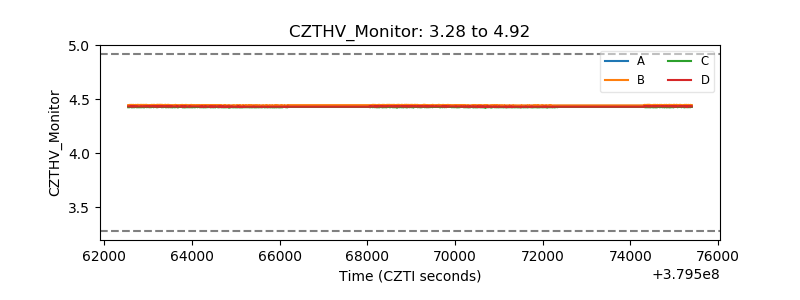 |
| D_VDD | 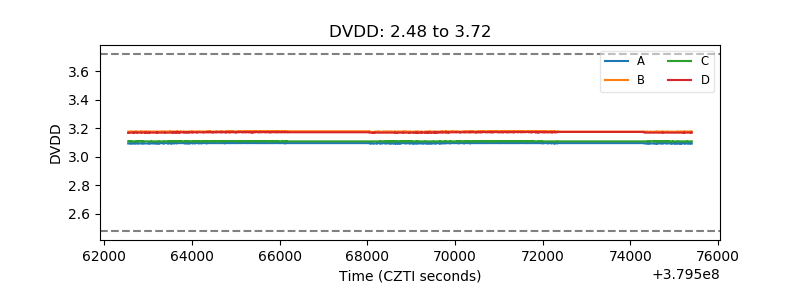 |
| Temperature 1 | 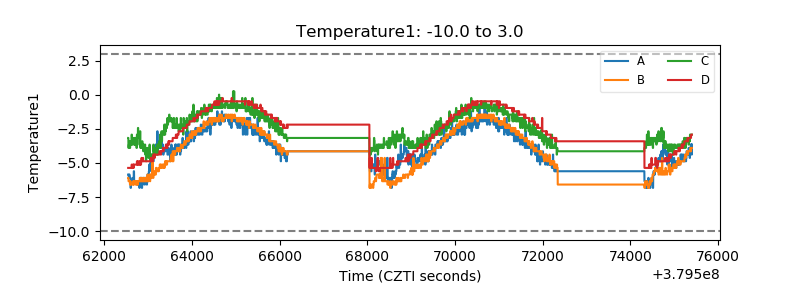 |
| Veto HV Monitor | 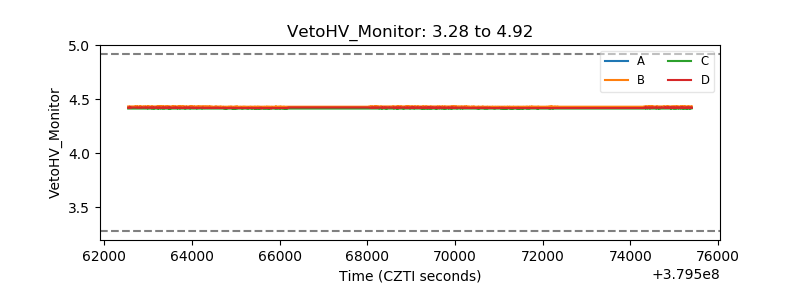 |
| Veto LLD | 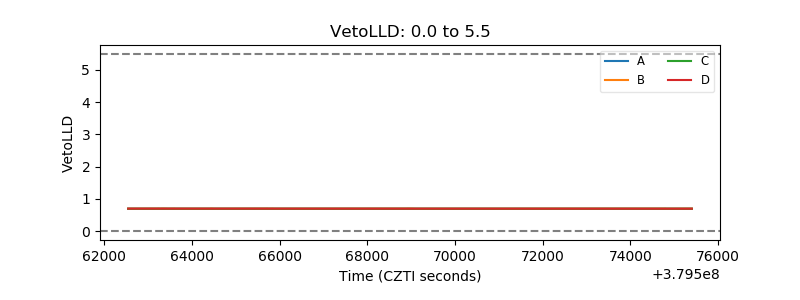 |
| Alpha Counter | 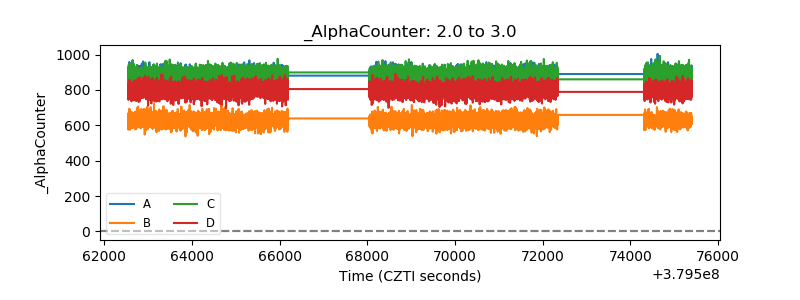 |
| _CPM_Rate | 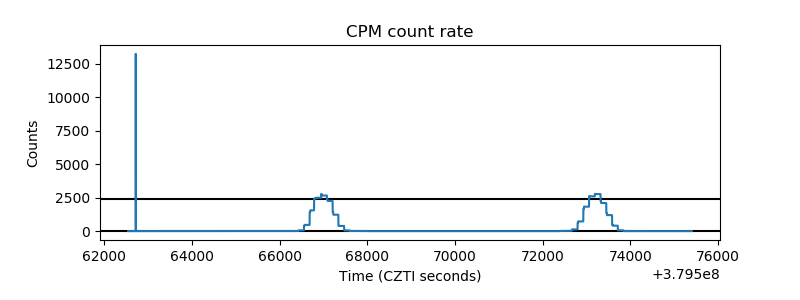 |
| CZT Counter | 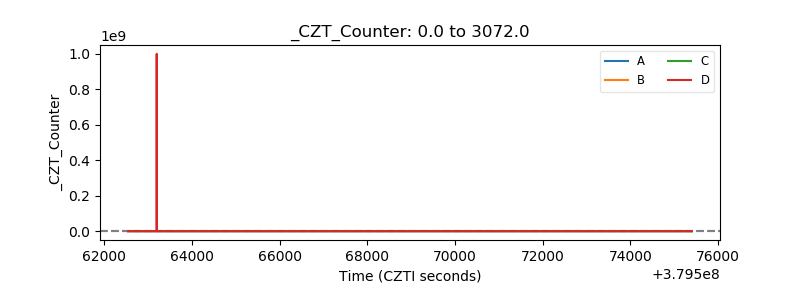 |
| +2.5 Volts monitor |  |
| +5 Volts monitor |  |
| _ROLL_ROT | 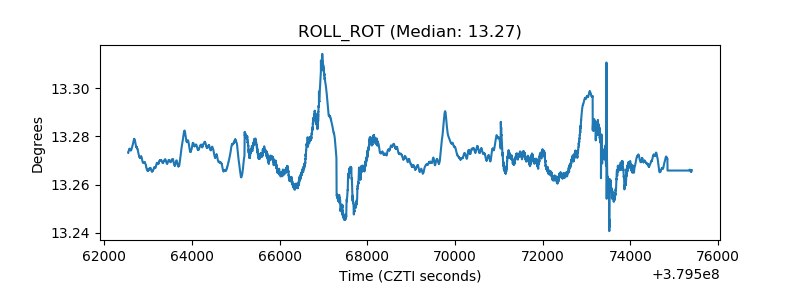 |
| _Roll_DEC | 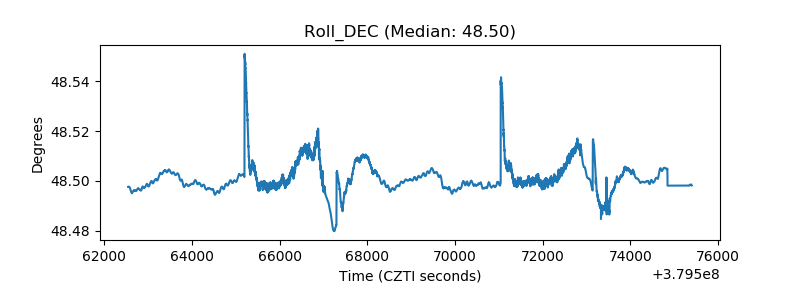 |
| _Roll_RA | 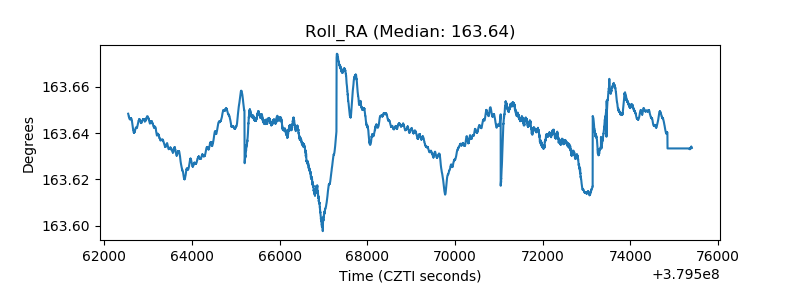 |
| Veto Counter | 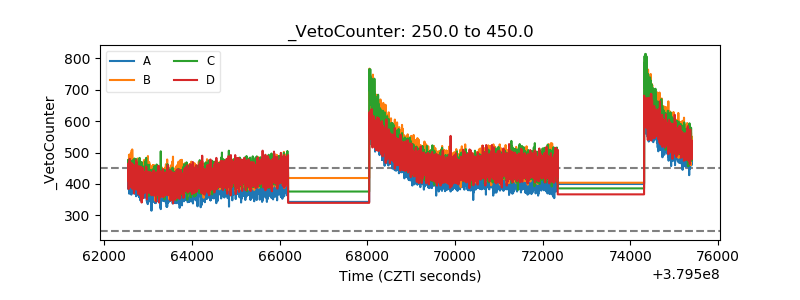 |