| Param | Original file | Final file |
|---|---|---|
| Filename | modeM0/AS1A11_106T03_9000004864_34002cztM0_level2.evt | modeM0/AS1A11_106T03_9000004864_34002cztM0_level2_quad_clean.evt |
| Size (bytes) | 454,731,840 | 68,947,200 |
| Size | 433.7 MB | 65.8 MB |
| Events in quadrant A | 2,425,730 | 456,712 |
| Events in quadrant B | 2,927,309 | 456,453 |
| Events in quadrant C | 3,494,032 | 427,521 |
| Events in quadrant D | 4,603,436 | 414,252 |
| Mode M9 | |||
|---|---|---|---|
| Quadrant | BADHDUFLAG | Total packets | Discarded packets |
| A | 0 | 21 | 0 |
| B | 0 | 21 | 0 |
| C | 0 | 21 | 0 |
| D | 0 | 21 | 0 |
| Mode M0 | |||
|---|---|---|---|
| Quadrant | BADHDUFLAG | Total packets | Discarded packets |
| A | 0 | 9708 | 2 |
| B | 0 | 11532 | 1 |
| C | 0 | 13620 | 1 |
| D | 0 | 16990 | 1 |
| Mode SS | |||
|---|---|---|---|
| Quadrant | BADHDUFLAG | Total packets | Discarded packets |
| A | 0 | 96 | 0 |
| B | 0 | 96 | 0 |
| C | 0 | 96 | 0 |
| D | 0 | 96 | 0 |
| Quadrant | Total seconds | Saturated seconds | Saturation percentage |
|---|---|---|---|
| A | 4738 | 6 | 0.126636% |
| B | 4738 | 57 | 1.203039% |
| C | 4738 | 199 | 4.200084% |
| D | 4738 | 318 | 6.711693% |
Noise dominated data is calculated using 1-second bins in cleaned event files. If a bin has >2000 counts, and if more than 50% of those come from <1% of pixels, then it is considered to be noise-dominated and hence unusable.
| Quadrant | # 1 sec bins | Bins with >0 counts | Bins with >2000 counts | High rate bins dominated by noise | Noise dominated (total time) | Noise dominated (detector-on time) | Marked lightcurve |
|---|---|---|---|---|---|---|---|
| A | 6831 | 4739 | 0 | 0 | 0.00% | 0.00% | 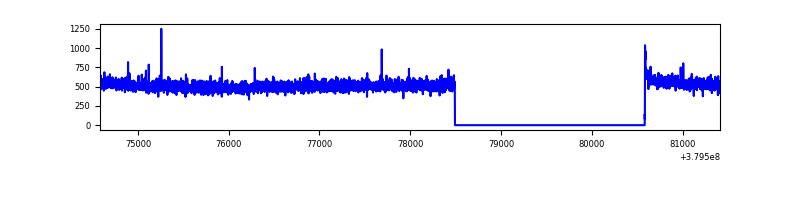 |
| B | 6831 | 4739 | 31 | 31 | 0.45% | 0.65% | 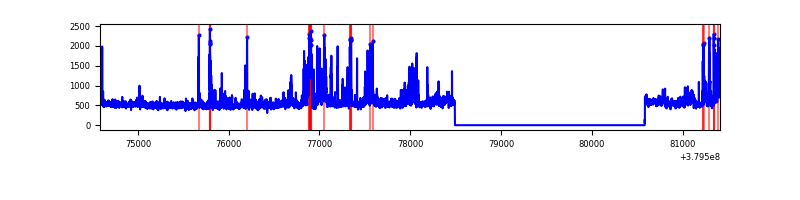 |
| C | 6831 | 4739 | 172 | 172 | 2.52% | 3.63% | 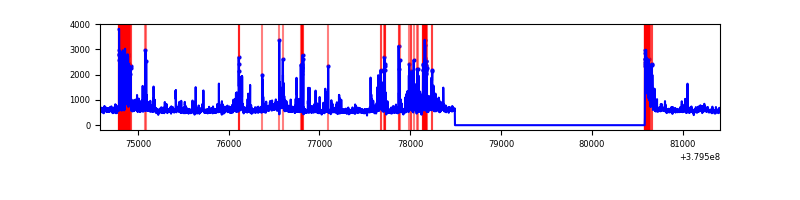 |
| D | 6831 | 4739 | 268 | 268 | 3.92% | 5.66% | 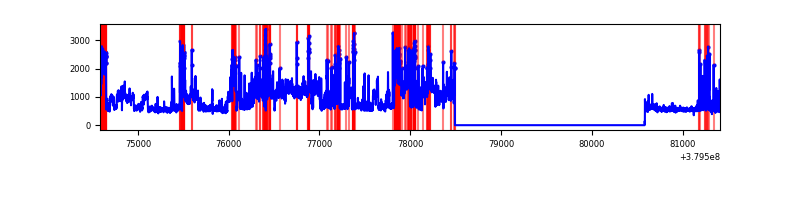 |
Top three noisy pixels from each quadrant. If the there are fewer than three noisy pixels in the level2.evt file, extra rows are filled as -1
| Pixel properties | Quadrant properties | ||||||
|---|---|---|---|---|---|---|---|
| Quadrant | DetID | PixID | Counts | Sigma | Mean | Median | Sigma |
| A | 13 | 6 | 15943 | 123.8 | 621 | 610 | 123.8 |
| A | 10 | 83 | 10176 | 77.24 | 621 | 610 | 123.8 |
| A | 13 | 254 | 7480 | 55.47 | 621 | 610 | 123.8 |
| B | 5 | 172 | 171925 | 1514.88 | 603 | 589 | 113.1 |
| B | 5 | 31 | 74468 | 653.21 | 603 | 589 | 113.1 |
| B | 5 | 15 | 68973 | 604.62 | 603 | 589 | 113.1 |
| C | 3 | 233 | 295427 | 2264.24 | 572 | 577 | 130.2 |
| C | 4 | 254 | 260451 | 1995.65 | 572 | 577 | 130.2 |
| C | 15 | 214 | 202797 | 1552.91 | 572 | 577 | 130.2 |
| D | 8 | 195 | 1418296 | 9170.92 | 574 | 563 | 154.6 |
| D | 13 | 249 | 376432 | 2431.39 | 574 | 563 | 154.6 |
| D | 12 | 6 | 131799 | 848.93 | 574 | 563 | 154.6 |
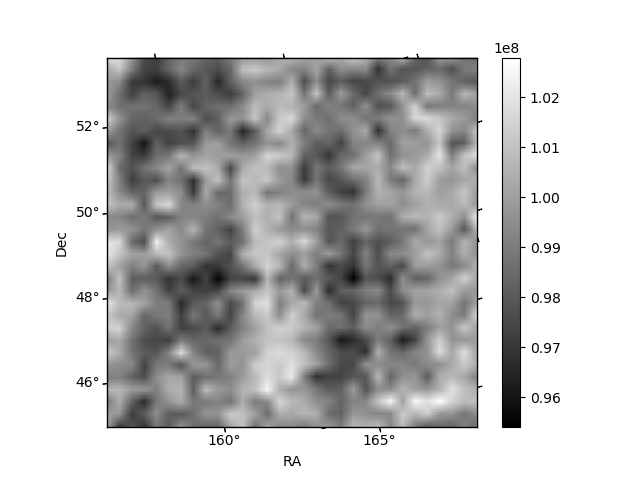
Histogram calculated using DETX and DETY for each event in the final _common_clean file
| Quadrant A | 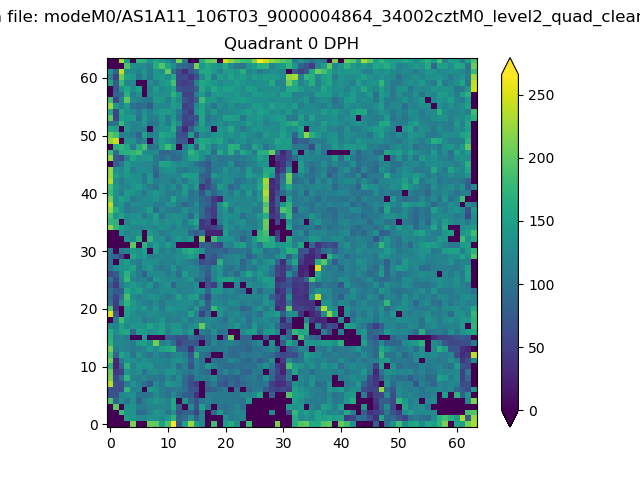 |
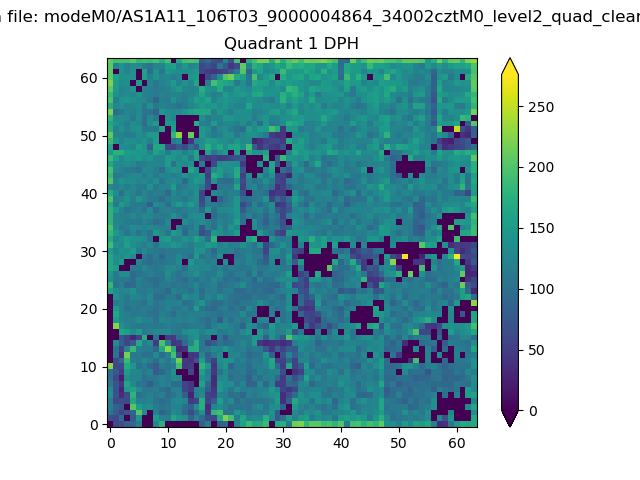 |
Quadrant B |
|---|---|---|---|
| Quadrant D |  |
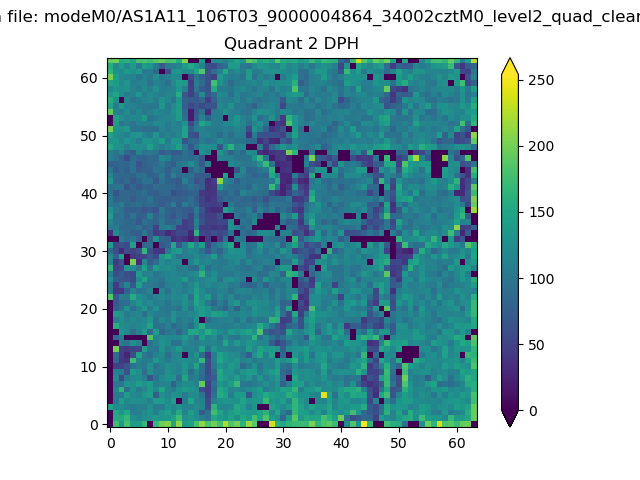 |
Quadrant C |
| Plot type | Count rate plots | Images |
|---|---|---|
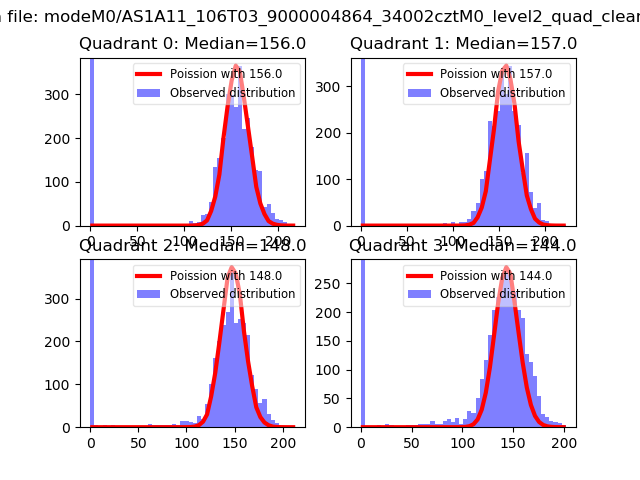
| Comparison with Poisson distribution Blue bars denote a histogram of data divided into 1 sec bins. Red curve is a Poisson curve with rate = median count rate of data. |
 |
 |
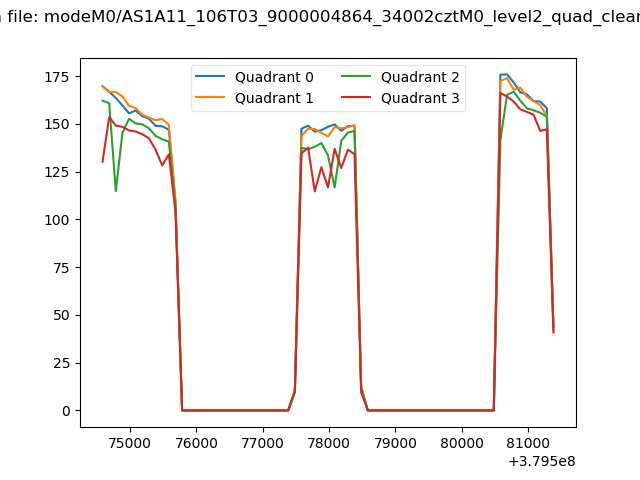
| Quadrant-wise count rates Data is divided into 100 sec bins |
 |
|
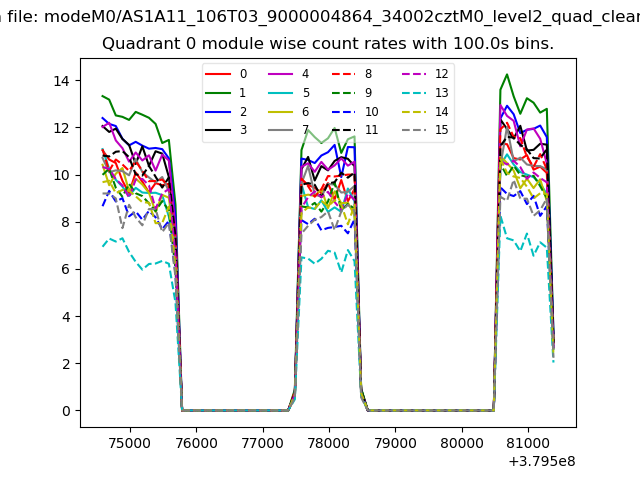
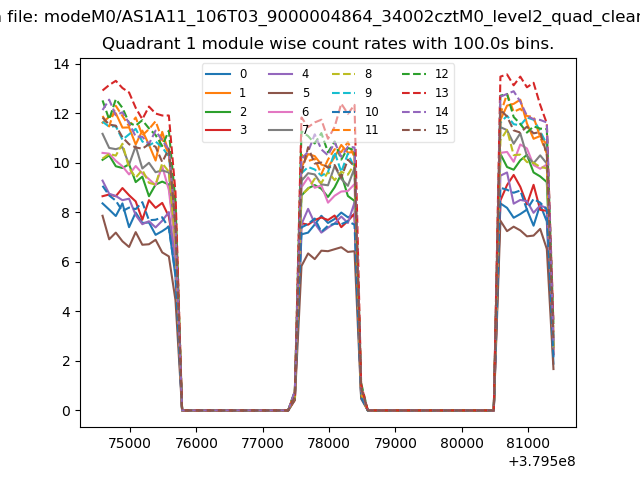
| Module-wise count rates for Quadrant A Data is divided into 100 sec bins |
 |
 |
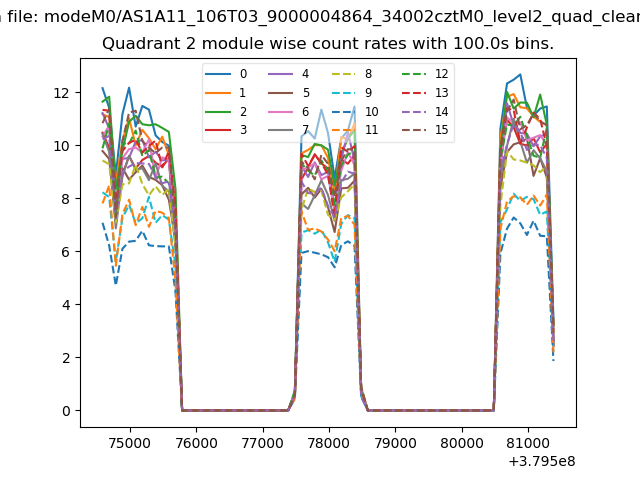
| Module-wise count rates for Quadrant B Data is divided into 100 sec bins |
 |
 |
| Module-wise count rates for Quadrant C Data is divided into 100 sec bins |
 |
 |
| Module-wise count rates for Quadrant D Data is divided into 100 sec bins |
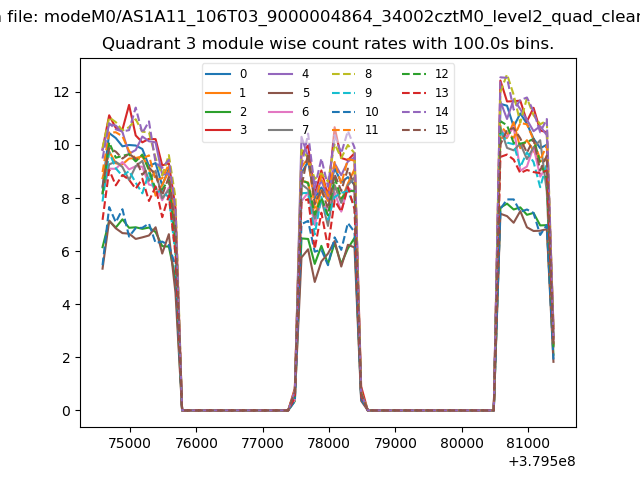 |
 |
| Parameter | Plot |
|---|---|
| CZT HV Monitor | 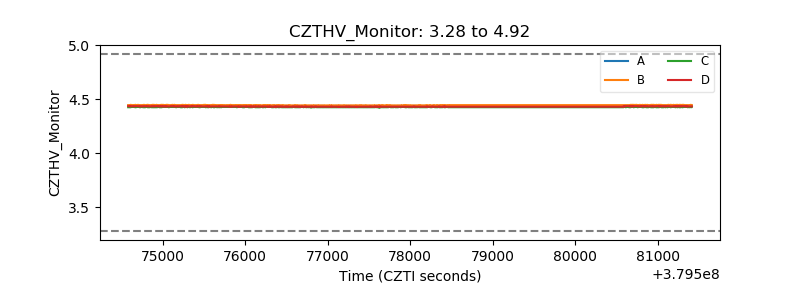 |
| D_VDD | 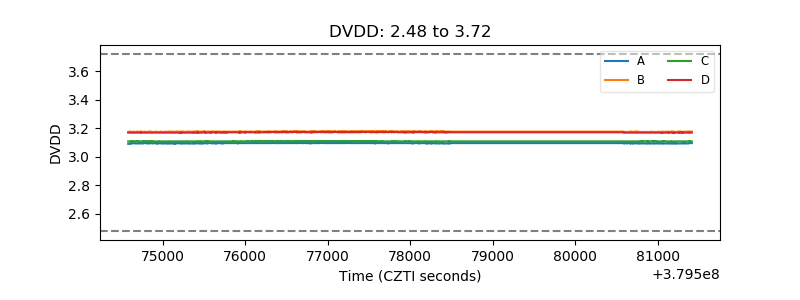 |
| Temperature 1 | 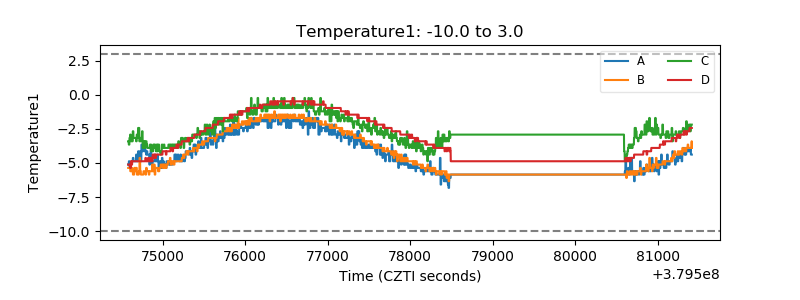 |
| Veto HV Monitor | 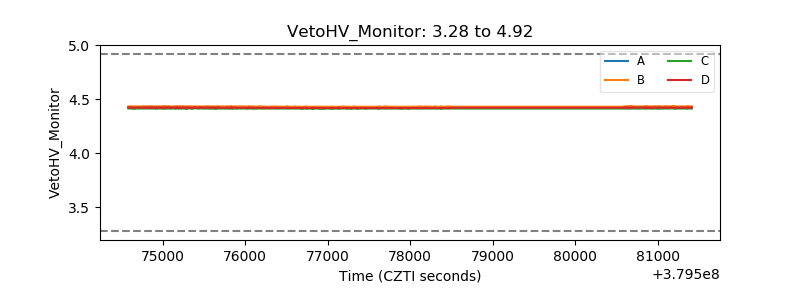 |
| Veto LLD | 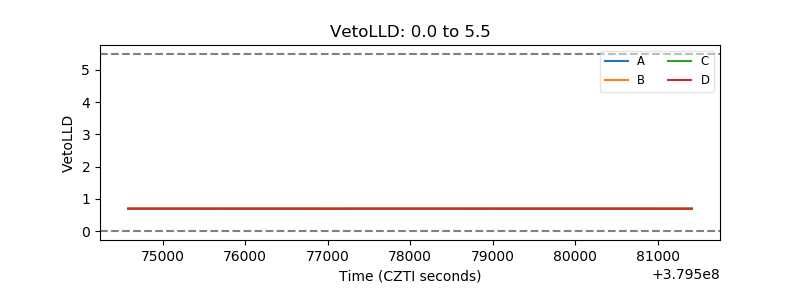 |
| Alpha Counter | 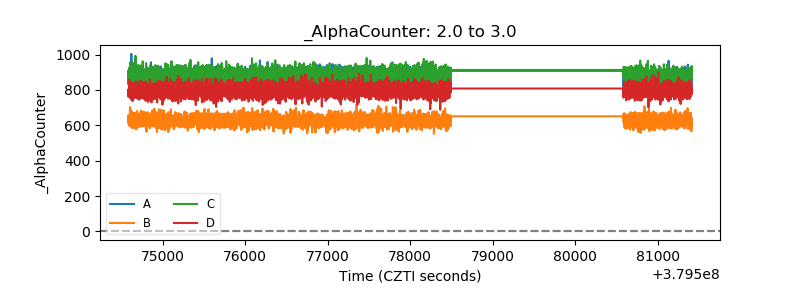 |
| _CPM_Rate | 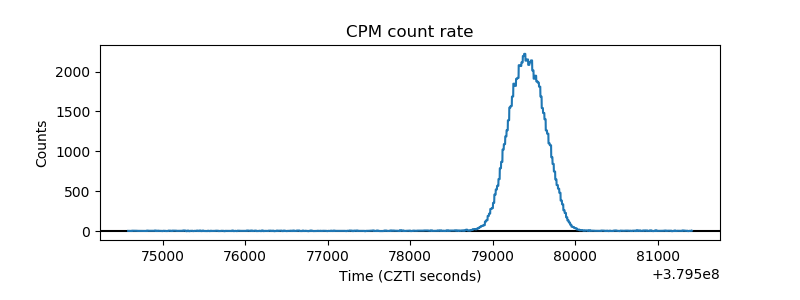 |
| CZT Counter | 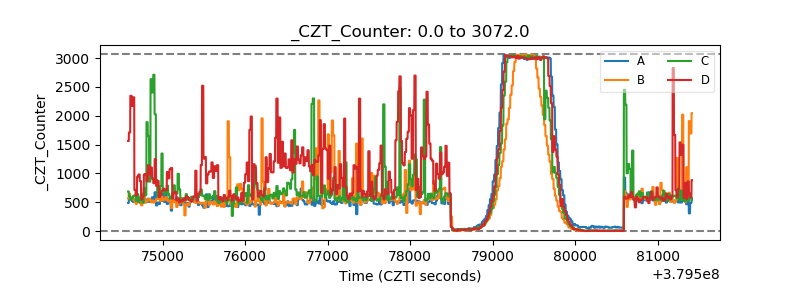 |
| +2.5 Volts monitor |  |
| +5 Volts monitor | 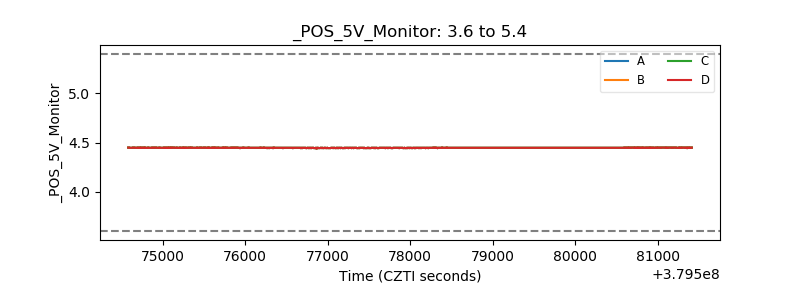 |
| _ROLL_ROT | 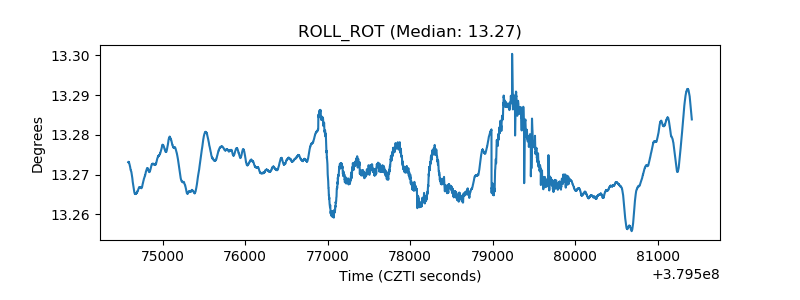 |
| _Roll_DEC | 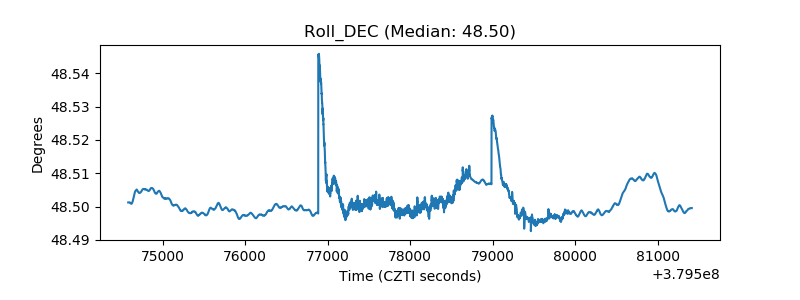 |
| _Roll_RA | 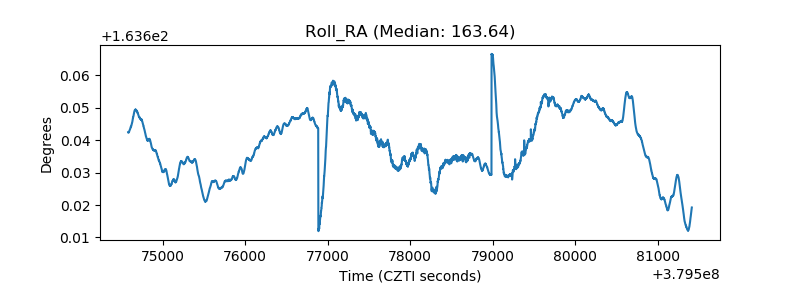 |
| Veto Counter | 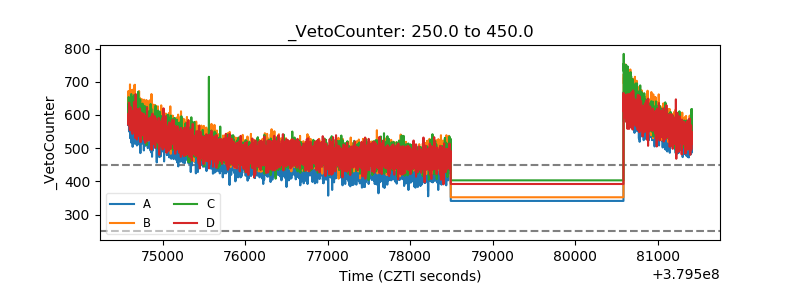 |