| Param | Original file | Final file |
|---|---|---|
| Filename | modeM0/AS1A11_106T03_9000004864_34004cztM0_level2.evt | modeM0/AS1A11_106T03_9000004864_34004cztM0_level2_quad_clean.evt |
| Size (bytes) | 448,902,720 | 58,910,400 |
| Size | 428.1 MB | 56.2 MB |
| Events in quadrant A | 2,625,488 | 369,932 |
| Events in quadrant B | 3,013,041 | 366,784 |
| Events in quadrant C | 3,227,802 | 353,200 |
| Events in quadrant D | 4,379,676 | 332,901 |
| Mode M9 | |||
|---|---|---|---|
| Quadrant | BADHDUFLAG | Total packets | Discarded packets |
| A | 0 | 21 | 0 |
| B | 0 | 21 | 0 |
| C | 0 | 21 | 0 |
| D | 0 | 22 | 0 |
| Mode M0 | |||
|---|---|---|---|
| Quadrant | BADHDUFLAG | Total packets | Discarded packets |
| A | 0 | 10804 | 2 |
| B | 0 | 11964 | 1 |
| C | 0 | 12613 | 1 |
| D | 0 | 16420 | 1 |
| Mode SS | |||
|---|---|---|---|
| Quadrant | BADHDUFLAG | Total packets | Discarded packets |
| A | 0 | 104 | 0 |
| B | 0 | 104 | 0 |
| C | 0 | 104 | 0 |
| D | 0 | 104 | 0 |
| Quadrant | Total seconds | Saturated seconds | Saturation percentage |
|---|---|---|---|
| A | 5149 | 12 | 0.233055% |
| B | 5149 | 78 | 1.514857% |
| C | 5149 | 84 | 1.631385% |
| D | 5149 | 285 | 5.535055% |
Noise dominated data is calculated using 1-second bins in cleaned event files. If a bin has >2000 counts, and if more than 50% of those come from <1% of pixels, then it is considered to be noise-dominated and hence unusable.
| Quadrant | # 1 sec bins | Bins with >0 counts | Bins with >2000 counts | High rate bins dominated by noise | Noise dominated (total time) | Noise dominated (detector-on time) | Marked lightcurve |
|---|---|---|---|---|---|---|---|
| A | 7242 | 5150 | 1 | 1 | 0.01% | 0.02% | 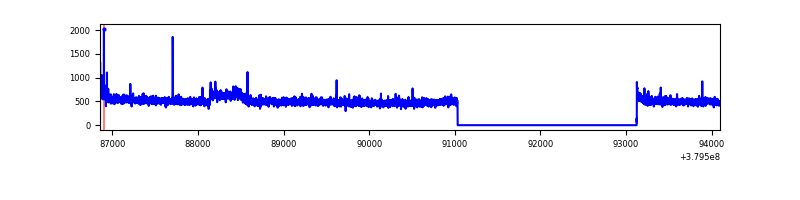 |
| B | 7242 | 5150 | 52 | 52 | 0.72% | 1.01% | 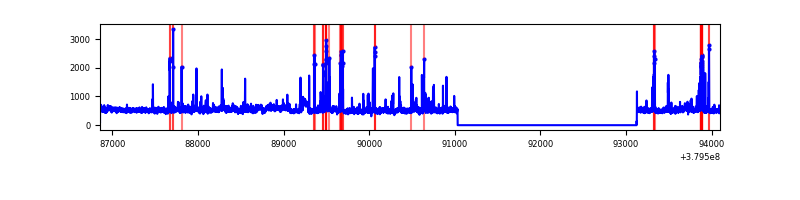 |
| C | 7242 | 5150 | 75 | 75 | 1.04% | 1.46% | 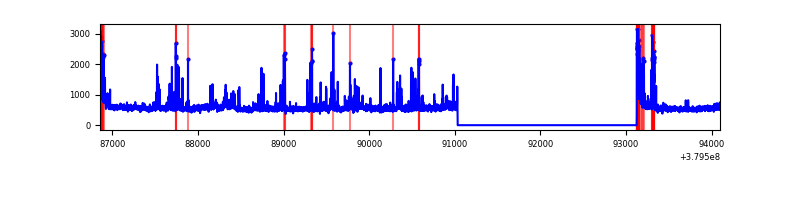 |
| D | 7242 | 5150 | 268 | 268 | 3.70% | 5.20% | 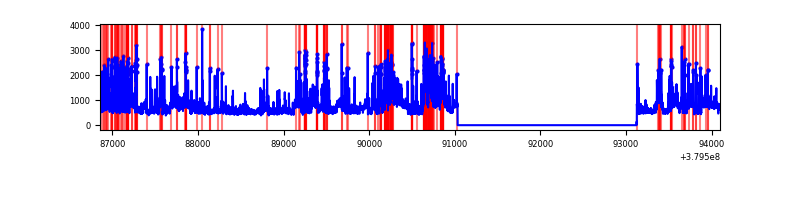 |
Top three noisy pixels from each quadrant. If the there are fewer than three noisy pixels in the level2.evt file, extra rows are filled as -1
| Pixel properties | Quadrant properties | ||||||
|---|---|---|---|---|---|---|---|
| Quadrant | DetID | PixID | Counts | Sigma | Mean | Median | Sigma |
| A | 15 | 169 | 76325 | 589.22 | 652 | 641 | 128.4 |
| A | 10 | 83 | 16990 | 127.28 | 652 | 641 | 128.4 |
| A | 13 | 6 | 16381 | 122.54 | 652 | 641 | 128.4 |
| B | 5 | 172 | 270454 | 2272.38 | 635 | 620 | 118.7 |
| B | 0 | 182 | 67439 | 562.71 | 635 | 620 | 118.7 |
| B | 0 | 189 | 38225 | 316.68 | 635 | 620 | 118.7 |
| C | 4 | 254 | 253271 | 1805.69 | 614 | 620 | 139.9 |
| C | 15 | 214 | 223801 | 1595.07 | 614 | 620 | 139.9 |
| C | 0 | 10 | 162844 | 1159.41 | 614 | 620 | 139.9 |
| D | 8 | 195 | 680102 | 4086.47 | 611 | 598 | 166.3 |
| D | 13 | 249 | 417266 | 2505.8 | 611 | 598 | 166.3 |
| D | 12 | 6 | 367869 | 2208.73 | 611 | 598 | 166.3 |
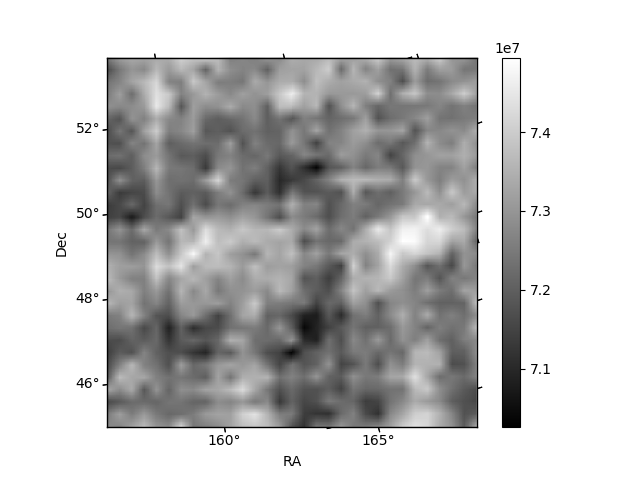
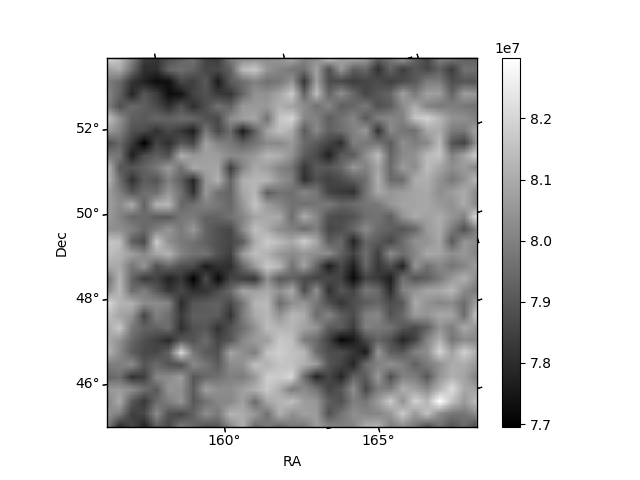
Histogram calculated using DETX and DETY for each event in the final _common_clean file
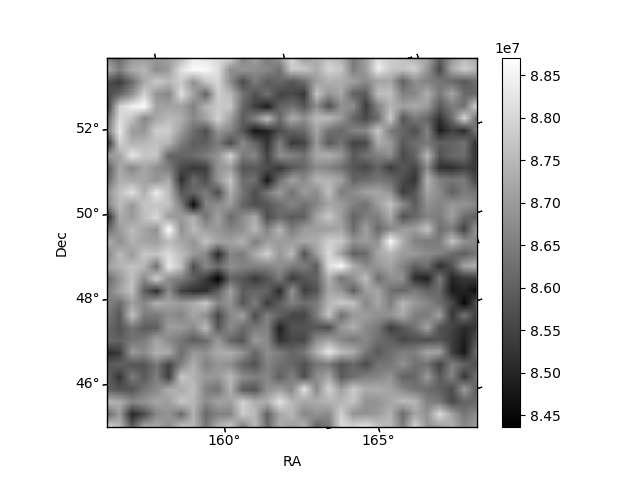
| Quadrant A |  |
 |
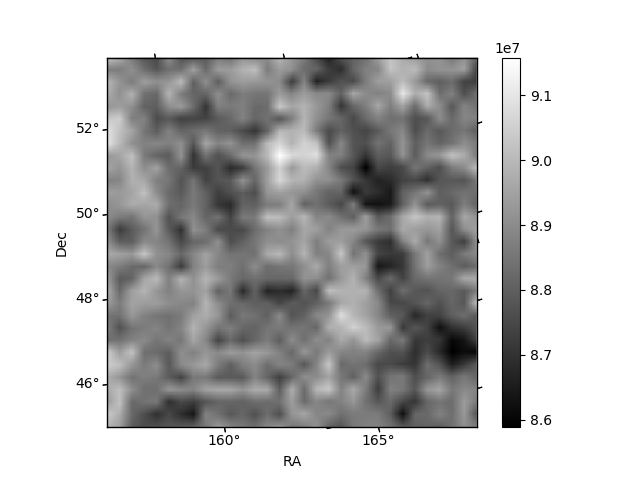
Quadrant B |
|---|---|---|---|
| Quadrant D | 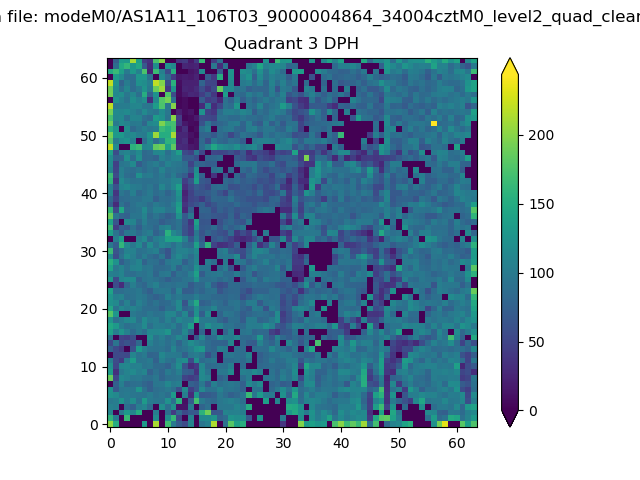 |
 |
Quadrant C |
| Plot type | Count rate plots | Images |
|---|---|---|
| Comparison with Poisson distribution Blue bars denote a histogram of data divided into 1 sec bins. Red curve is a Poisson curve with rate = median count rate of data. |
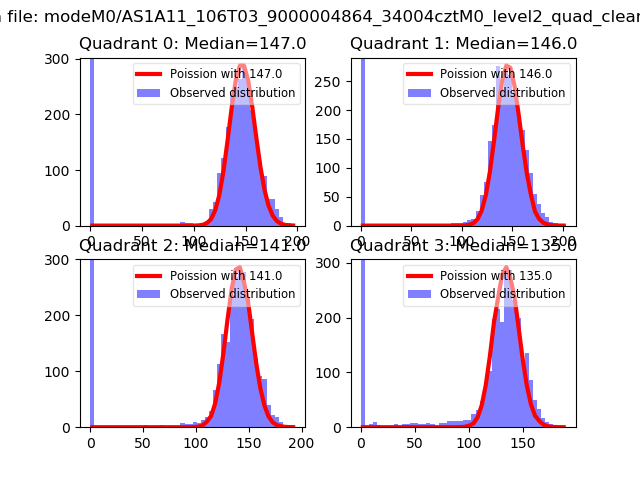 |
 |
| Quadrant-wise count rates Data is divided into 100 sec bins |
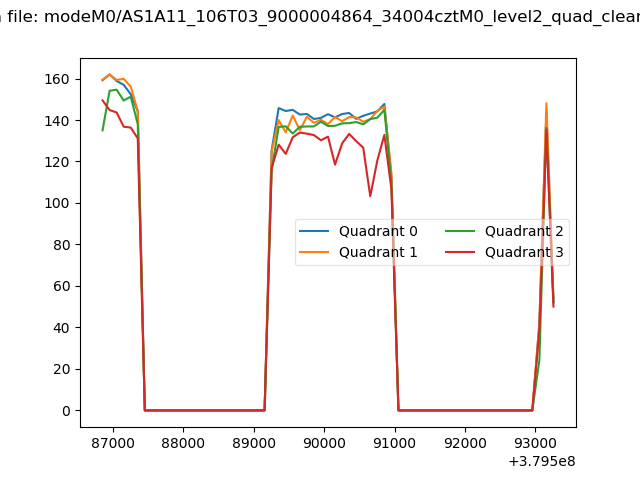 |
|
| Module-wise count rates for Quadrant A Data is divided into 100 sec bins |
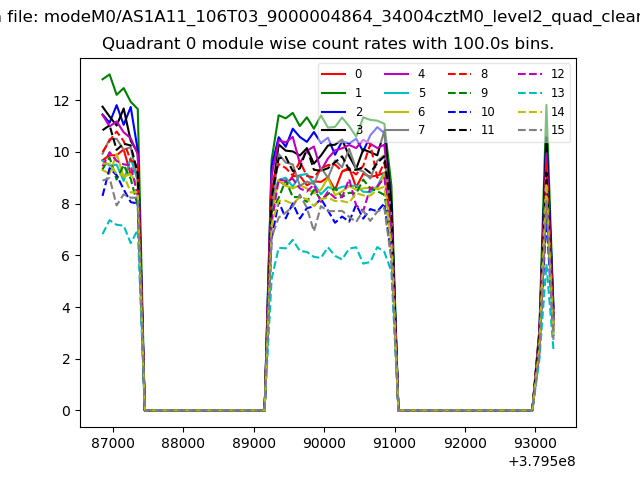 |
 |
| Module-wise count rates for Quadrant B Data is divided into 100 sec bins |
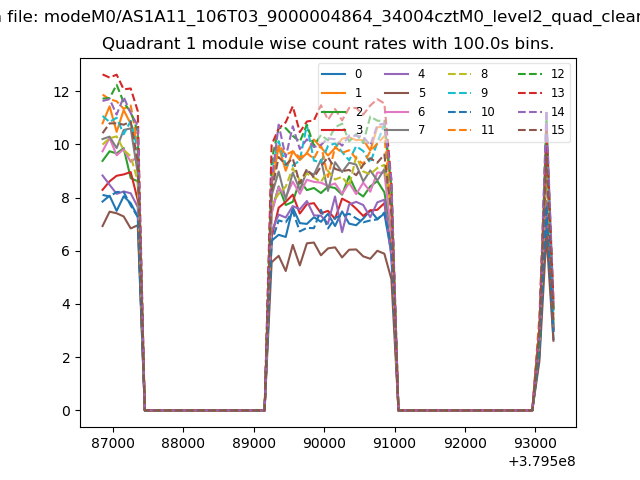 |
 |
| Module-wise count rates for Quadrant C Data is divided into 100 sec bins |
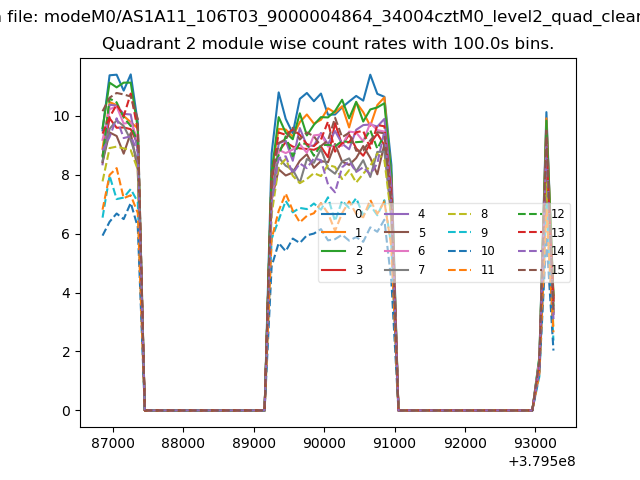 |
 |
| Module-wise count rates for Quadrant D Data is divided into 100 sec bins |
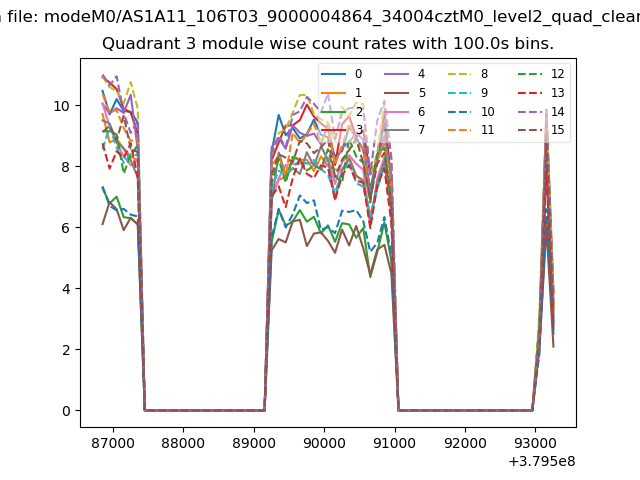 |
 |
| Parameter | Plot |
|---|---|
| CZT HV Monitor | 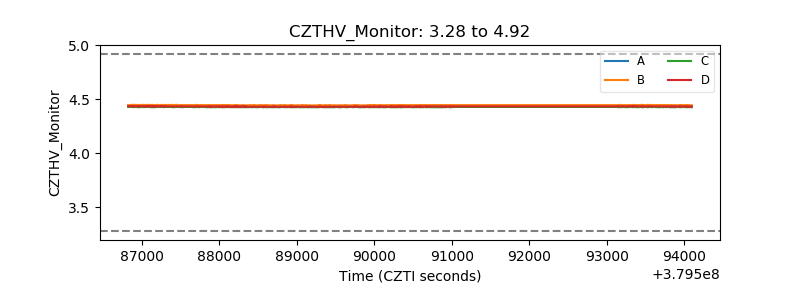 |
| D_VDD | 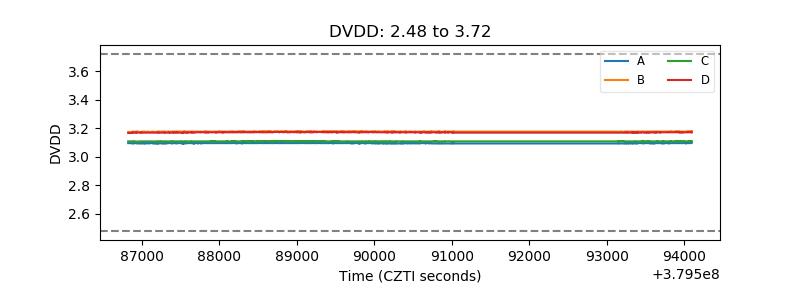 |
| Temperature 1 |  |
| Veto HV Monitor | 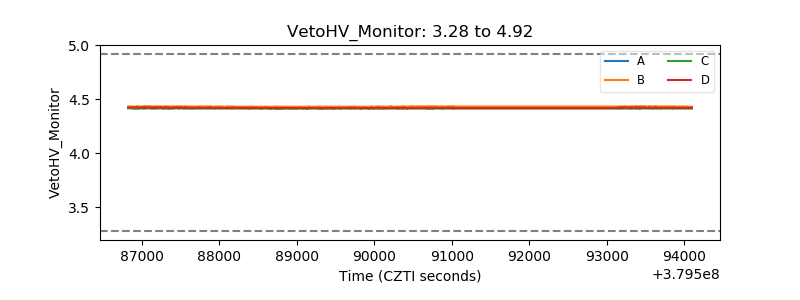 |
| Veto LLD |  |
| Alpha Counter | 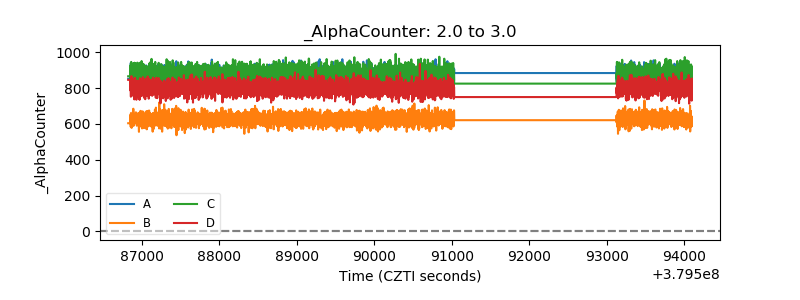 |
| _CPM_Rate | 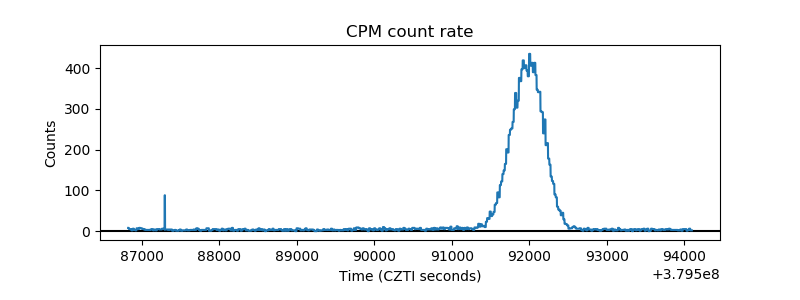 |
| CZT Counter |  |
| +2.5 Volts monitor |  |
| +5 Volts monitor | 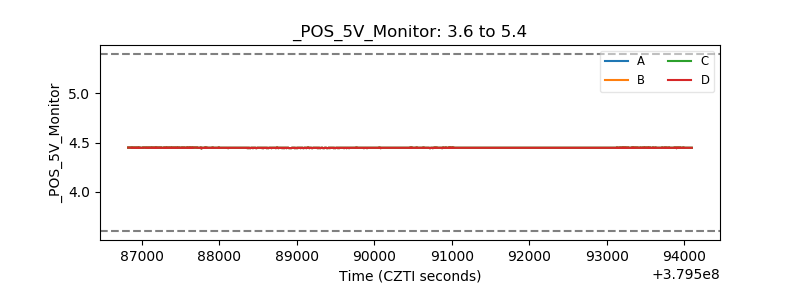 |
| _ROLL_ROT | 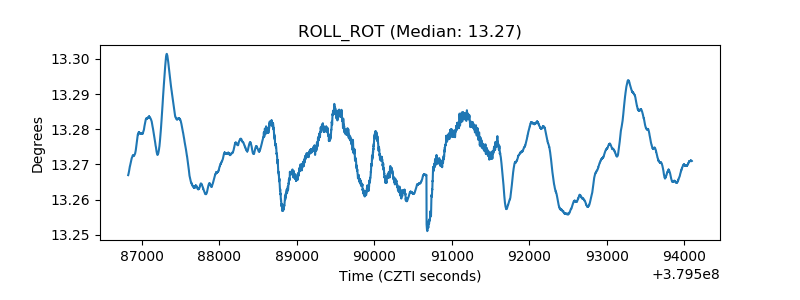 |
| _Roll_DEC | 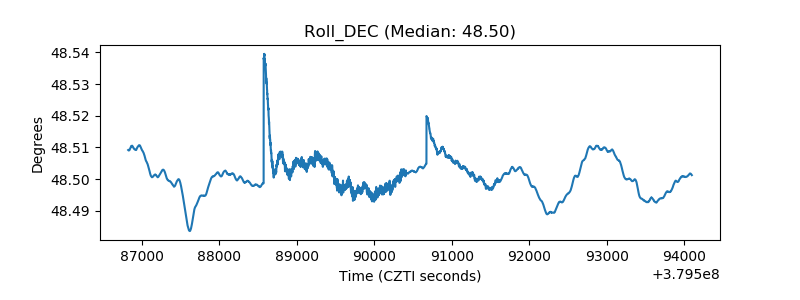 |
| _Roll_RA | 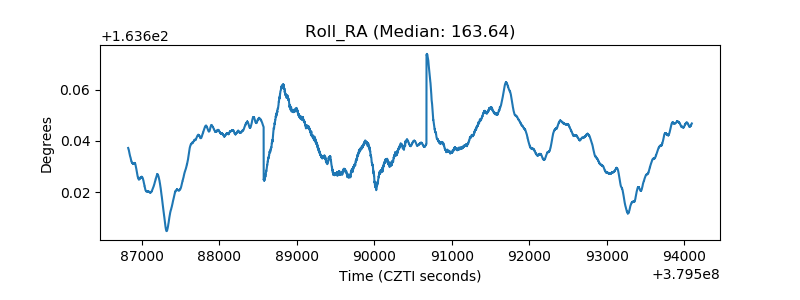 |
| Veto Counter | 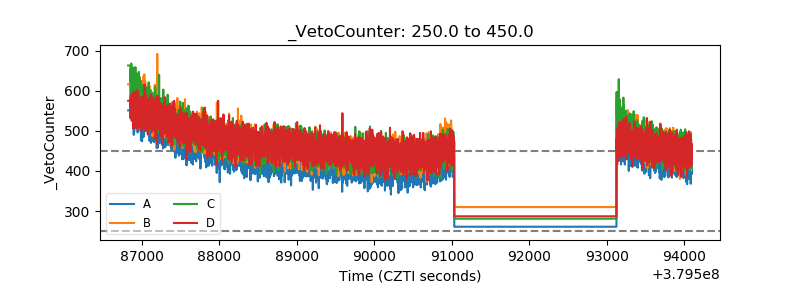 |