| Param | Original file | Final file |
|---|---|---|
| Filename | modeM0/AS1A11_106T03_9000004864_34005cztM0_level2.evt | modeM0/AS1A11_106T03_9000004864_34005cztM0_level2_quad_clean.evt |
| Size (bytes) | 462,214,080 | 56,335,680 |
| Size | 440.8 MB | 53.7 MB |
| Events in quadrant A | 2,523,728 | 346,916 |
| Events in quadrant B | 3,148,804 | 337,964 |
| Events in quadrant C | 3,188,394 | 333,874 |
| Events in quadrant D | 4,779,763 | 317,494 |
| Mode M9 | |||
|---|---|---|---|
| Quadrant | BADHDUFLAG | Total packets | Discarded packets |
| A | 0 | 22 | 0 |
| B | 0 | 22 | 0 |
| C | 0 | 22 | 0 |
| D | 0 | 23 | 0 |
| Mode M0 | |||
|---|---|---|---|
| Quadrant | BADHDUFLAG | Total packets | Discarded packets |
| A | 0 | 10659 | 2 |
| B | 0 | 12512 | 1 |
| C | 0 | 12367 | 1 |
| D | 0 | 17891 | 1 |
| Mode SS | |||
|---|---|---|---|
| Quadrant | BADHDUFLAG | Total packets | Discarded packets |
| A | 0 | 106 | 0 |
| B | 0 | 106 | 0 |
| C | 0 | 106 | 0 |
| D | 0 | 106 | 0 |
| Quadrant | Total seconds | Saturated seconds | Saturation percentage |
|---|---|---|---|
| A | 5276 | 9 | 0.170584% |
| B | 5276 | 140 | 2.653525% |
| C | 5276 | 90 | 1.705838% |
| D | 5276 | 257 | 4.871114% |
Noise dominated data is calculated using 1-second bins in cleaned event files. If a bin has >2000 counts, and if more than 50% of those come from <1% of pixels, then it is considered to be noise-dominated and hence unusable.
| Quadrant | # 1 sec bins | Bins with >0 counts | Bins with >2000 counts | High rate bins dominated by noise | Noise dominated (total time) | Noise dominated (detector-on time) | Marked lightcurve |
|---|---|---|---|---|---|---|---|
| A | 7190 | 5277 | 0 | 0 | 0.00% | 0.00% |  |
| B | 7190 | 5277 | 108 | 108 | 1.50% | 2.05% | 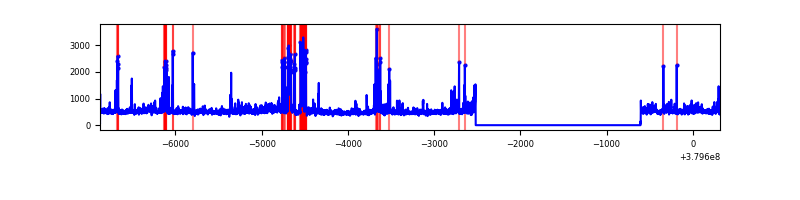 |
| C | 7190 | 5277 | 79 | 79 | 1.10% | 1.50% | 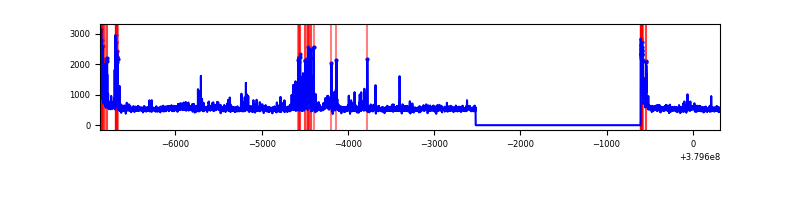 |
| D | 7190 | 5277 | 231 | 231 | 3.21% | 4.38% |  |
Top three noisy pixels from each quadrant. If the there are fewer than three noisy pixels in the level2.evt file, extra rows are filled as -1
| Pixel properties | Quadrant properties | ||||||
|---|---|---|---|---|---|---|---|
| Quadrant | DetID | PixID | Counts | Sigma | Mean | Median | Sigma |
| A | 13 | 6 | 43109 | 334.72 | 637 | 622 | 126.9 |
| A | 10 | 83 | 17039 | 129.34 | 637 | 622 | 126.9 |
| A | 13 | 254 | 10364 | 76.75 | 637 | 622 | 126.9 |
| B | 5 | 172 | 395179 | 3330.84 | 623 | 607 | 118.5 |
| B | 0 | 190 | 80276 | 672.54 | 623 | 607 | 118.5 |
| B | 0 | 189 | 65045 | 543.96 | 623 | 607 | 118.5 |
| C | 15 | 214 | 230900 | 1645.72 | 609 | 616 | 139.9 |
| C | 4 | 254 | 214809 | 1530.73 | 609 | 616 | 139.9 |
| C | 3 | 233 | 167653 | 1193.73 | 609 | 616 | 139.9 |
| D | 8 | 195 | 986380 | 6044.55 | 603 | 589 | 163.1 |
| D | 13 | 249 | 350427 | 2145.09 | 603 | 589 | 163.1 |
| D | 2 | 152 | 222828 | 1362.7 | 603 | 589 | 163.1 |
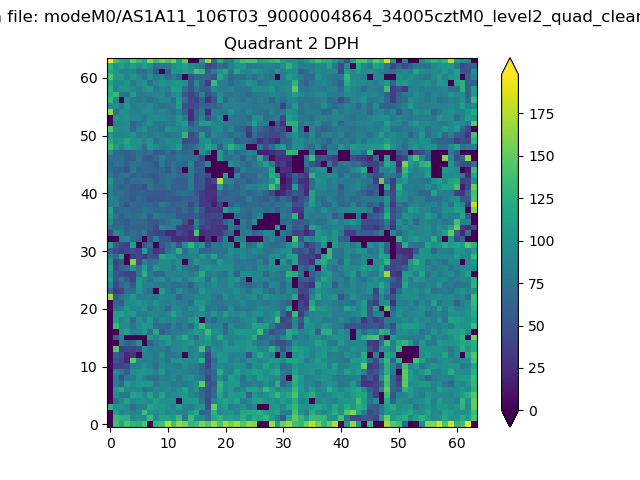
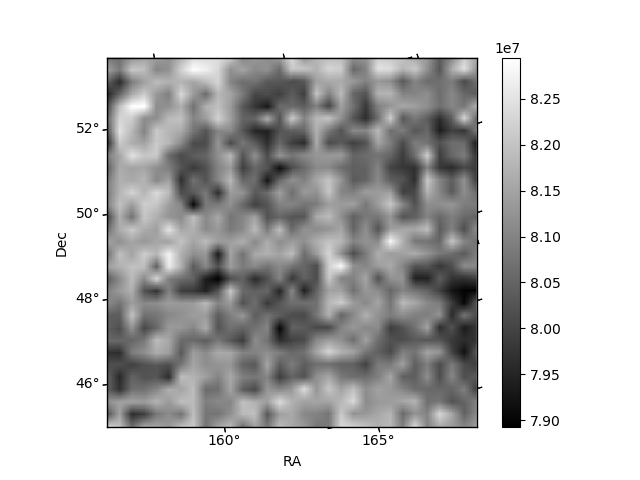
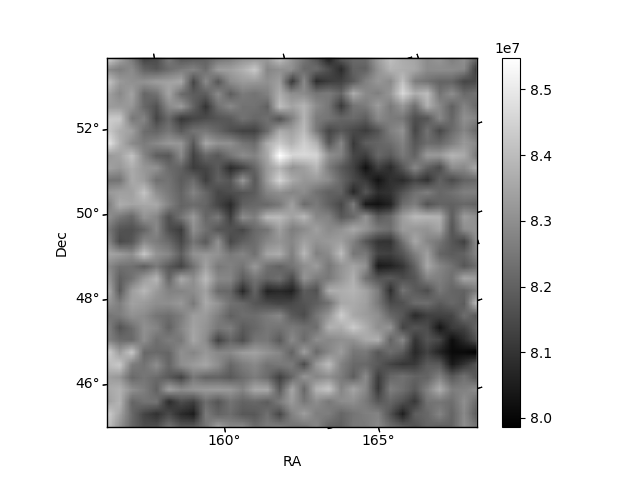
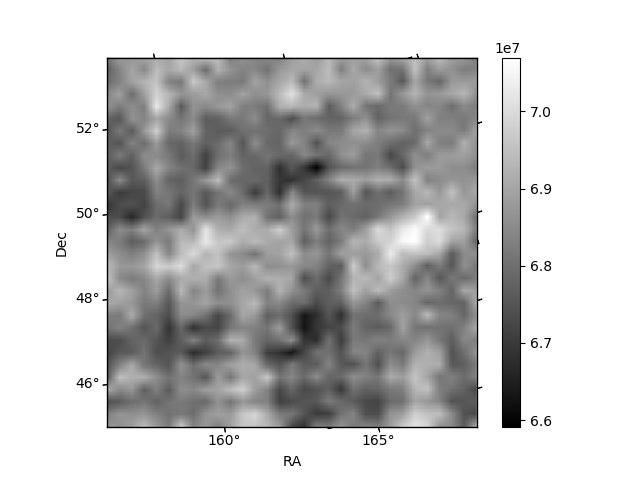
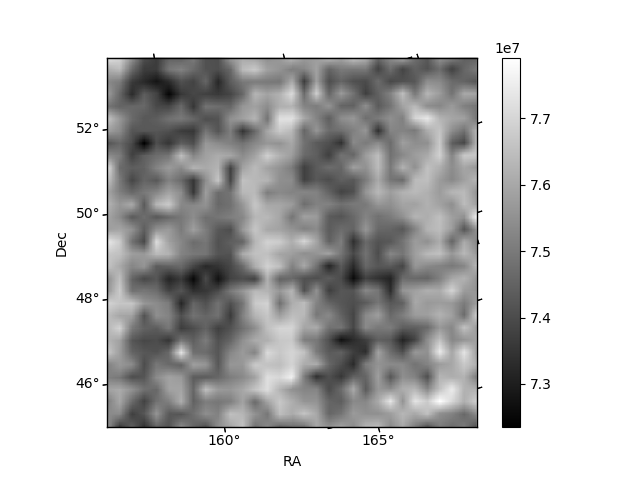
Histogram calculated using DETX and DETY for each event in the final _common_clean file
| Quadrant A | 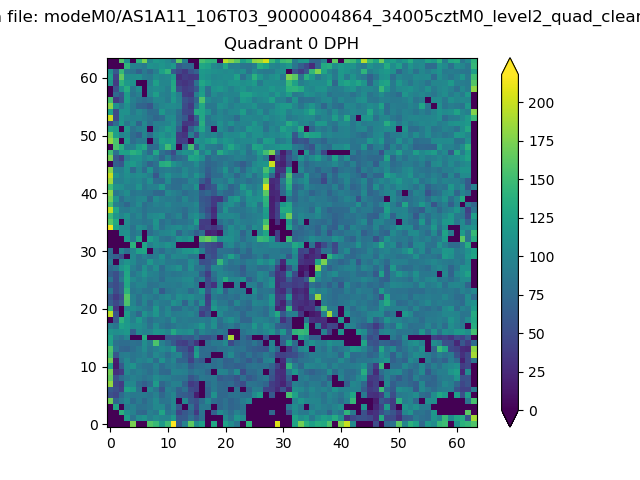 |
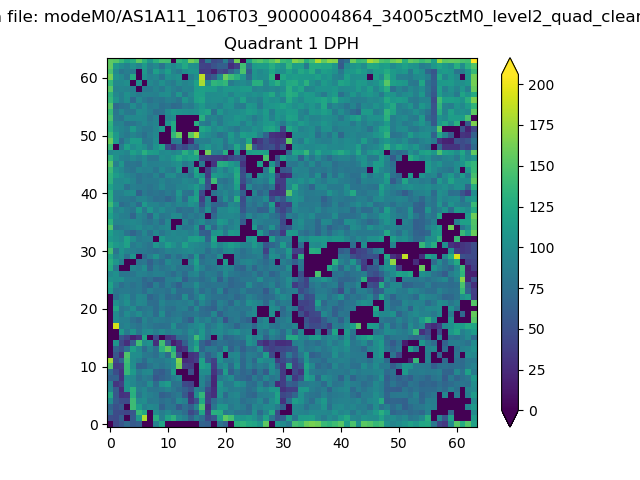 |
Quadrant B |
|---|---|---|---|
| Quadrant D | 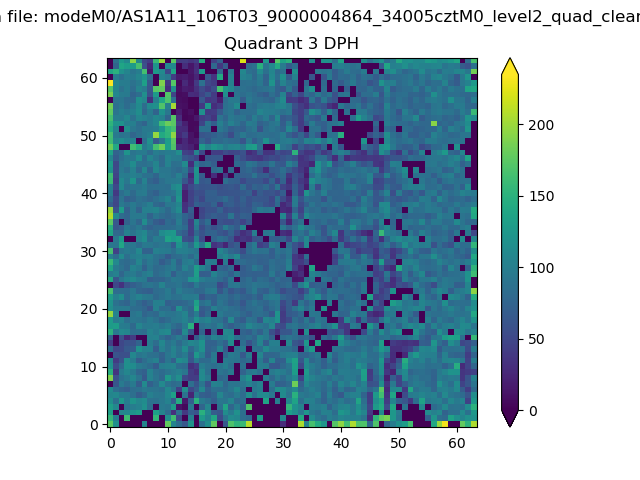 |
 |
Quadrant C |
| Plot type | Count rate plots | Images |
|---|---|---|
| Comparison with Poisson distribution Blue bars denote a histogram of data divided into 1 sec bins. Red curve is a Poisson curve with rate = median count rate of data. |
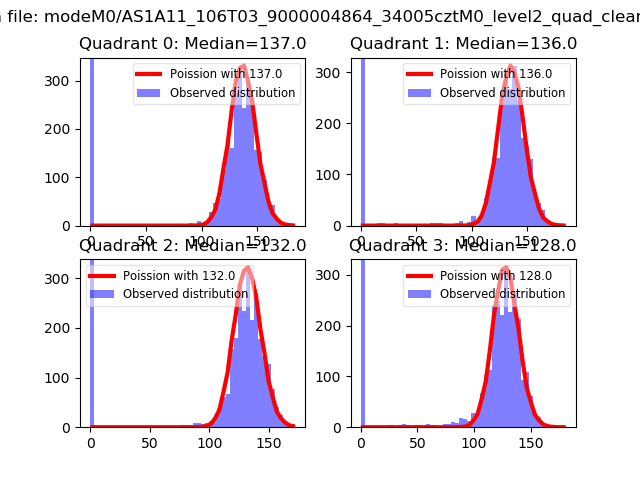 |
 |
| Quadrant-wise count rates Data is divided into 100 sec bins |
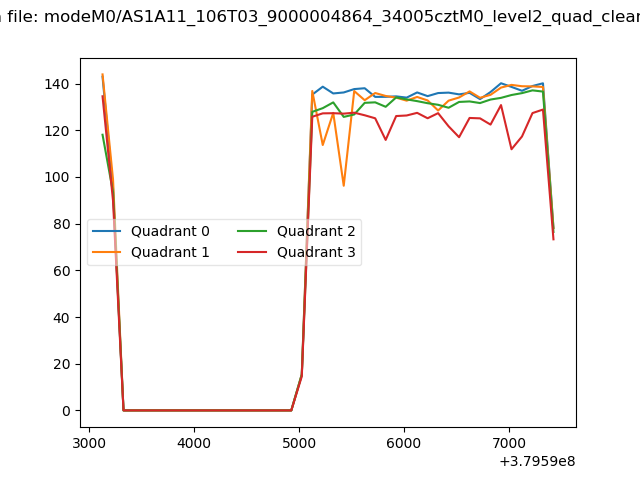 |
|
| Module-wise count rates for Quadrant A Data is divided into 100 sec bins |
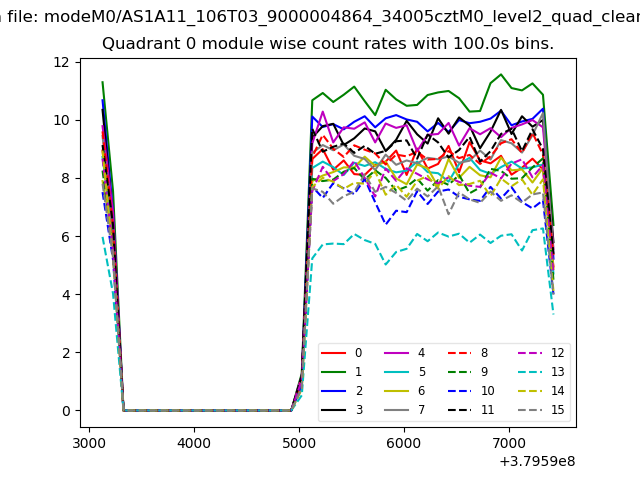 |
 |
| Module-wise count rates for Quadrant B Data is divided into 100 sec bins |
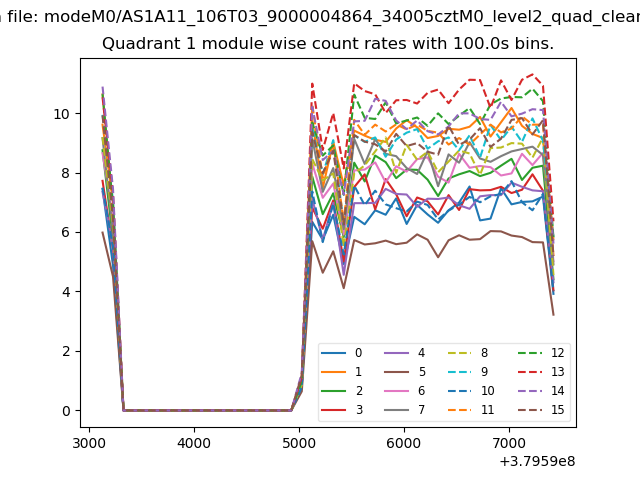 |
 |
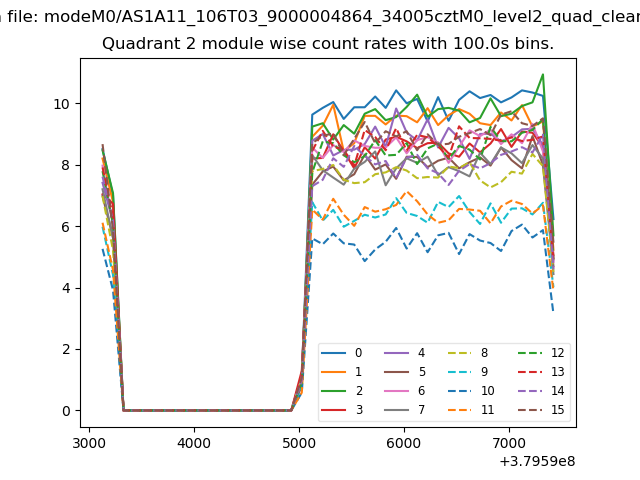
| Module-wise count rates for Quadrant C Data is divided into 100 sec bins |
 |
 |
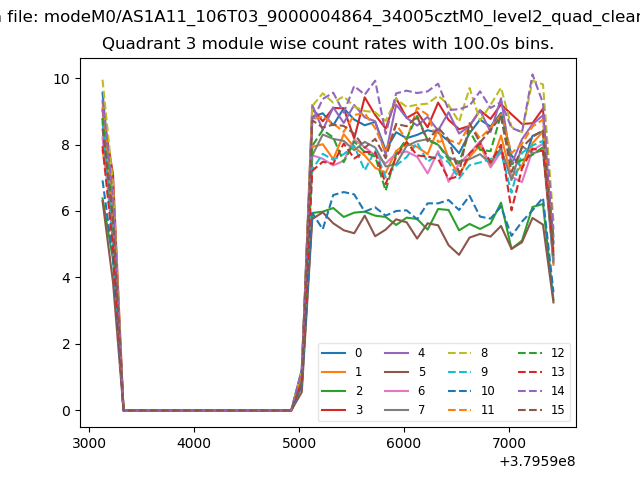
| Module-wise count rates for Quadrant D Data is divided into 100 sec bins |
 |
 |
| Parameter | Plot |
|---|---|
| CZT HV Monitor | 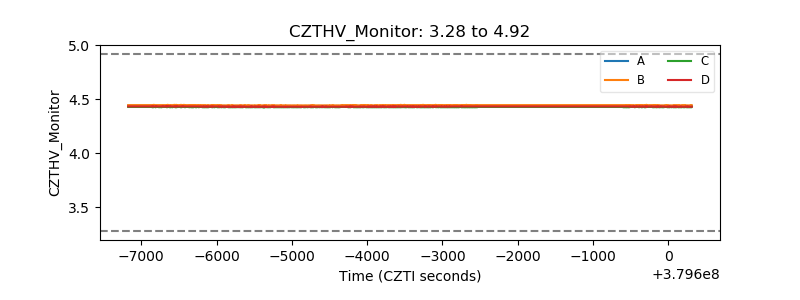 |
| D_VDD |  |
| Temperature 1 | 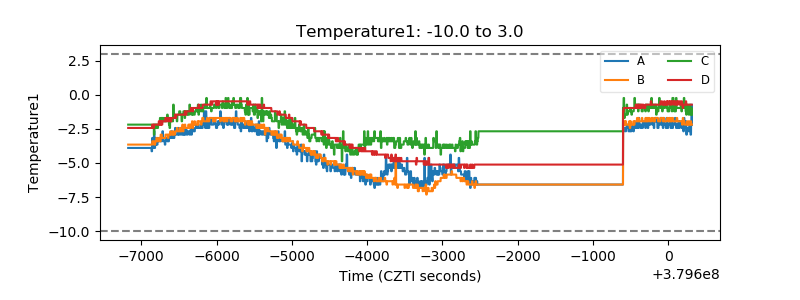 |
| Veto HV Monitor | 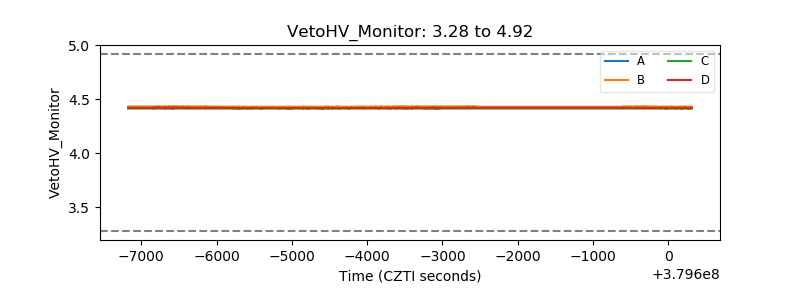 |
| Veto LLD | 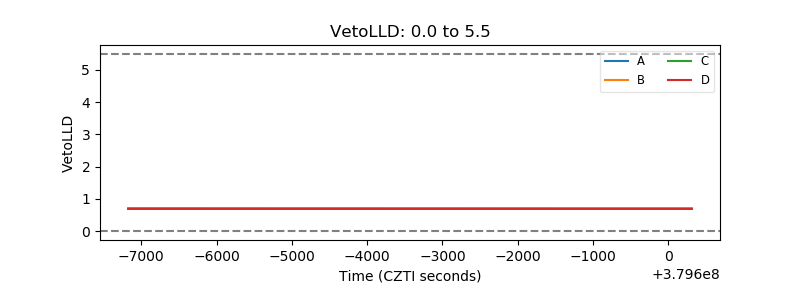 |
| Alpha Counter | 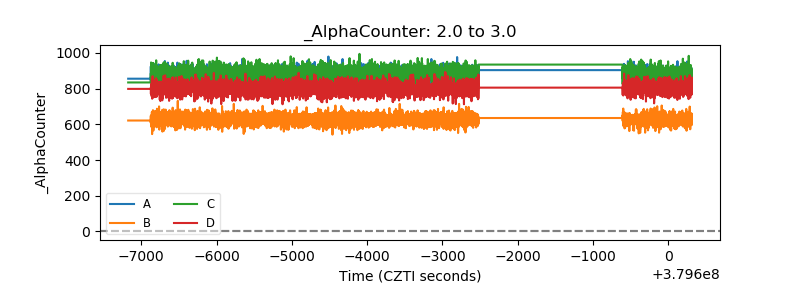 |
| _CPM_Rate | 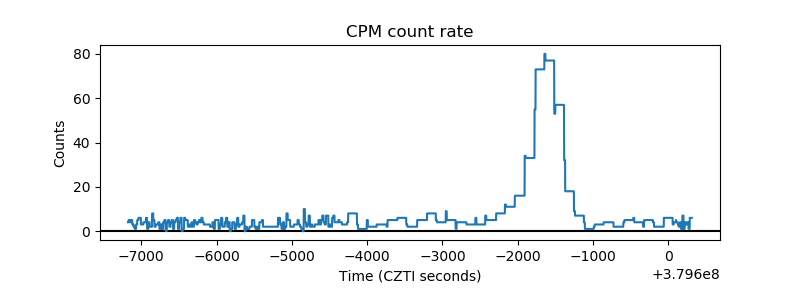 |
| CZT Counter | 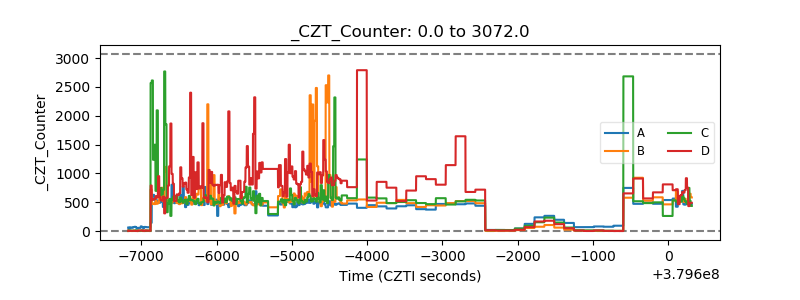 |
| +2.5 Volts monitor | 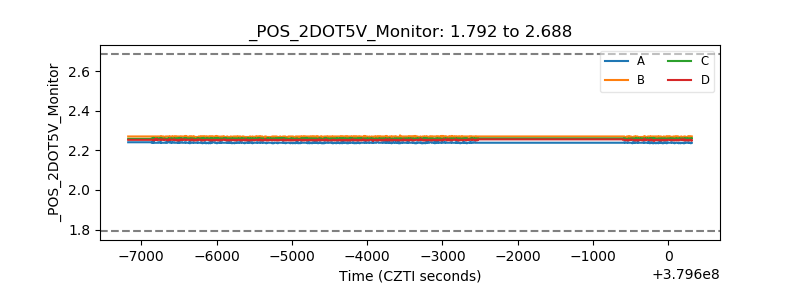 |
| +5 Volts monitor |  |
| _ROLL_ROT | 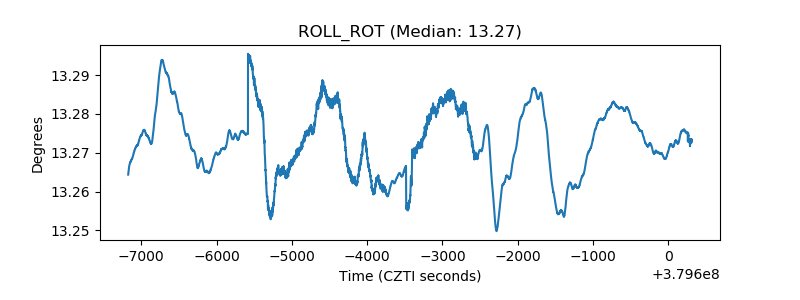 |
| _Roll_DEC | 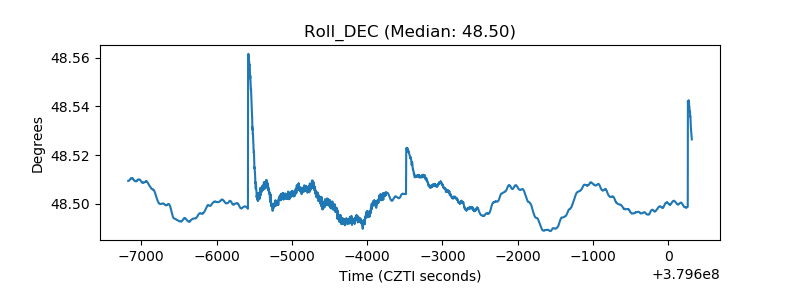 |
| _Roll_RA | 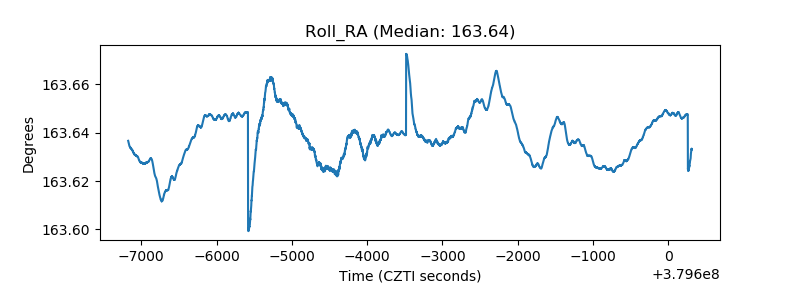 |
| Veto Counter | 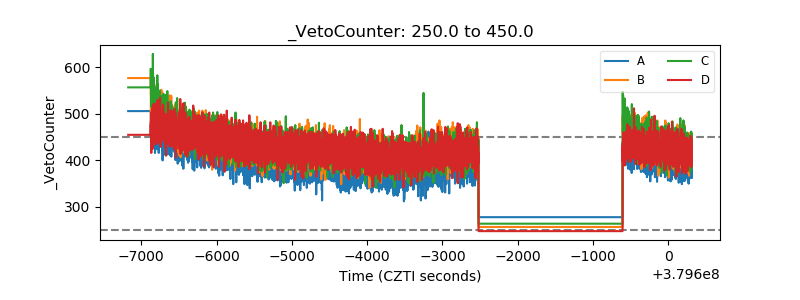 |