| Param | Original file | Final file |
|---|---|---|
| Filename | modeM0/AS1A11_106T03_9000004864_34006cztM0_level2.evt | modeM0/AS1A11_106T03_9000004864_34006cztM0_level2_quad_clean.evt |
| Size (bytes) | 498,804,480 | 65,044,800 |
| Size | 475.7 MB | 62.0 MB |
| Events in quadrant A | 2,620,855 | 408,590 |
| Events in quadrant B | 2,996,147 | 406,528 |
| Events in quadrant C | 4,076,479 | 379,796 |
| Events in quadrant D | 5,029,827 | 379,135 |
| Mode M9 | |||
|---|---|---|---|
| Quadrant | BADHDUFLAG | Total packets | Discarded packets |
| A | 0 | 21 | 0 |
| B | 0 | 21 | 0 |
| C | 0 | 21 | 0 |
| D | 0 | 22 | 0 |
| Mode M0 | |||
|---|---|---|---|
| Quadrant | BADHDUFLAG | Total packets | Discarded packets |
| A | 0 | 11419 | 3 |
| B | 0 | 12466 | 2 |
| C | 0 | 15435 | 2 |
| D | 0 | 18787 | 2 |
| Mode SS | |||
|---|---|---|---|
| Quadrant | BADHDUFLAG | Total packets | Discarded packets |
| A | 0 | 116 | 0 |
| B | 0 | 116 | 0 |
| C | 0 | 116 | 0 |
| D | 0 | 116 | 0 |
| Quadrant | Total seconds | Saturated seconds | Saturation percentage |
|---|---|---|---|
| A | 5648 | 11 | 0.194759% |
| B | 5648 | 38 | 0.672805% |
| C | 5648 | 326 | 5.771955% |
| D | 5648 | 283 | 5.010623% |
Noise dominated data is calculated using 1-second bins in cleaned event files. If a bin has >2000 counts, and if more than 50% of those come from <1% of pixels, then it is considered to be noise-dominated and hence unusable.
| Quadrant | # 1 sec bins | Bins with >0 counts | Bins with >2000 counts | High rate bins dominated by noise | Noise dominated (total time) | Noise dominated (detector-on time) | Marked lightcurve |
|---|---|---|---|---|---|---|---|
| A | 7230 | 5649 | 3 | 3 | 0.04% | 0.05% | 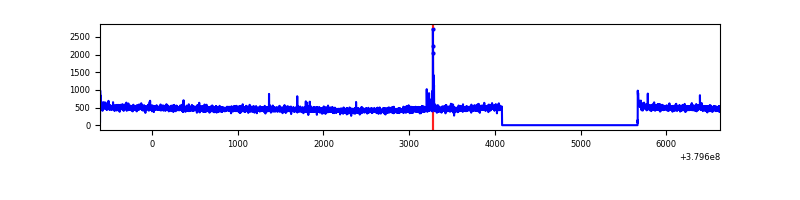 |
| B | 7230 | 5649 | 28 | 28 | 0.39% | 0.50% | 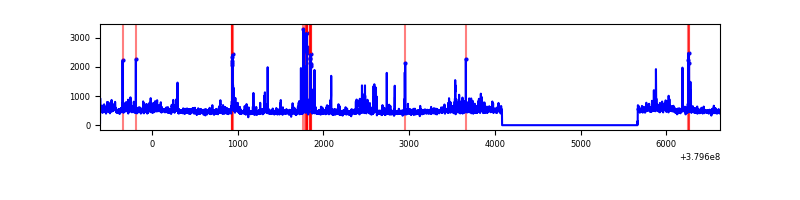 |
| C | 7230 | 5649 | 314 | 314 | 4.34% | 5.56% | 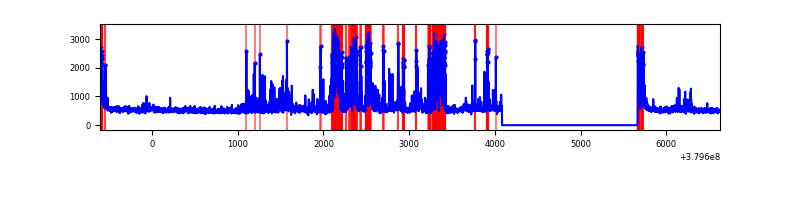 |
| D | 7230 | 5649 | 236 | 236 | 3.26% | 4.18% | 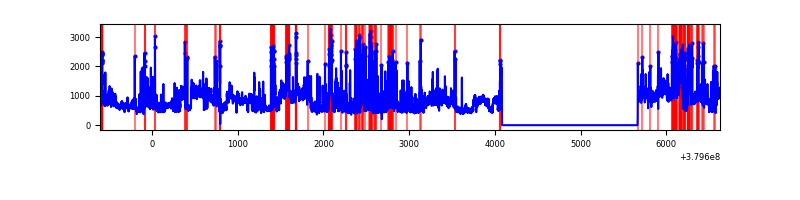 |
Top three noisy pixels from each quadrant. If the there are fewer than three noisy pixels in the level2.evt file, extra rows are filled as -1
| Pixel properties | Quadrant properties | ||||||
|---|---|---|---|---|---|---|---|
| Quadrant | DetID | PixID | Counts | Sigma | Mean | Median | Sigma |
| A | 13 | 6 | 20555 | 149.37 | 663 | 648 | 133.3 |
| A | 10 | 83 | 18050 | 130.57 | 663 | 648 | 133.3 |
| A | 0 | 31 | 17881 | 129.31 | 663 | 648 | 133.3 |
| B | 5 | 172 | 138241 | 1107.75 | 659 | 644 | 124.2 |
| B | 0 | 190 | 127843 | 1024.04 | 659 | 644 | 124.2 |
| B | 0 | 189 | 58584 | 466.46 | 659 | 644 | 124.2 |
| C | 4 | 254 | 969230 | 6707.76 | 625 | 628 | 144.4 |
| C | 15 | 214 | 242808 | 1677.14 | 625 | 628 | 144.4 |
| C | 0 | 10 | 185082 | 1277.38 | 625 | 628 | 144.4 |
| D | 8 | 195 | 1390925 | 8308.67 | 630 | 616 | 167.3 |
| D | 13 | 249 | 324836 | 1937.58 | 630 | 616 | 167.3 |
| D | 12 | 6 | 164270 | 978.02 | 630 | 616 | 167.3 |
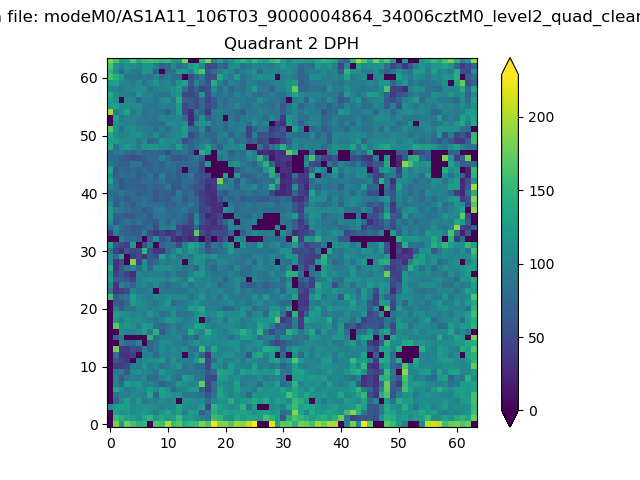
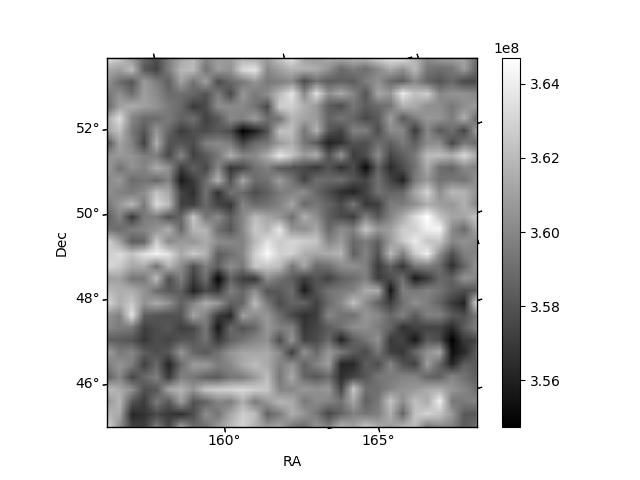
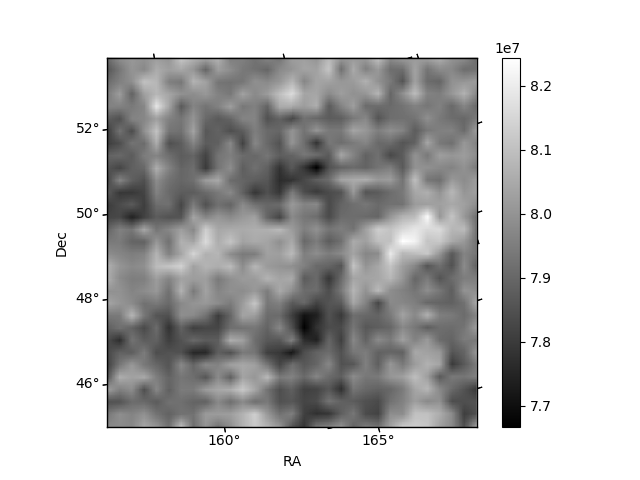
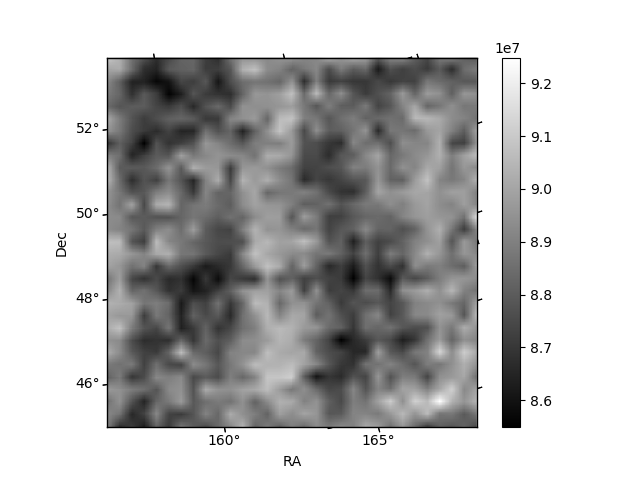
Histogram calculated using DETX and DETY for each event in the final _common_clean file
| Quadrant A | 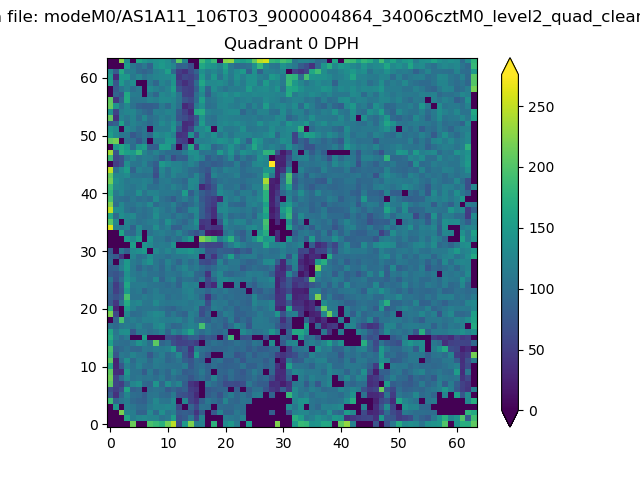 |
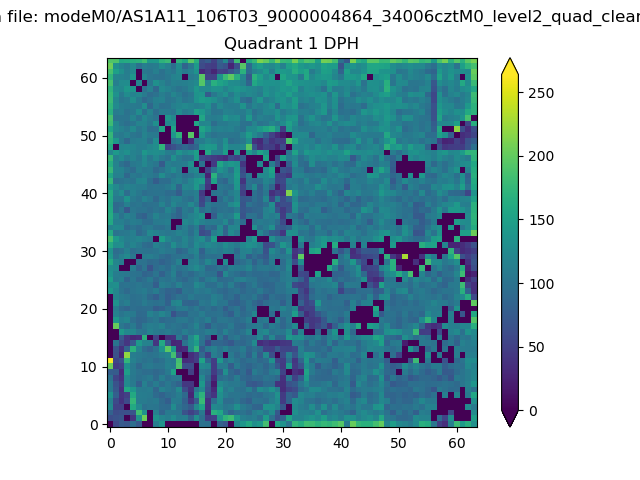 |
Quadrant B |
|---|---|---|---|
| Quadrant D | 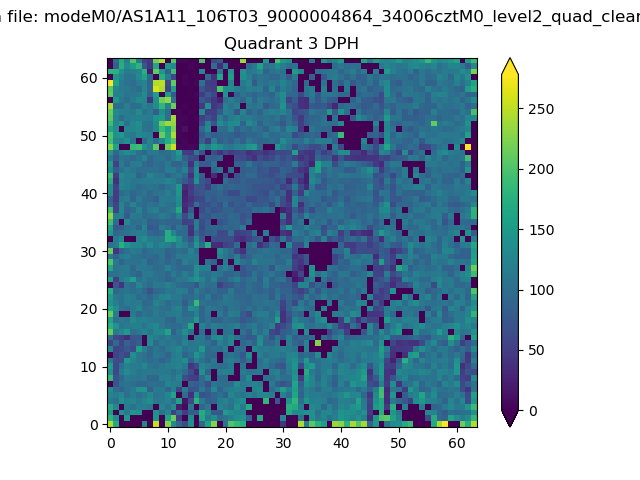 |
 |
Quadrant C |
| Plot type | Count rate plots | Images |
|---|---|---|
| Comparison with Poisson distribution Blue bars denote a histogram of data divided into 1 sec bins. Red curve is a Poisson curve with rate = median count rate of data. |
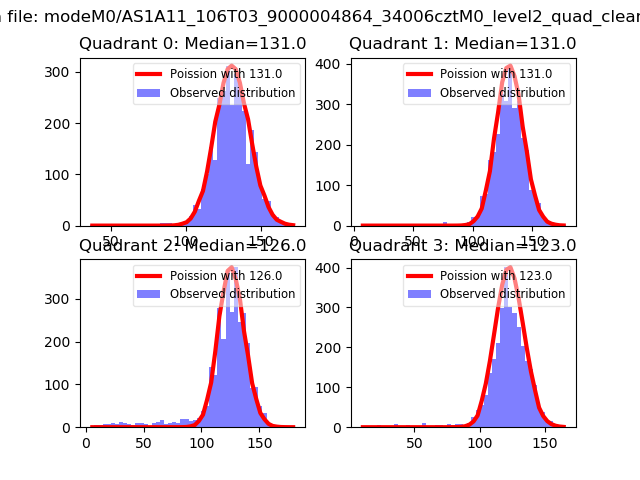 |
 |
| Quadrant-wise count rates Data is divided into 100 sec bins |
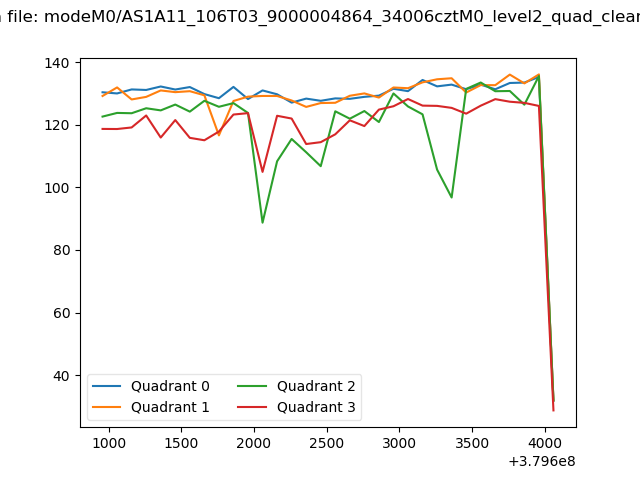 |
|
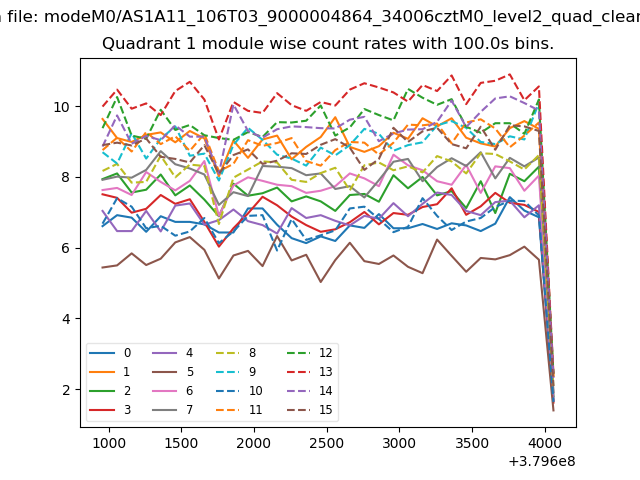
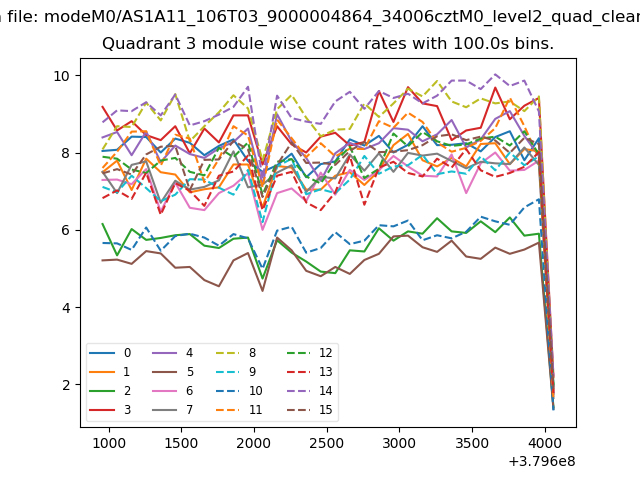
| Module-wise count rates for Quadrant A Data is divided into 100 sec bins |
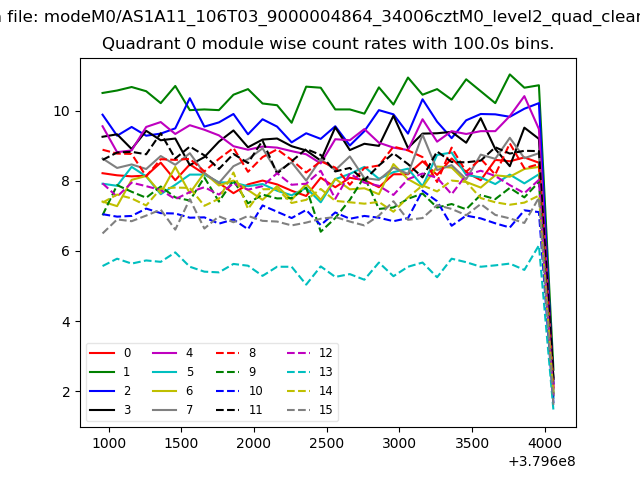 |
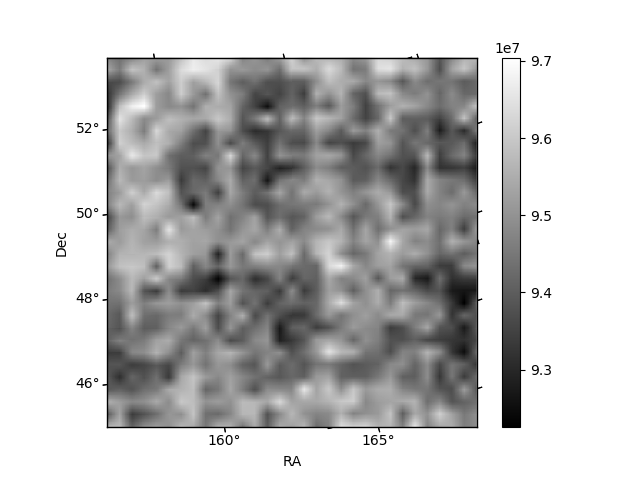 |
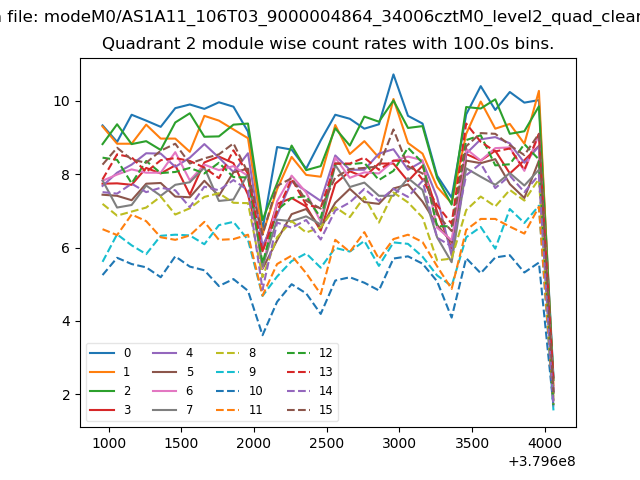
| Module-wise count rates for Quadrant B Data is divided into 100 sec bins |
 |
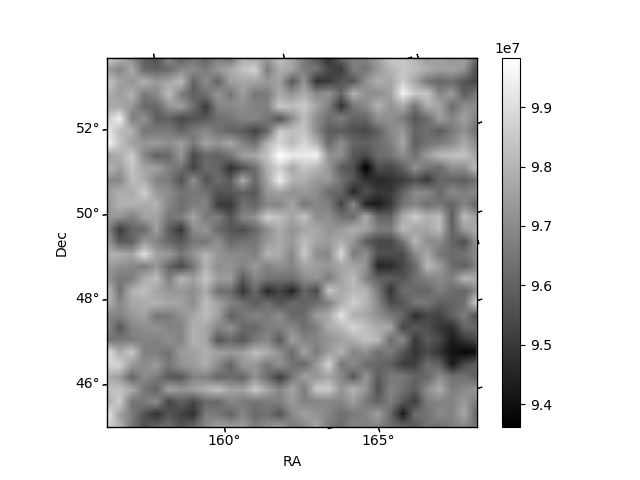 |
| Module-wise count rates for Quadrant C Data is divided into 100 sec bins |
 |
 |
| Module-wise count rates for Quadrant D Data is divided into 100 sec bins |
 |
 |
| Parameter | Plot |
|---|---|
| CZT HV Monitor |  |
| D_VDD | 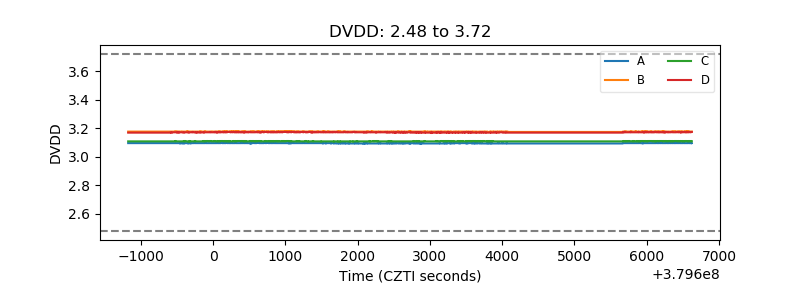 |
| Temperature 1 | 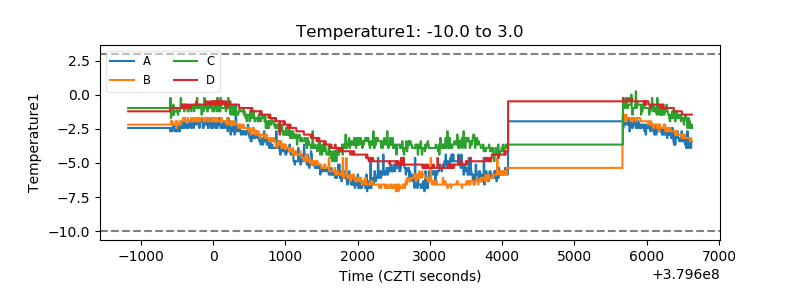 |
| Veto HV Monitor | 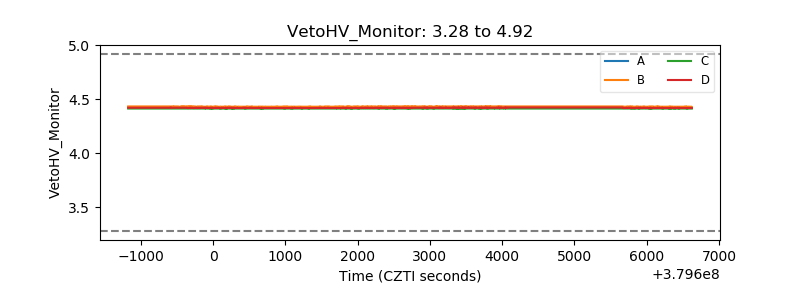 |
| Veto LLD | 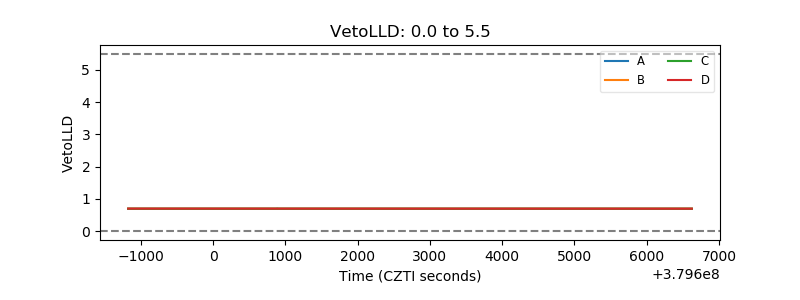 |
| Alpha Counter | 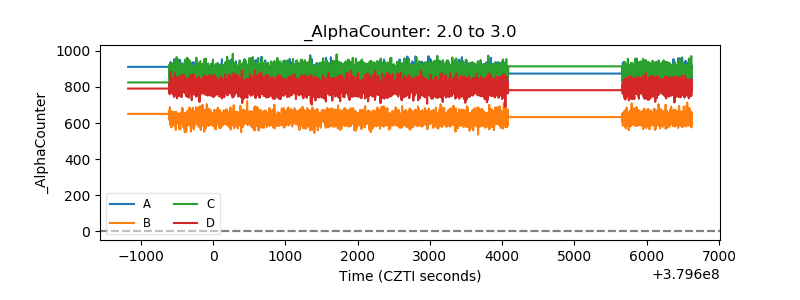 |
| _CPM_Rate | 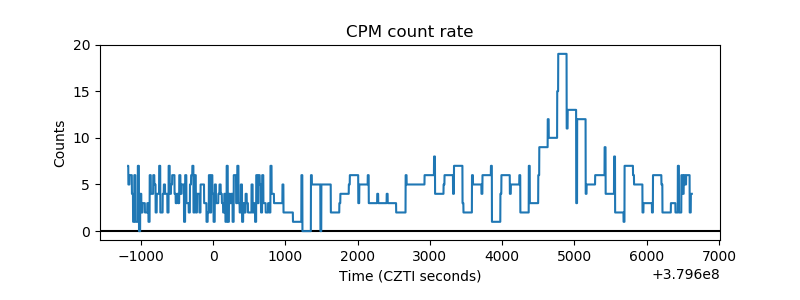 |
| CZT Counter | 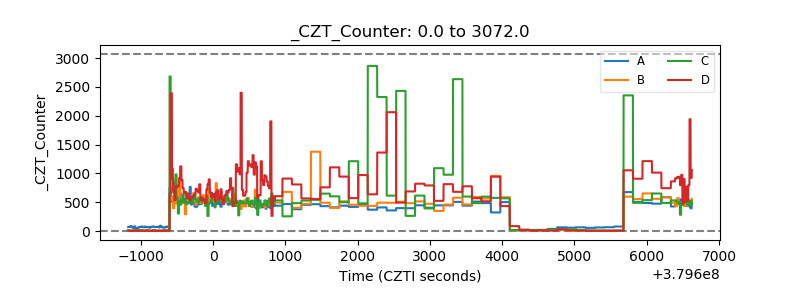 |
| +2.5 Volts monitor |  |
| +5 Volts monitor |  |
| _ROLL_ROT |  |
| _Roll_DEC | 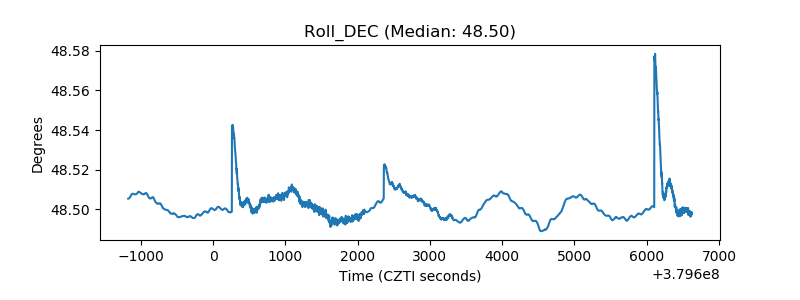 |
| _Roll_RA | 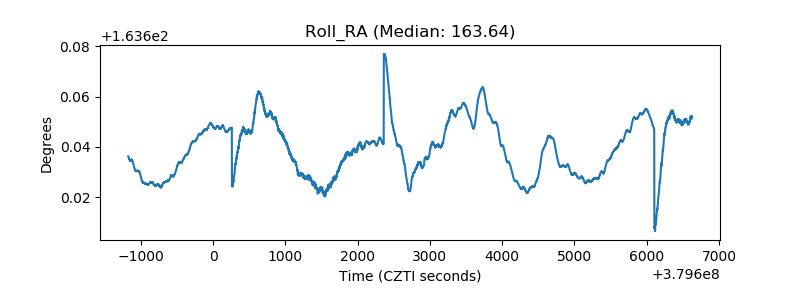 |
| Veto Counter | 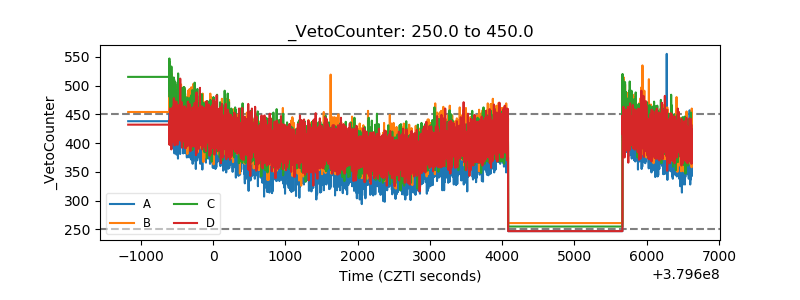 |