| Param | Original file | Final file |
|---|---|---|
| Filename | modeM0/AS1A11_106T03_9000004864_34007cztM0_level2.evt | modeM0/AS1A11_106T03_9000004864_34007cztM0_level2_quad_clean.evt |
| Size (bytes) | 510,845,760 | 78,799,680 |
| Size | 487.2 MB | 75.1 MB |
| Events in quadrant A | 2,671,436 | 508,117 |
| Events in quadrant B | 3,384,496 | 504,585 |
| Events in quadrant C | 3,378,942 | 497,939 |
| Events in quadrant D | 5,640,696 | 467,546 |
| Mode M9 | |||
|---|---|---|---|
| Quadrant | BADHDUFLAG | Total packets | Discarded packets |
| A | 0 | 23 | 0 |
| B | 0 | 23 | 0 |
| C | 0 | 23 | 0 |
| D | 0 | 24 | 0 |
| Mode M0 | |||
|---|---|---|---|
| Quadrant | BADHDUFLAG | Total packets | Discarded packets |
| A | 0 | 11804 | 3 |
| B | 0 | 13865 | 2 |
| C | 0 | 13500 | 2 |
| D | 0 | 20898 | 2 |
| Mode SS | |||
|---|---|---|---|
| Quadrant | BADHDUFLAG | Total packets | Discarded packets |
| A | 0 | 118 | 0 |
| B | 0 | 118 | 0 |
| C | 0 | 118 | 0 |
| D | 0 | 118 | 0 |
| Quadrant | Total seconds | Saturated seconds | Saturation percentage |
|---|---|---|---|
| A | 5838 | 6 | 0.102775% |
| B | 5838 | 121 | 2.072628% |
| C | 5838 | 90 | 1.541624% |
| D | 5838 | 432 | 7.399794% |
Noise dominated data is calculated using 1-second bins in cleaned event files. If a bin has >2000 counts, and if more than 50% of those come from <1% of pixels, then it is considered to be noise-dominated and hence unusable.
| Quadrant | # 1 sec bins | Bins with >0 counts | Bins with >2000 counts | High rate bins dominated by noise | Noise dominated (total time) | Noise dominated (detector-on time) | Marked lightcurve |
|---|---|---|---|---|---|---|---|
| A | 7181 | 5839 | 0 | 0 | 0.00% | 0.00% | 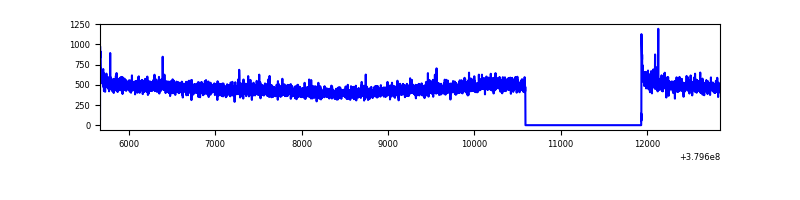 |
| B | 7181 | 5839 | 76 | 76 | 1.06% | 1.30% | 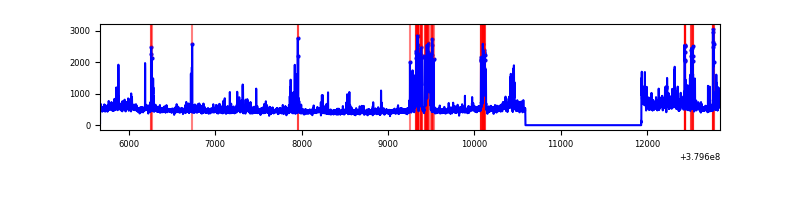 |
| C | 7181 | 5839 | 83 | 83 | 1.16% | 1.42% | 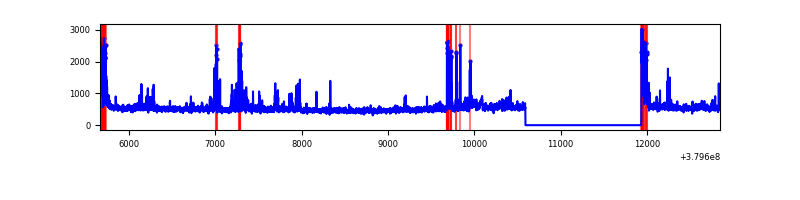 |
| D | 7181 | 5839 | 376 | 376 | 5.24% | 6.44% | 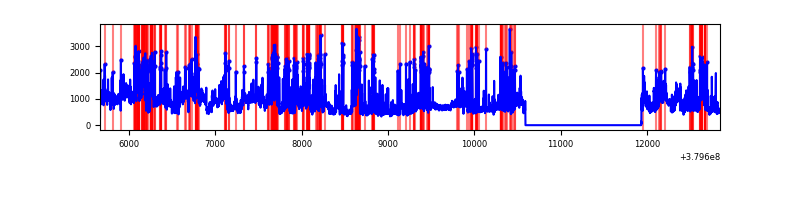 |
Top three noisy pixels from each quadrant. If the there are fewer than three noisy pixels in the level2.evt file, extra rows are filled as -1
| Pixel properties | Quadrant properties | ||||||
|---|---|---|---|---|---|---|---|
| Quadrant | DetID | PixID | Counts | Sigma | Mean | Median | Sigma |
| A | 10 | 83 | 18386 | 130.19 | 680 | 665 | 136.1 |
| A | 13 | 6 | 13398 | 93.55 | 680 | 665 | 136.1 |
| A | 13 | 254 | 10898 | 75.18 | 680 | 665 | 136.1 |
| B | 5 | 172 | 444263 | 3433.76 | 674 | 657 | 129.2 |
| B | 0 | 189 | 86142 | 661.7 | 674 | 657 | 129.2 |
| B | 0 | 197 | 38586 | 293.59 | 674 | 657 | 129.2 |
| C | 15 | 214 | 252669 | 1666.32 | 656 | 661 | 151.2 |
| C | 4 | 254 | 233010 | 1536.33 | 656 | 661 | 151.2 |
| C | 0 | 10 | 174229 | 1147.66 | 656 | 661 | 151.2 |
| D | 8 | 195 | 1340168 | 8003.34 | 643 | 628 | 167.4 |
| D | 12 | 6 | 541789 | 3233.27 | 643 | 628 | 167.4 |
| D | 13 | 249 | 292293 | 1742.61 | 643 | 628 | 167.4 |
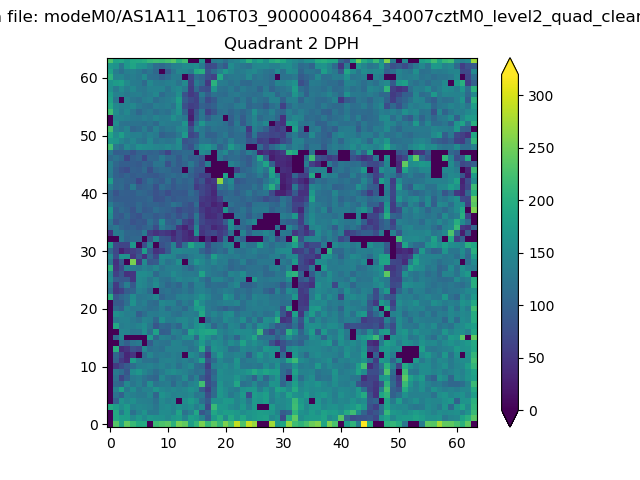
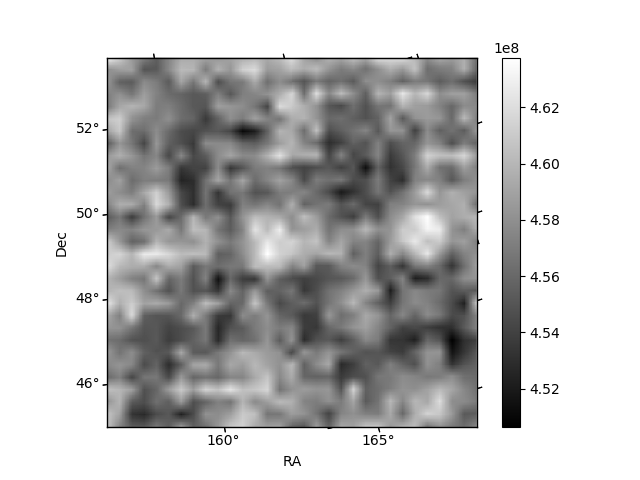
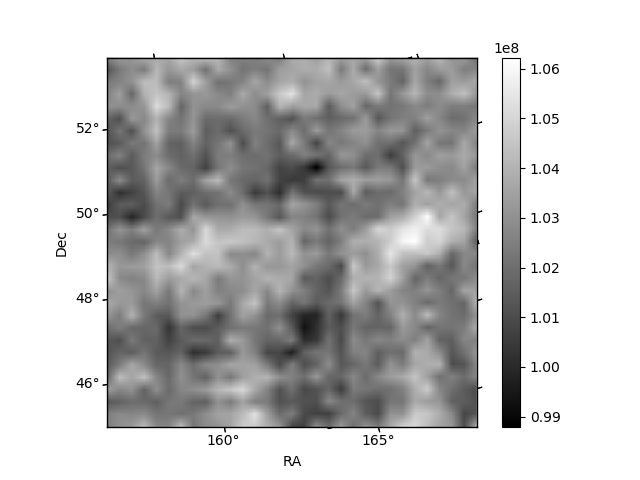
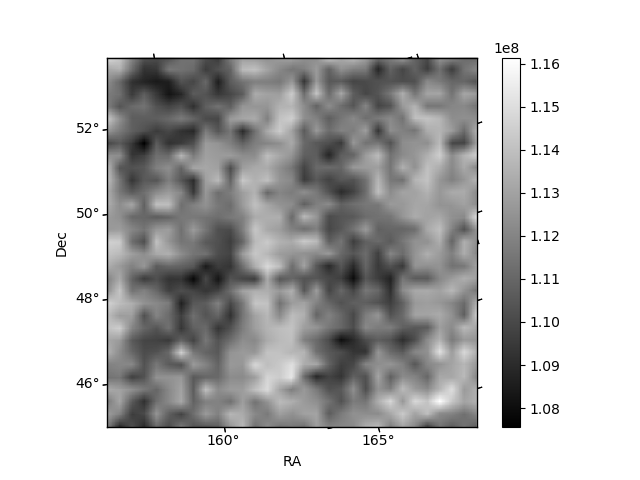
Histogram calculated using DETX and DETY for each event in the final _common_clean file
| Quadrant A | 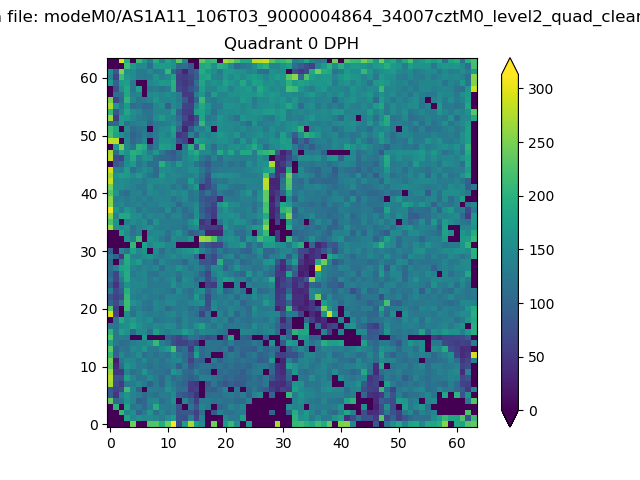 |
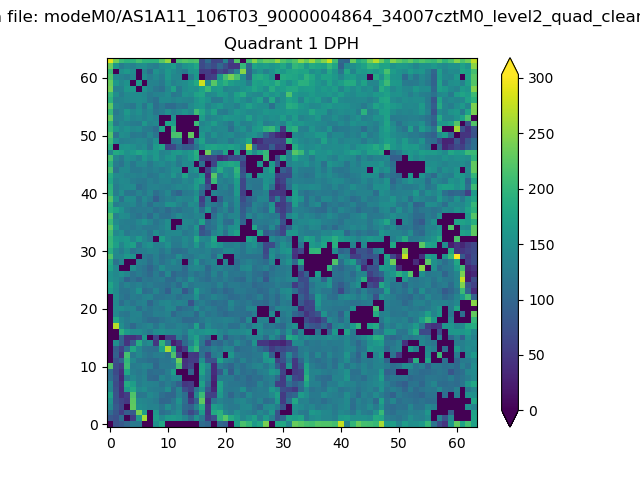 |
Quadrant B |
|---|---|---|---|
| Quadrant D | 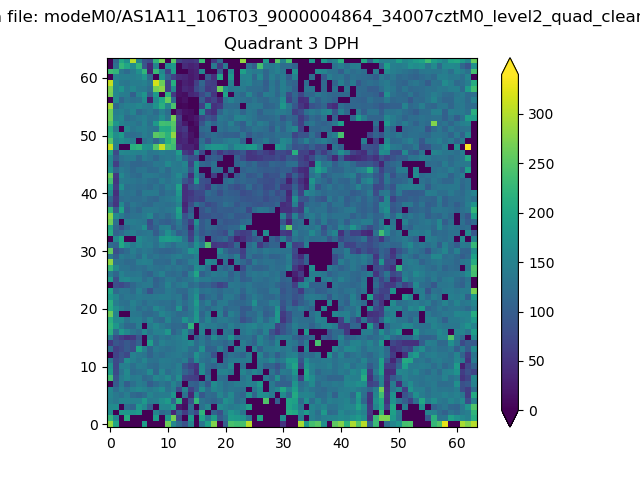 |
 |
Quadrant C |
| Plot type | Count rate plots | Images |
|---|---|---|
| Comparison with Poisson distribution Blue bars denote a histogram of data divided into 1 sec bins. Red curve is a Poisson curve with rate = median count rate of data. |
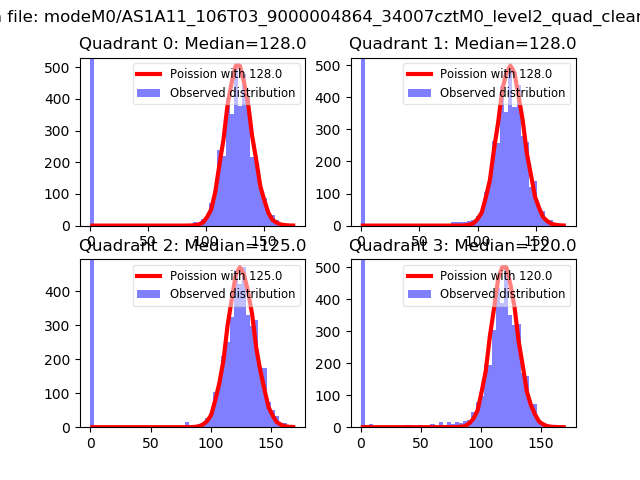 |
 |
| Quadrant-wise count rates Data is divided into 100 sec bins |
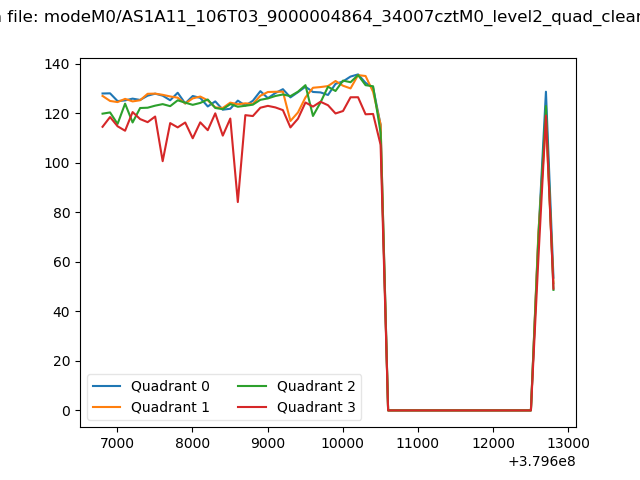 |
|
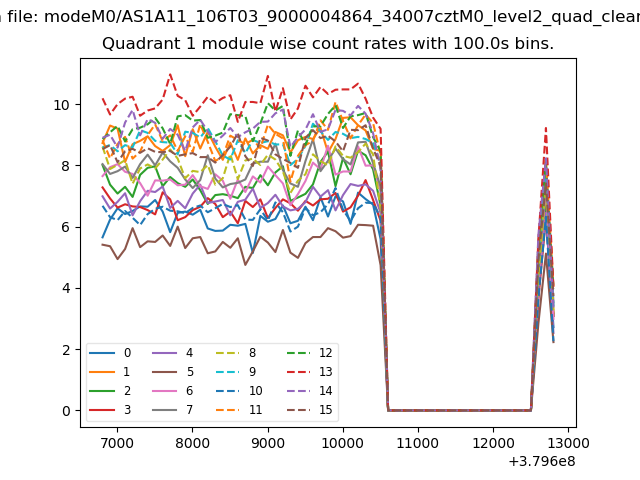
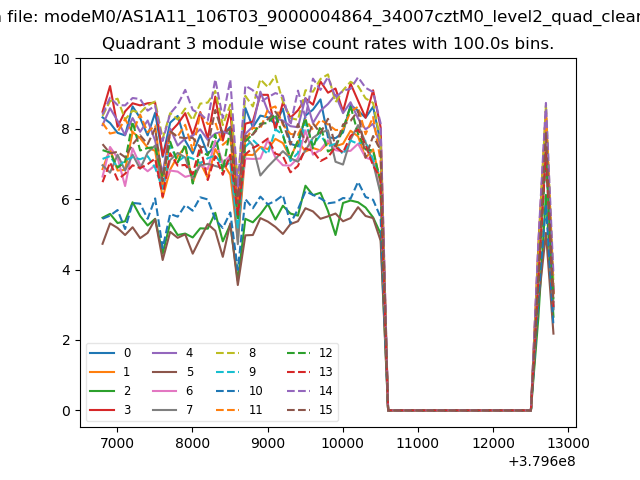
| Module-wise count rates for Quadrant A Data is divided into 100 sec bins |
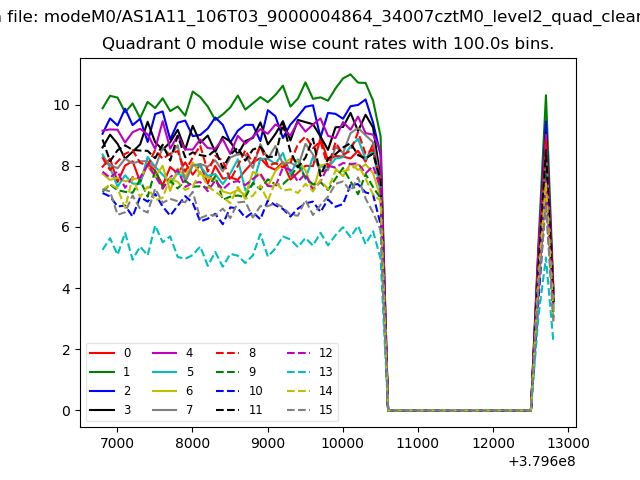 |
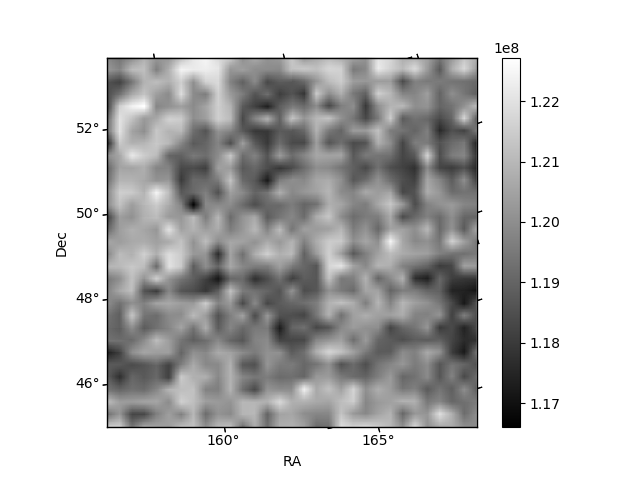 |
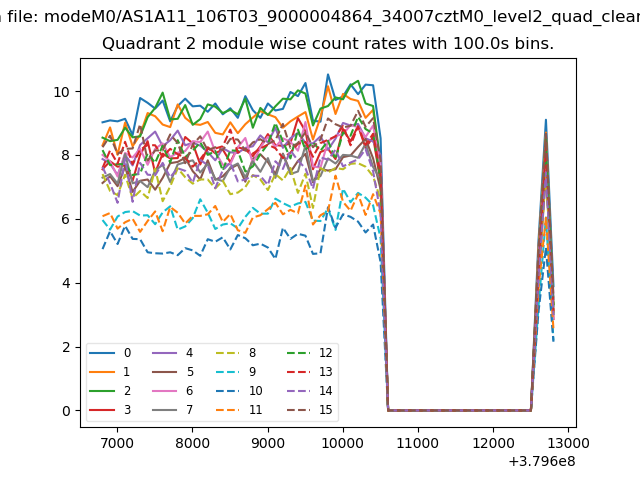
| Module-wise count rates for Quadrant B Data is divided into 100 sec bins |
 |
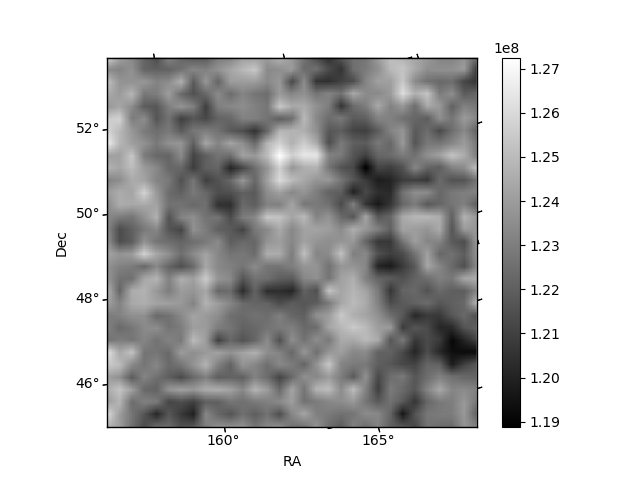 |
| Module-wise count rates for Quadrant C Data is divided into 100 sec bins |
 |
 |
| Module-wise count rates for Quadrant D Data is divided into 100 sec bins |
 |
 |
| Parameter | Plot |
|---|---|
| CZT HV Monitor | 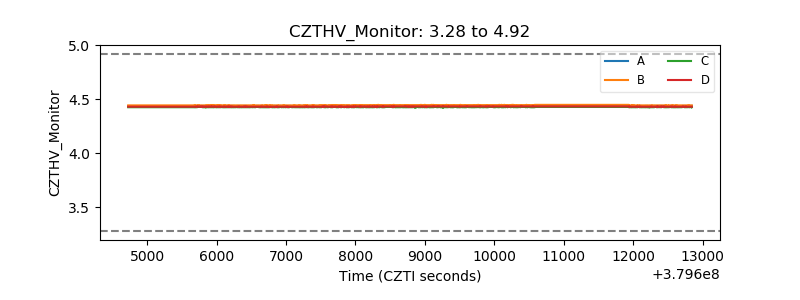 |
| D_VDD | 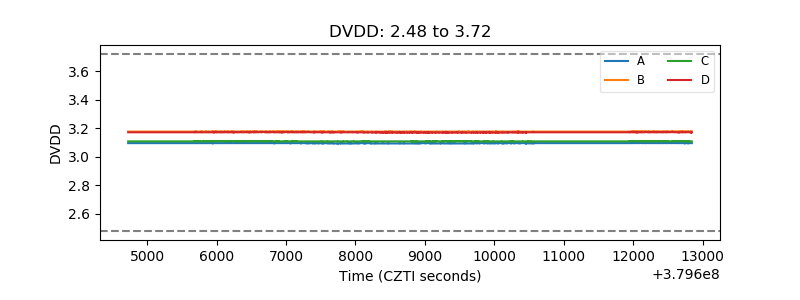 |
| Temperature 1 | 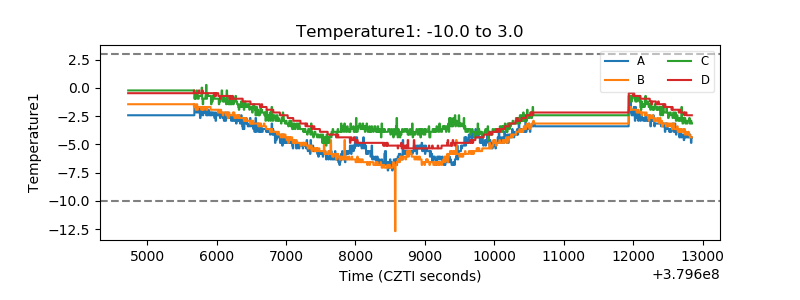 |
| Veto HV Monitor | 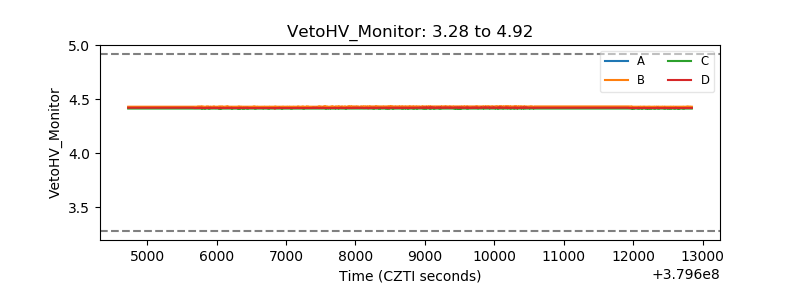 |
| Veto LLD | 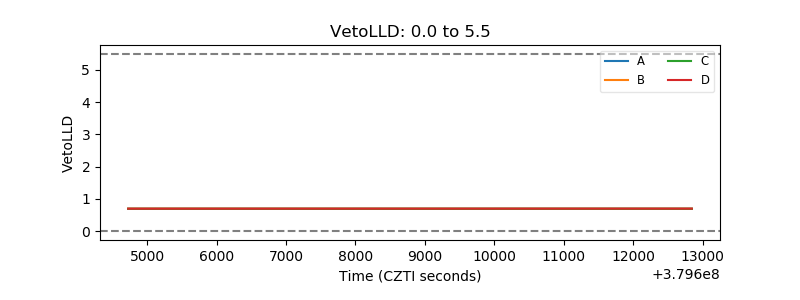 |
| Alpha Counter | 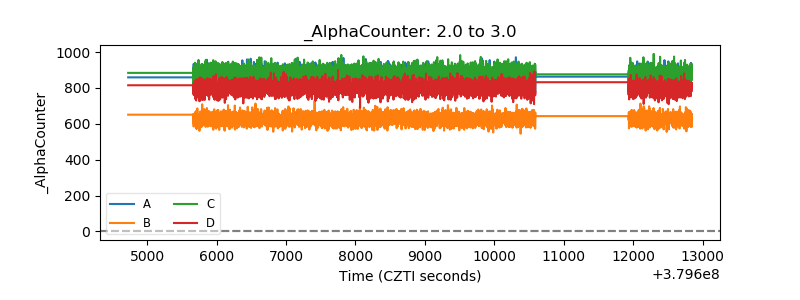 |
| _CPM_Rate | 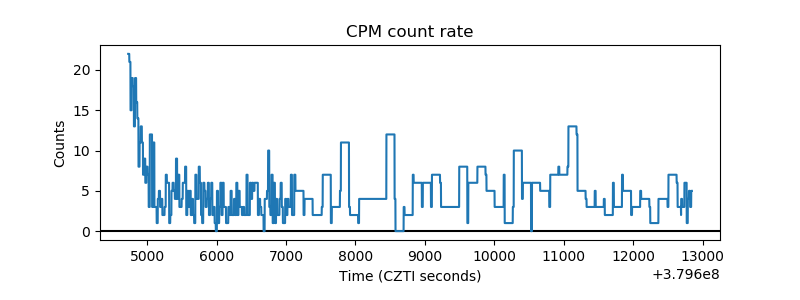 |
| CZT Counter | 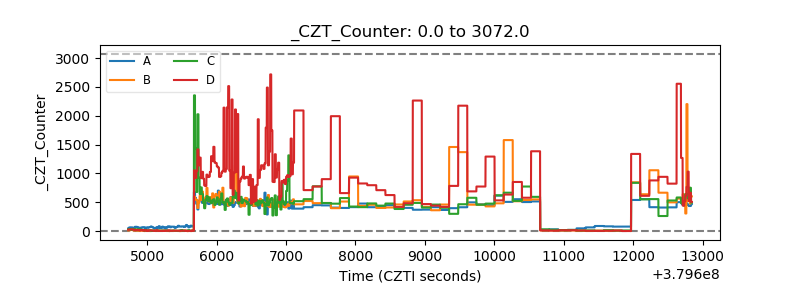 |
| +2.5 Volts monitor |  |
| +5 Volts monitor |  |
| _ROLL_ROT | 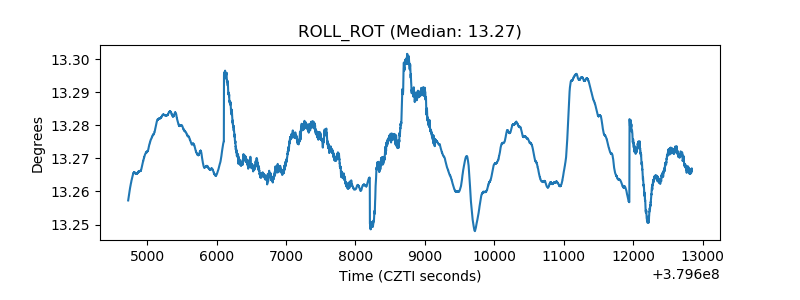 |
| _Roll_DEC | 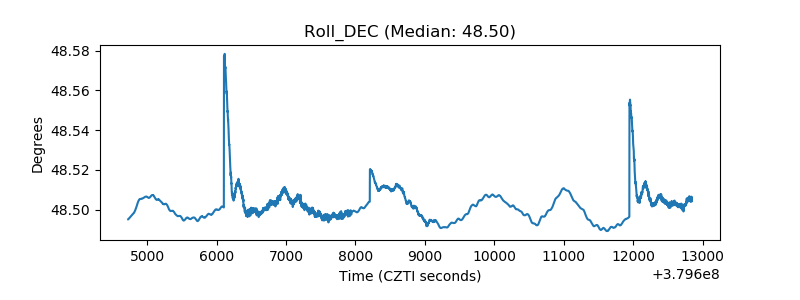 |
| _Roll_RA | 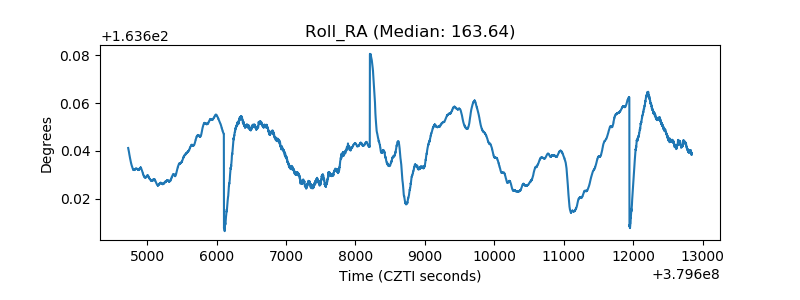 |
| Veto Counter | 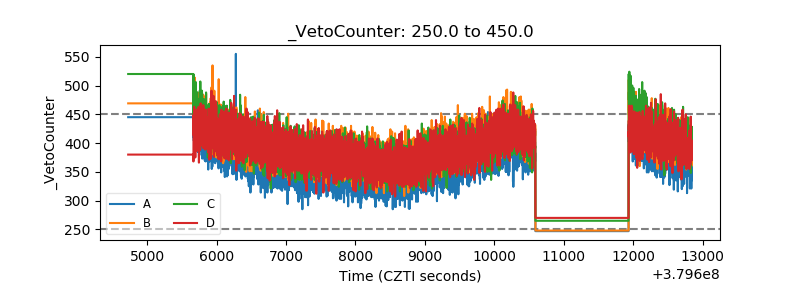 |