| Param | Original file | Final file |
|---|---|---|
| Filename | modeM0/AS1A11_106T03_9000004864_34008cztM0_level2.evt | modeM0/AS1A11_106T03_9000004864_34008cztM0_level2_quad_clean.evt |
| Size (bytes) | 556,542,720 | 90,138,240 |
| Size | 530.8 MB | 86.0 MB |
| Events in quadrant A | 2,743,074 | 598,685 |
| Events in quadrant B | 3,662,595 | 590,976 |
| Events in quadrant C | 4,178,980 | 580,497 |
| Events in quadrant D | 5,866,226 | 542,617 |
| Mode M9 | |||
|---|---|---|---|
| Quadrant | BADHDUFLAG | Total packets | Discarded packets |
| A | 0 | 27 | 0 |
| B | 0 | 27 | 0 |
| C | 0 | 27 | 0 |
| D | 0 | 27 | 0 |
| Mode M0 | |||
|---|---|---|---|
| Quadrant | BADHDUFLAG | Total packets | Discarded packets |
| A | 0 | 12116 | 3 |
| B | 0 | 14832 | 2 |
| C | 0 | 16124 | 2 |
| D | 0 | 21527 | 2 |
| Mode SS | |||
|---|---|---|---|
| Quadrant | BADHDUFLAG | Total packets | Discarded packets |
| A | 0 | 122 | 0 |
| B | 0 | 122 | 0 |
| C | 0 | 122 | 0 |
| D | 0 | 122 | 0 |
| Quadrant | Total seconds | Saturated seconds | Saturation percentage |
|---|---|---|---|
| A | 5970 | 8 | 0.134003% |
| B | 5970 | 158 | 2.646566% |
| C | 5970 | 278 | 4.656616% |
| D | 5970 | 538 | 9.011725% |
Noise dominated data is calculated using 1-second bins in cleaned event files. If a bin has >2000 counts, and if more than 50% of those come from <1% of pixels, then it is considered to be noise-dominated and hence unusable.
| Quadrant | # 1 sec bins | Bins with >0 counts | Bins with >2000 counts | High rate bins dominated by noise | Noise dominated (total time) | Noise dominated (detector-on time) | Marked lightcurve |
|---|---|---|---|---|---|---|---|
| A | 8626 | 5972 | 0 | 0 | 0.00% | 0.00% | 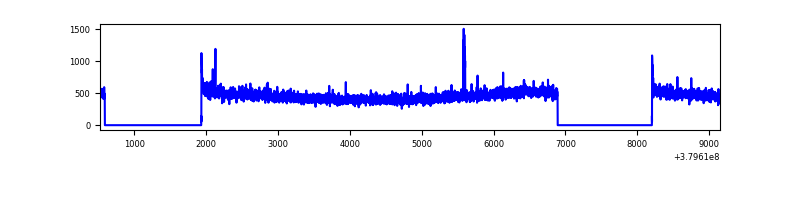 |
| B | 8626 | 5972 | 120 | 120 | 1.39% | 2.01% | 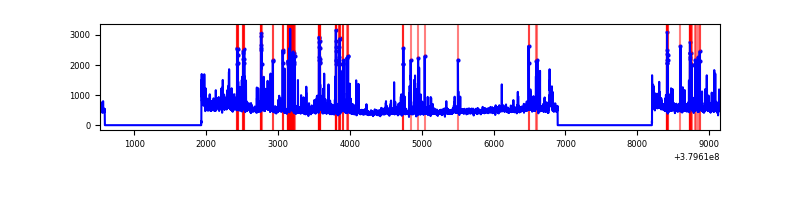 |
| C | 8626 | 5972 | 231 | 231 | 2.68% | 3.87% | 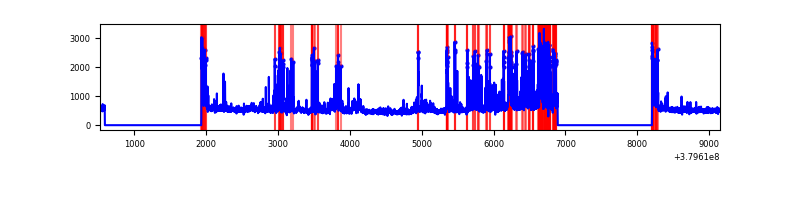 |
| D | 8626 | 5972 | 495 | 495 | 5.74% | 8.29% | 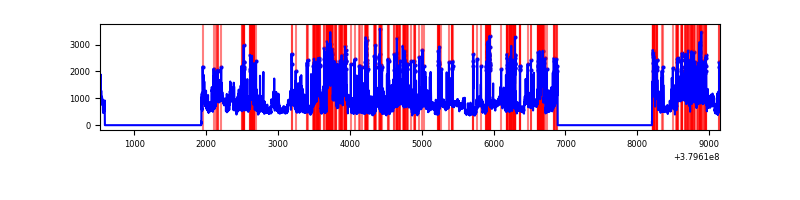 |
Top three noisy pixels from each quadrant. If the there are fewer than three noisy pixels in the level2.evt file, extra rows are filled as -1
| Pixel properties | Quadrant properties | ||||||
|---|---|---|---|---|---|---|---|
| Quadrant | DetID | PixID | Counts | Sigma | Mean | Median | Sigma |
| A | 10 | 83 | 18826 | 129.41 | 696 | 681 | 140.2 |
| A | 14 | 235 | 17167 | 117.58 | 696 | 681 | 140.2 |
| A | 13 | 6 | 14778 | 100.54 | 696 | 681 | 140.2 |
| B | 5 | 172 | 489092 | 3713.66 | 684 | 666 | 131.5 |
| B | 0 | 189 | 164532 | 1245.93 | 684 | 666 | 131.5 |
| B | 0 | 219 | 55580 | 417.53 | 684 | 666 | 131.5 |
| C | 4 | 254 | 793449 | 5185.77 | 661 | 665 | 152.9 |
| C | 3 | 233 | 325636 | 2125.7 | 661 | 665 | 152.9 |
| C | 15 | 214 | 254497 | 1660.37 | 661 | 665 | 152.9 |
| D | 8 | 195 | 1283434 | 7782.35 | 649 | 634 | 164.8 |
| D | 12 | 233 | 418736 | 2536.49 | 649 | 634 | 164.8 |
| D | 12 | 6 | 409933 | 2483.09 | 649 | 634 | 164.8 |
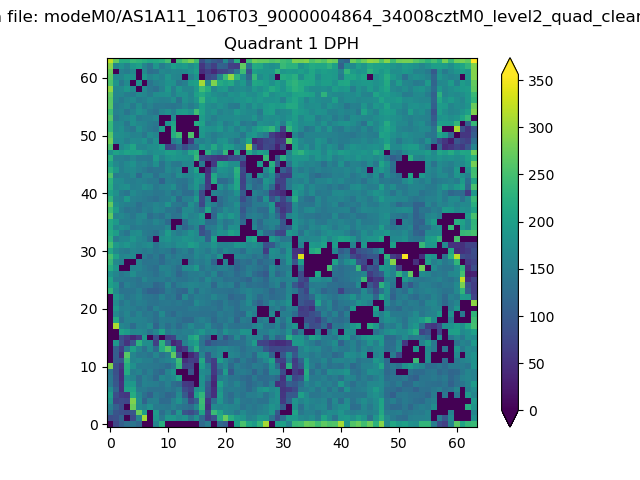
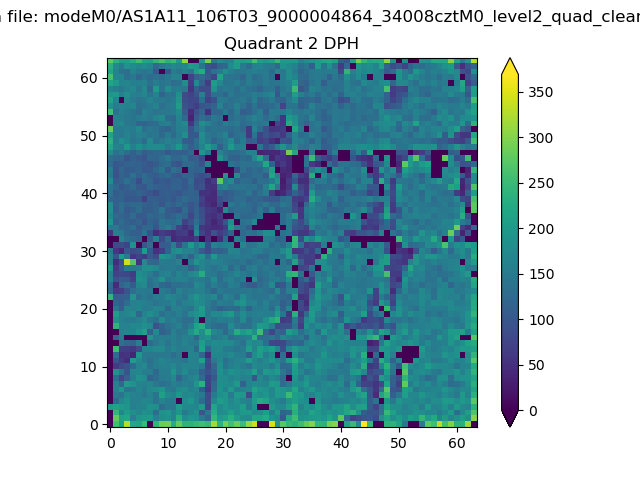
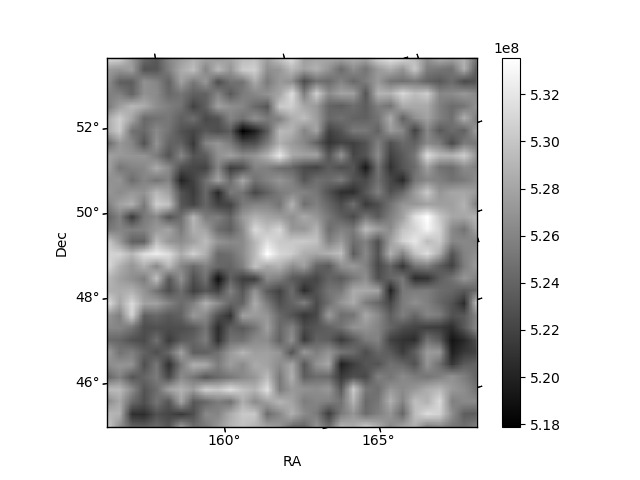
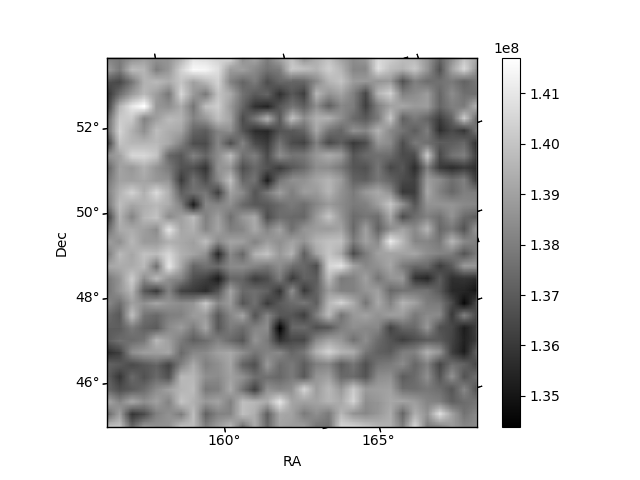
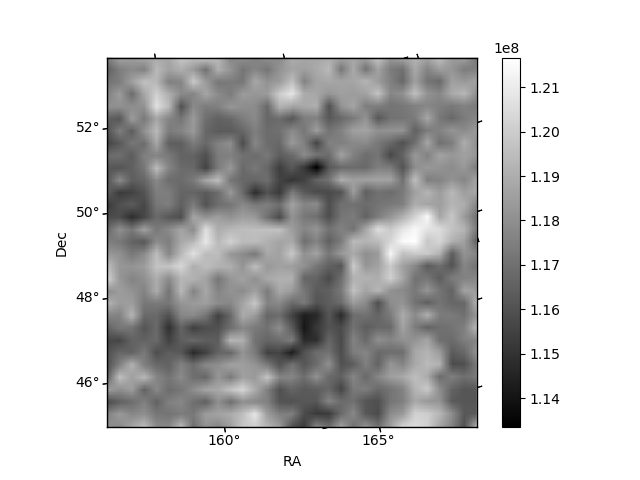
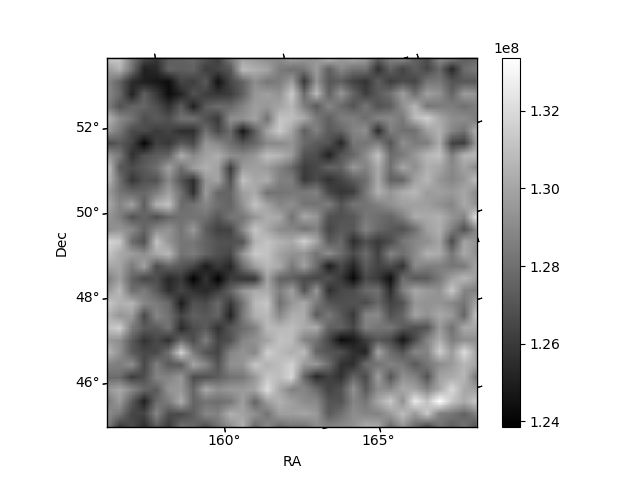
Histogram calculated using DETX and DETY for each event in the final _common_clean file
| Quadrant A |  |
 |
Quadrant B |
|---|---|---|---|
| Quadrant D | 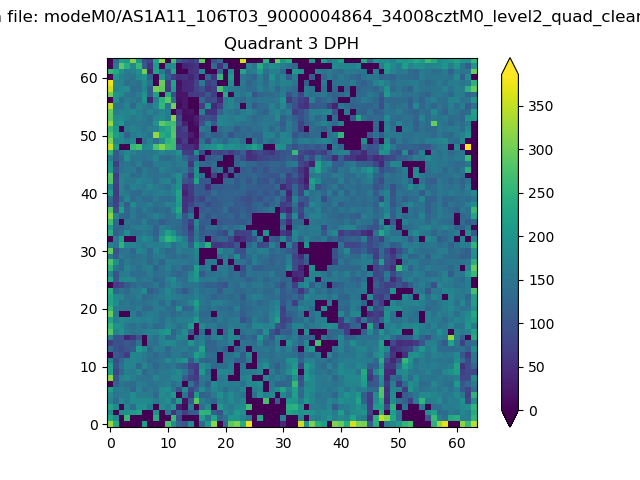 |
 |
Quadrant C |
| Plot type | Count rate plots | Images |
|---|---|---|
| Comparison with Poisson distribution Blue bars denote a histogram of data divided into 1 sec bins. Red curve is a Poisson curve with rate = median count rate of data. |
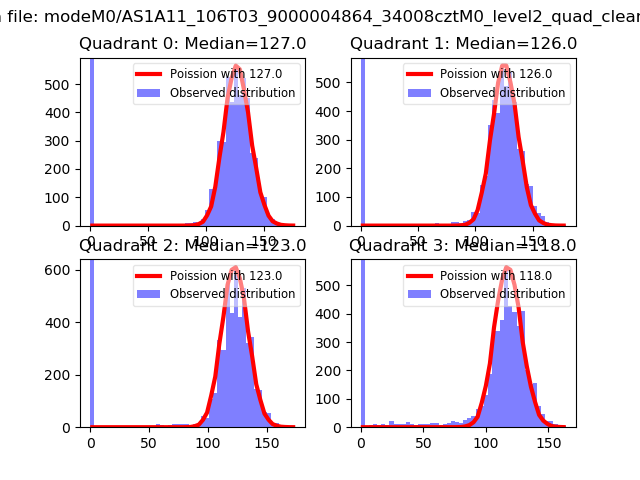 |
 |
| Quadrant-wise count rates Data is divided into 100 sec bins |
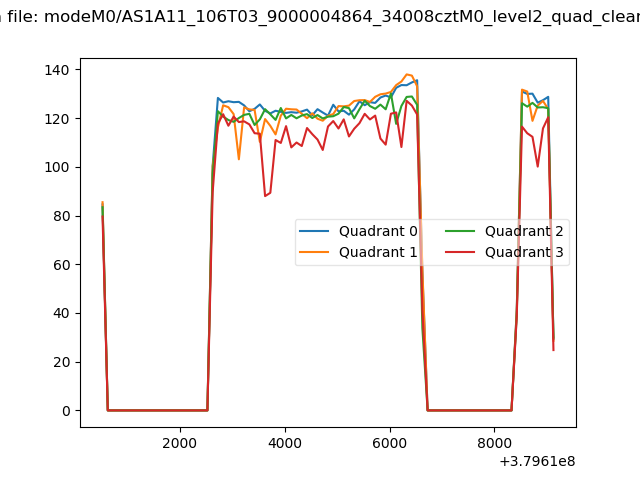 |
|
| Module-wise count rates for Quadrant A Data is divided into 100 sec bins |
 |
 |
| Module-wise count rates for Quadrant B Data is divided into 100 sec bins |
 |
 |
| Module-wise count rates for Quadrant C Data is divided into 100 sec bins |
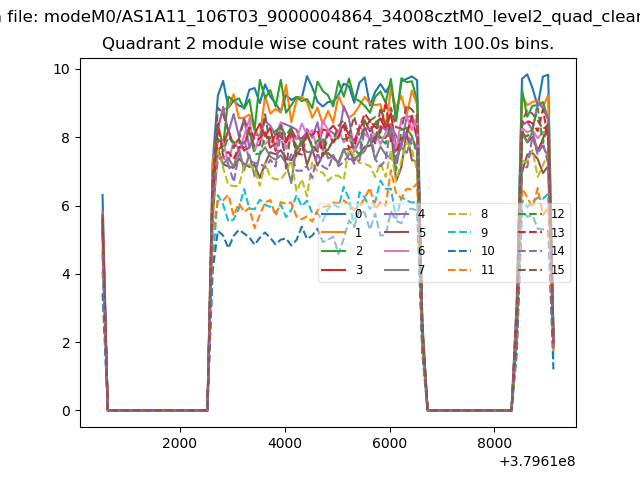 |
 |
| Module-wise count rates for Quadrant D Data is divided into 100 sec bins |
 |
 |
| Parameter | Plot |
|---|---|
| CZT HV Monitor | 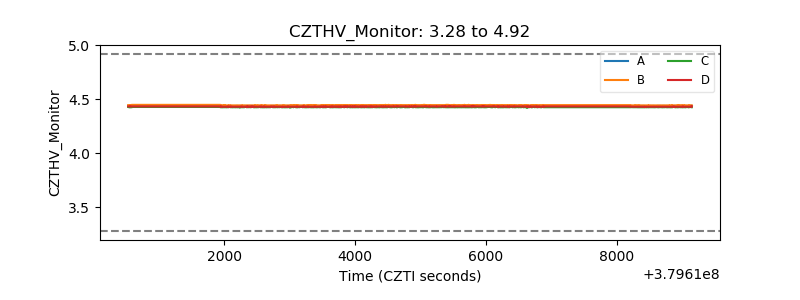 |
| D_VDD | 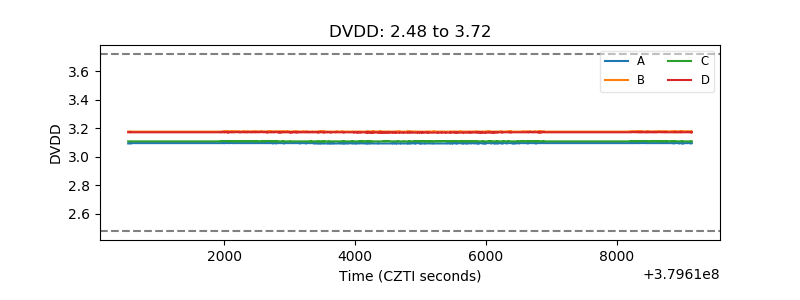 |
| Temperature 1 | 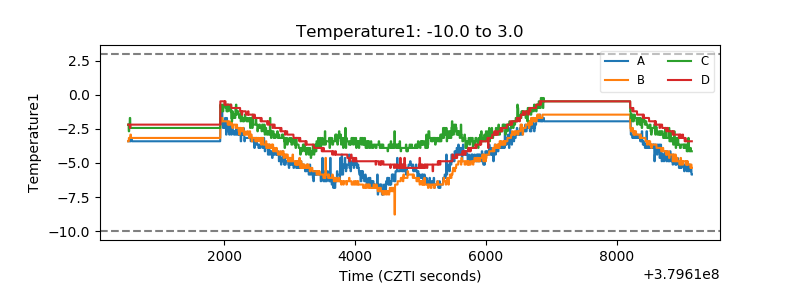 |
| Veto HV Monitor | 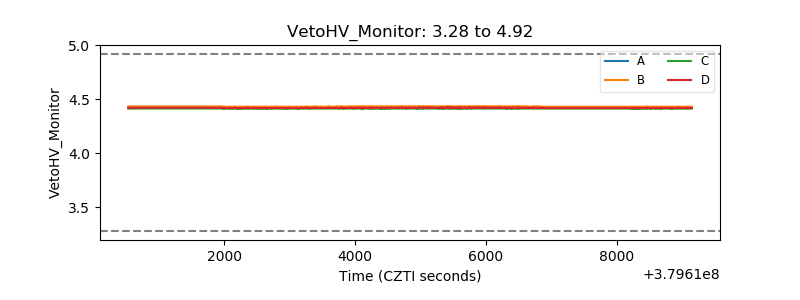 |
| Veto LLD |  |
| Alpha Counter | 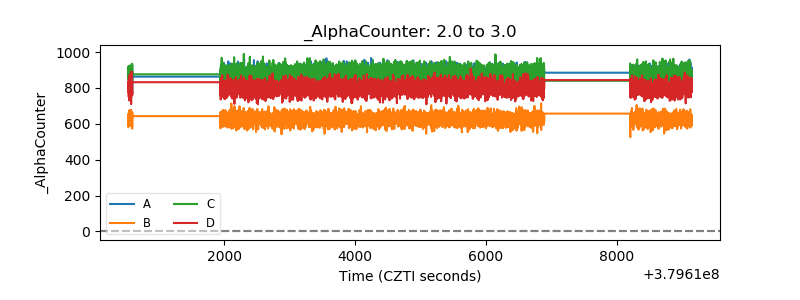 |
| _CPM_Rate | 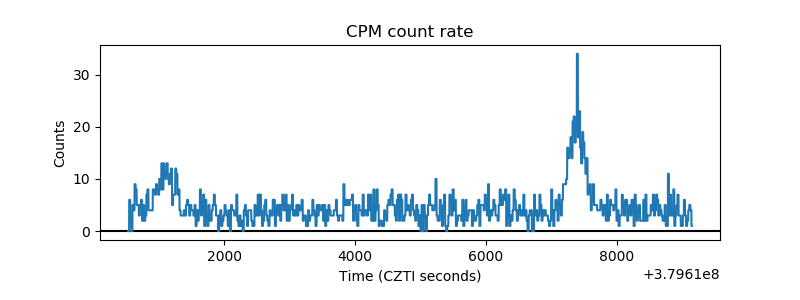 |
| CZT Counter | 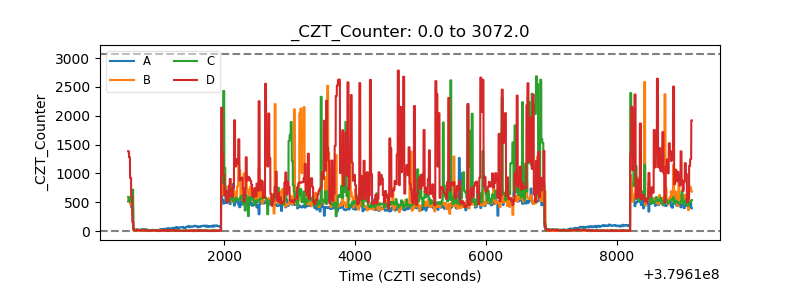 |
| +2.5 Volts monitor |  |
| +5 Volts monitor | 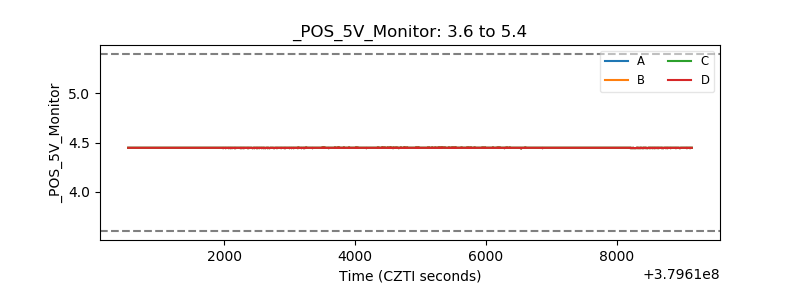 |
| _ROLL_ROT | 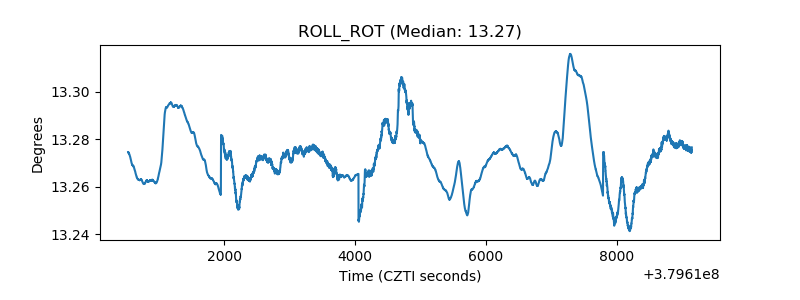 |
| _Roll_DEC | 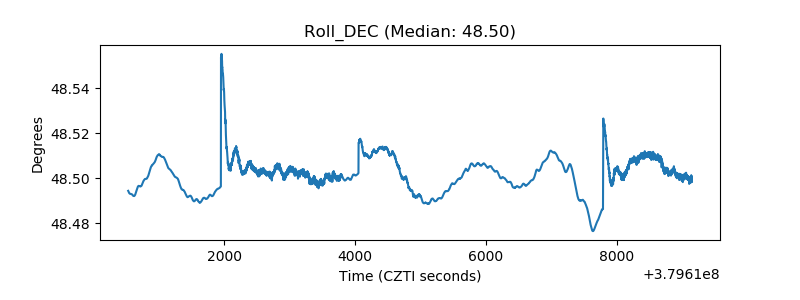 |
| _Roll_RA | 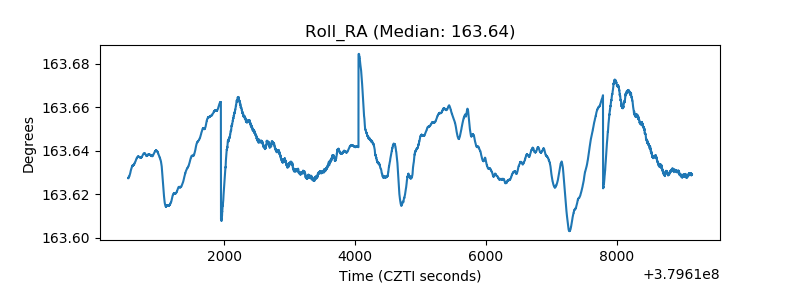 |
| Veto Counter | 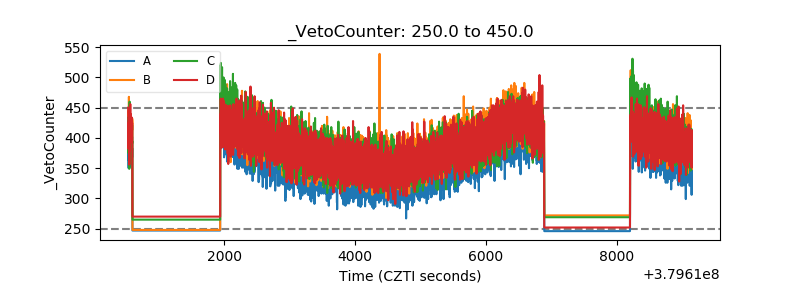 |