| Param | Original file | Final file |
|---|---|---|
| Filename | modeM0/AS1A11_106T03_9000004864_34010cztM0_level2.evt | modeM0/AS1A11_106T03_9000004864_34010cztM0_level2_quad_clean.evt |
| Size (bytes) | 1,003,340,160 | 165,778,560 |
| Size | 956.9 MB | 158.1 MB |
| Events in quadrant A | 4,911,266 | 1,101,397 |
| Events in quadrant B | 7,027,483 | 1,085,700 |
| Events in quadrant C | 7,223,942 | 1,069,655 |
| Events in quadrant D | 10,497,182 | 1,017,880 |
| Mode M9 | |||
|---|---|---|---|
| Quadrant | BADHDUFLAG | Total packets | Discarded packets |
| A | 0 | 28 | 0 |
| B | 0 | 28 | 0 |
| C | 0 | 28 | 0 |
| D | 0 | 29 | 0 |
| Mode M0 | |||
|---|---|---|---|
| Quadrant | BADHDUFLAG | Total packets | Discarded packets |
| A | 0 | 21956 | 4 |
| B | 0 | 28259 | 3 |
| C | 0 | 28281 | 3 |
| D | 0 | 38692 | 3 |
| Mode SS | |||
|---|---|---|---|
| Quadrant | BADHDUFLAG | Total packets | Discarded packets |
| A | 0 | 220 | 0 |
| B | 0 | 220 | 0 |
| C | 0 | 220 | 0 |
| D | 0 | 220 | 0 |
| Quadrant | Total seconds | Saturated seconds | Saturation percentage |
|---|---|---|---|
| A | 10772 | 12 | 0.111400% |
| B | 10772 | 451 | 4.186781% |
| C | 10772 | 426 | 3.954697% |
| D | 10772 | 743 | 6.897512% |
Noise dominated data is calculated using 1-second bins in cleaned event files. If a bin has >2000 counts, and if more than 50% of those come from <1% of pixels, then it is considered to be noise-dominated and hence unusable.
| Quadrant | # 1 sec bins | Bins with >0 counts | Bins with >2000 counts | High rate bins dominated by noise | Noise dominated (total time) | Noise dominated (detector-on time) | Marked lightcurve |
|---|---|---|---|---|---|---|---|
| A | 13547 | 10774 | 0 | 0 | 0.00% | 0.00% | 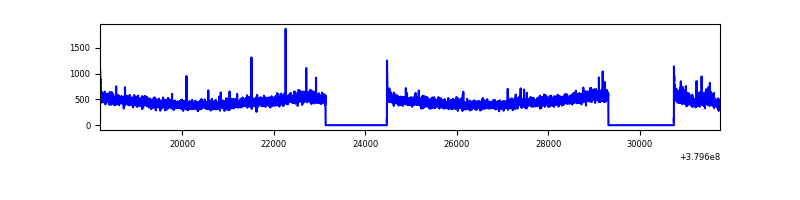 |
| B | 13547 | 10774 | 305 | 305 | 2.25% | 2.83% | 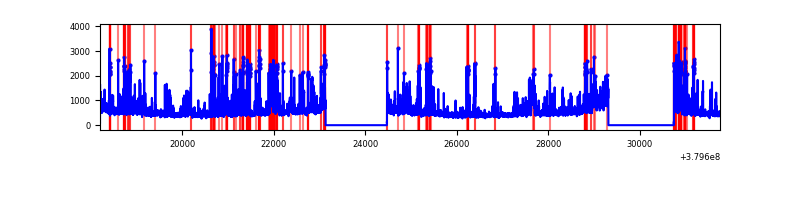 |
| C | 13547 | 10774 | 348 | 348 | 2.57% | 3.23% | 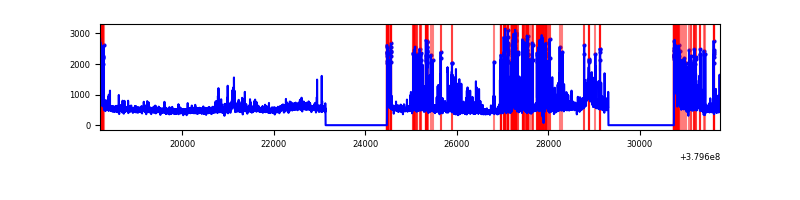 |
| D | 13547 | 10774 | 696 | 696 | 5.14% | 6.46% | 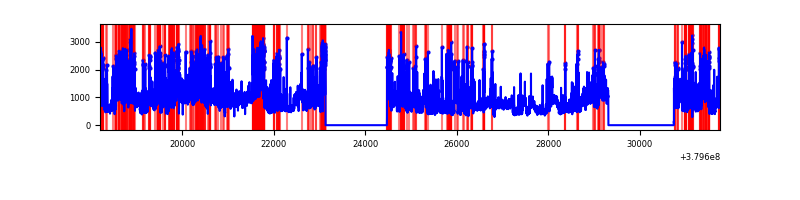 |
Top three noisy pixels from each quadrant. If the there are fewer than three noisy pixels in the level2.evt file, extra rows are filled as -1
| Pixel properties | Quadrant properties | ||||||
|---|---|---|---|---|---|---|---|
| Quadrant | DetID | PixID | Counts | Sigma | Mean | Median | Sigma |
| A | 12 | 16 | 41572 | 163.55 | 1239 | 1215 | 246.8 |
| A | 13 | 6 | 28633 | 111.11 | 1239 | 1215 | 246.8 |
| A | 10 | 83 | 28419 | 110.25 | 1239 | 1215 | 246.8 |
| B | 5 | 172 | 1507788 | 6518.5 | 1212 | 1179 | 231.1 |
| B | 0 | 189 | 278025 | 1197.8 | 1212 | 1179 | 231.1 |
| B | 0 | 219 | 144427 | 619.78 | 1212 | 1179 | 231.1 |
| C | 4 | 254 | 1135119 | 4156.11 | 1180 | 1186 | 272.8 |
| C | 15 | 214 | 466269 | 1704.63 | 1180 | 1186 | 272.8 |
| C | 0 | 10 | 462565 | 1691.05 | 1180 | 1186 | 272.8 |
| D | 8 | 195 | 2908866 | 9521.22 | 1164 | 1138 | 305.4 |
| D | 12 | 6 | 774313 | 2531.73 | 1164 | 1138 | 305.4 |
| D | 2 | 250 | 649148 | 2121.88 | 1164 | 1138 | 305.4 |
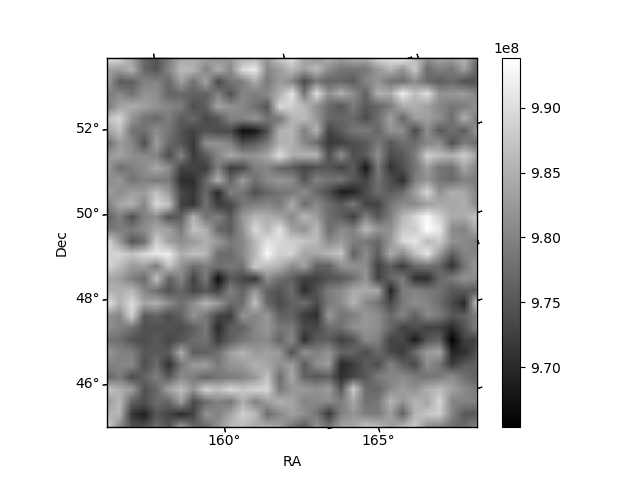
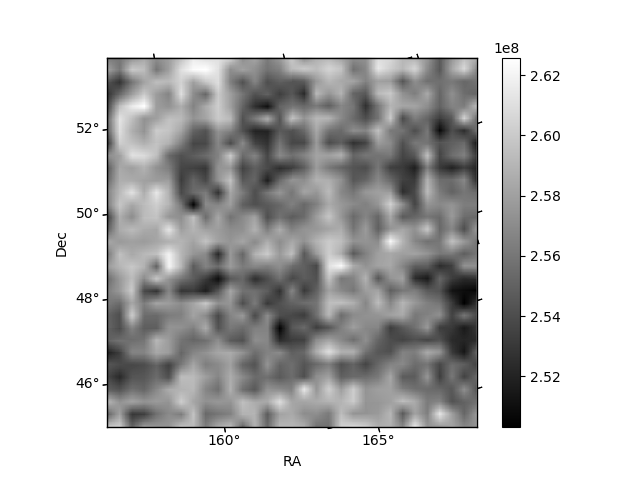
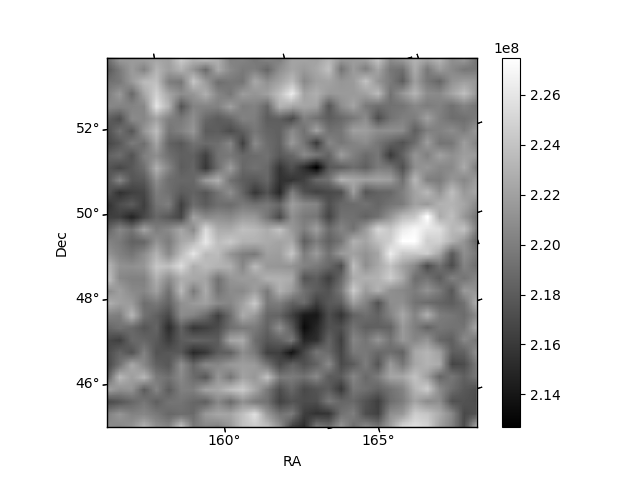
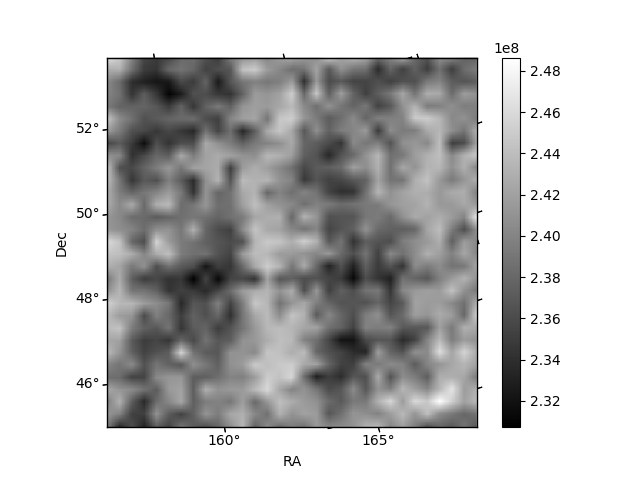
Histogram calculated using DETX and DETY for each event in the final _common_clean file
| Quadrant A | 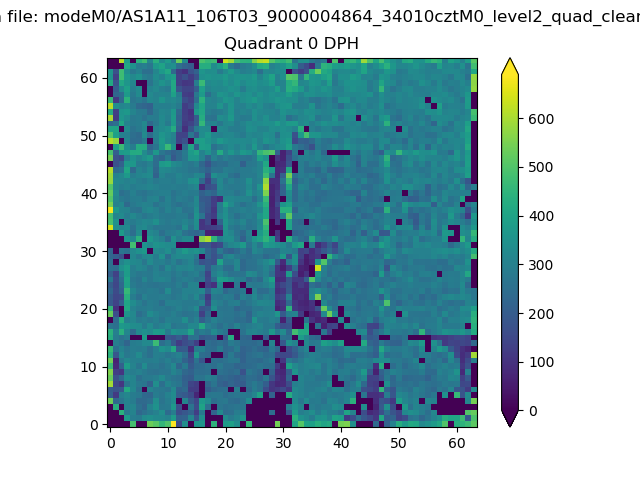 |
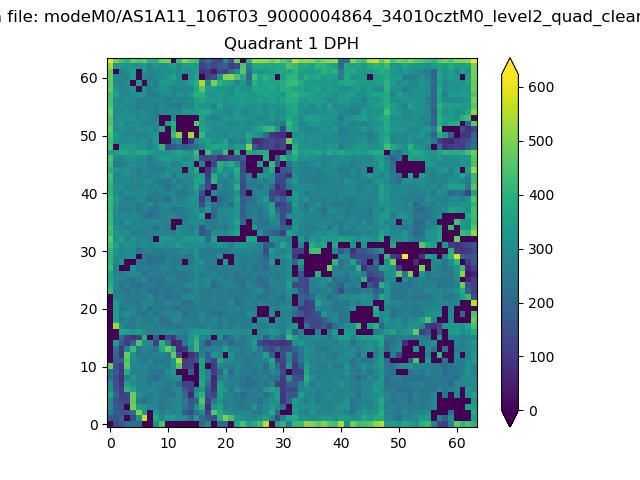 |
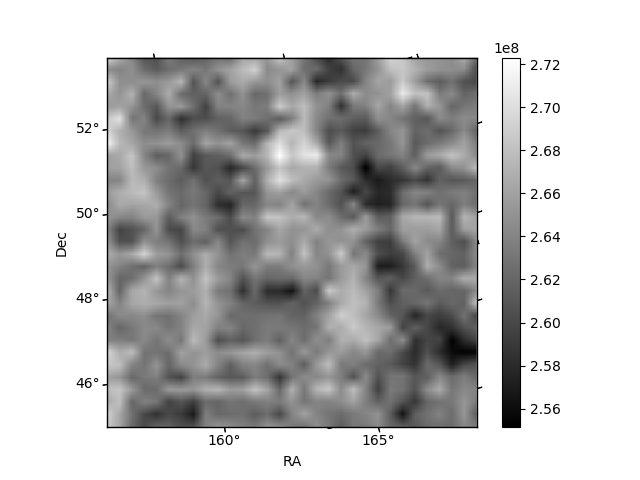
Quadrant B |
|---|---|---|---|
| Quadrant D | 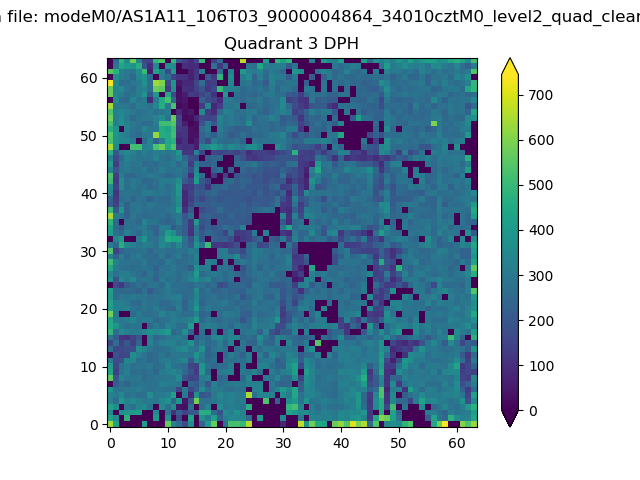 |
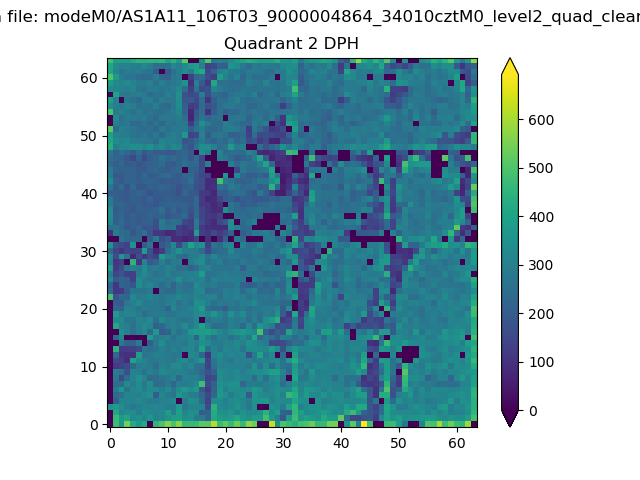 |
Quadrant C |
| Plot type | Count rate plots | Images |
|---|---|---|
| Comparison with Poisson distribution Blue bars denote a histogram of data divided into 1 sec bins. Red curve is a Poisson curve with rate = median count rate of data. |
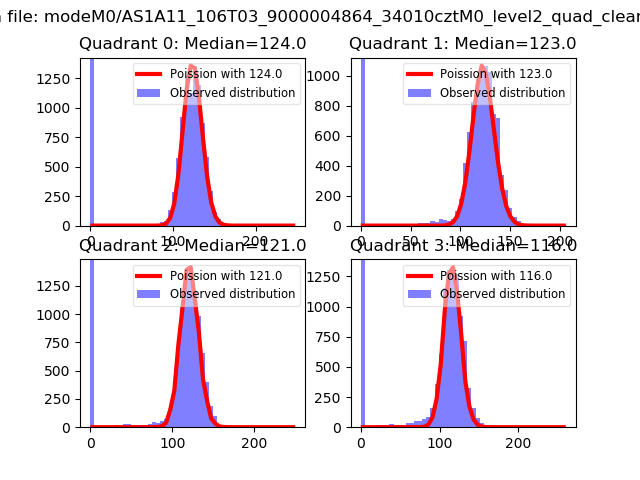 |
 |
| Quadrant-wise count rates Data is divided into 100 sec bins |
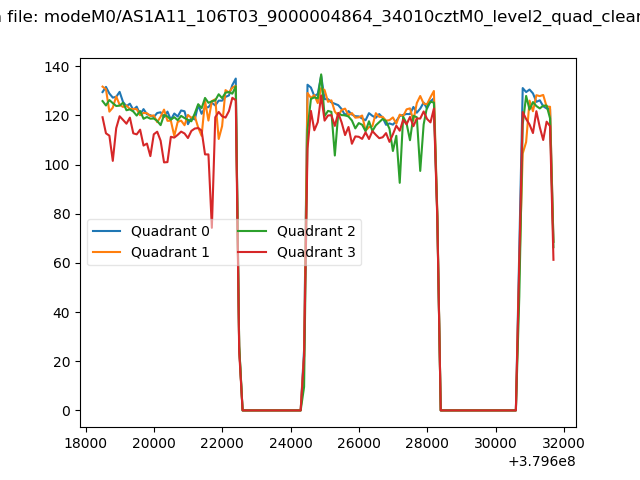 |
|
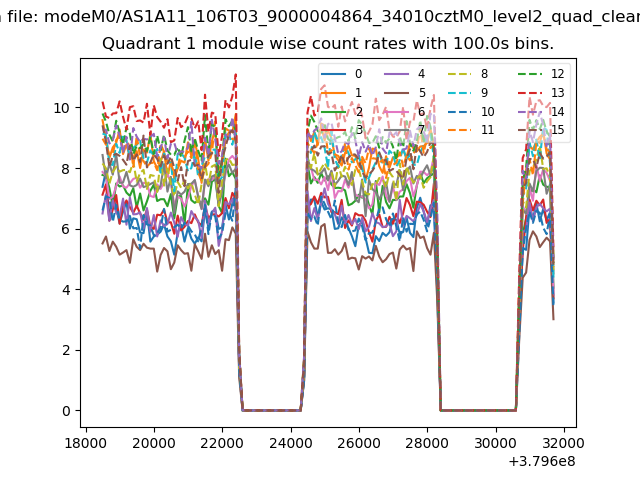
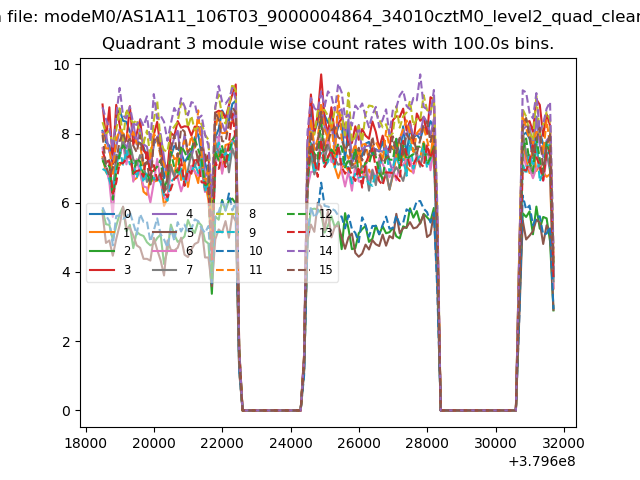
| Module-wise count rates for Quadrant A Data is divided into 100 sec bins |
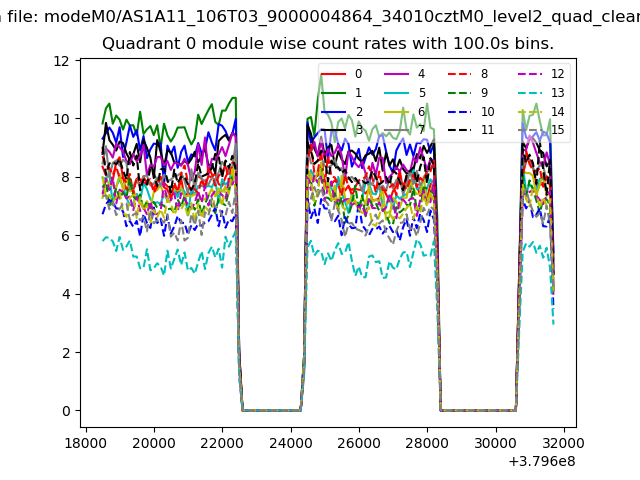 |
 |
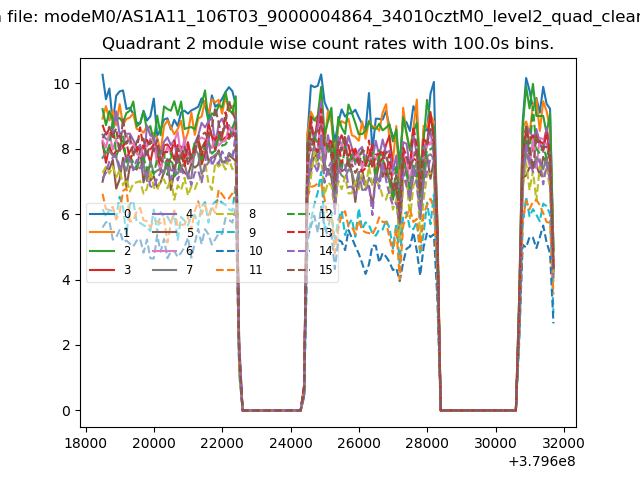
| Module-wise count rates for Quadrant B Data is divided into 100 sec bins |
 |
 |
| Module-wise count rates for Quadrant C Data is divided into 100 sec bins |
 |
 |
| Module-wise count rates for Quadrant D Data is divided into 100 sec bins |
 |
 |
| Parameter | Plot |
|---|---|
| CZT HV Monitor | 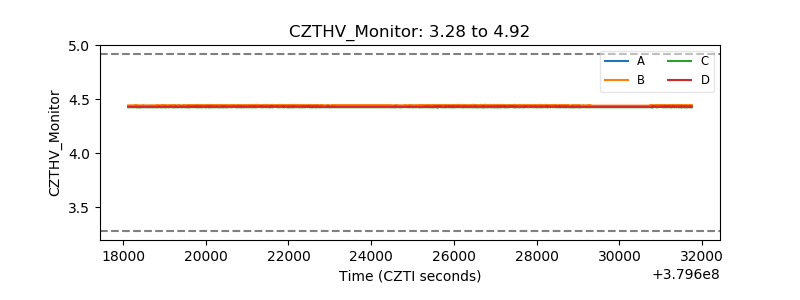 |
| D_VDD | 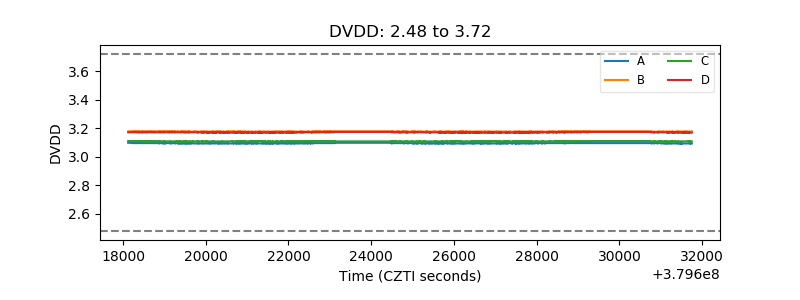 |
| Temperature 1 | 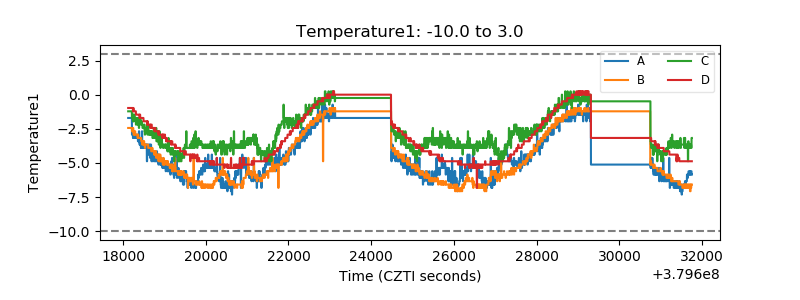 |
| Veto HV Monitor | 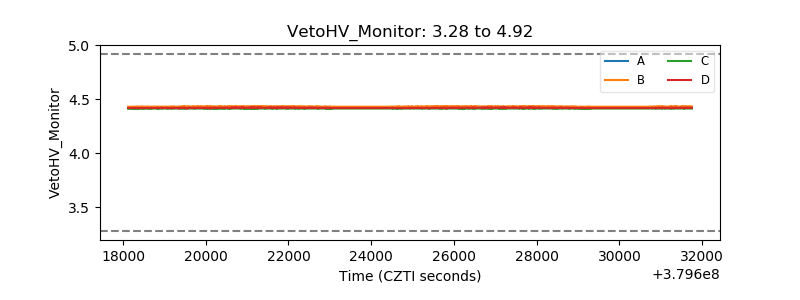 |
| Veto LLD | 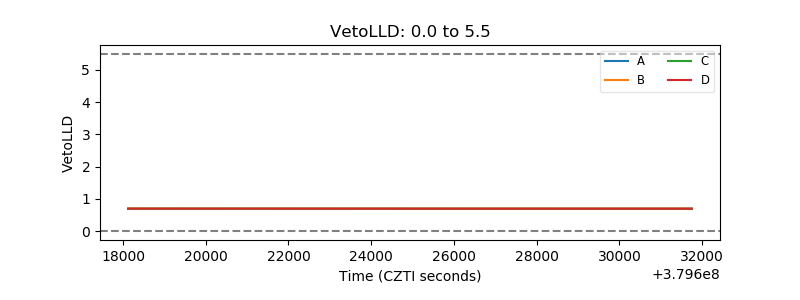 |
| Alpha Counter | 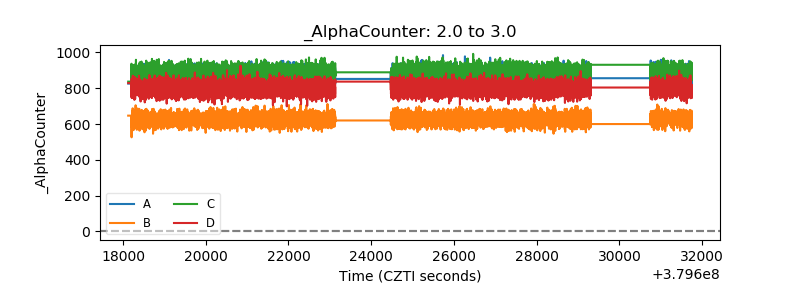 |
| _CPM_Rate | 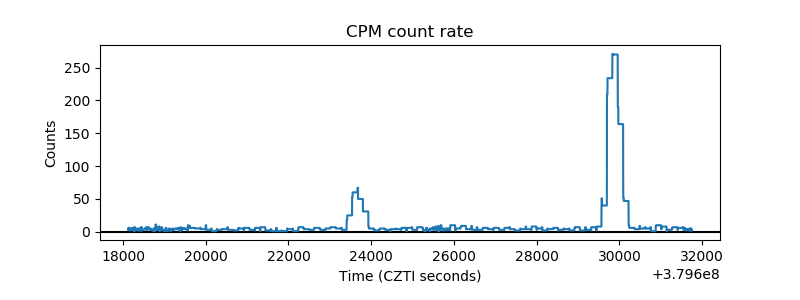 |
| CZT Counter | 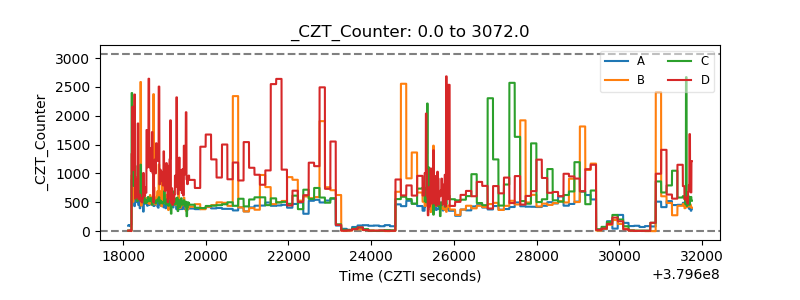 |
| +2.5 Volts monitor | 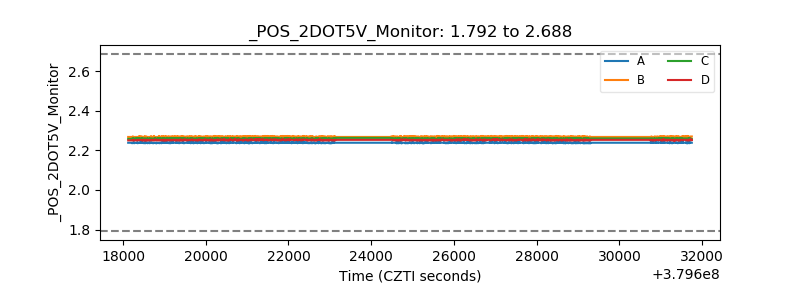 |
| +5 Volts monitor |  |
| _ROLL_ROT | 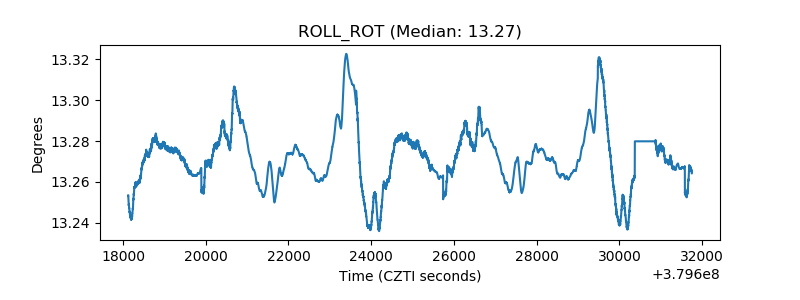 |
| _Roll_DEC | 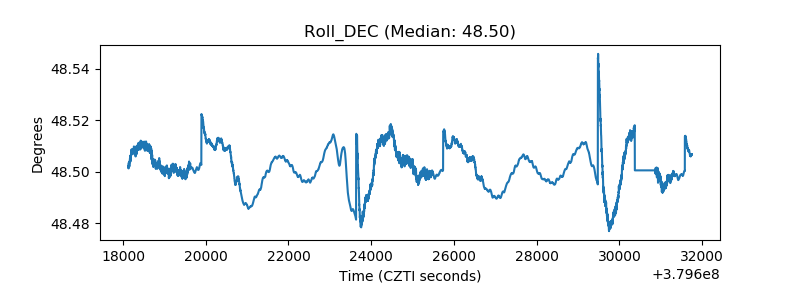 |
| _Roll_RA | 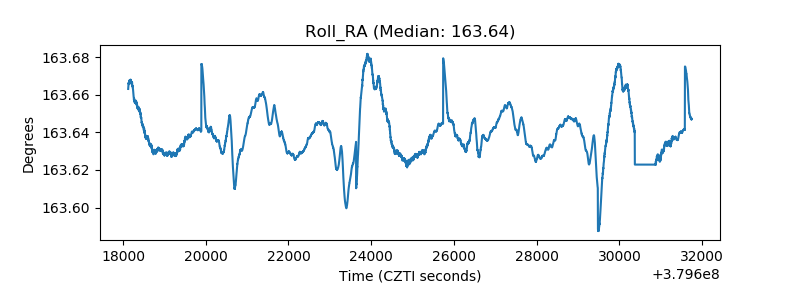 |
| Veto Counter | 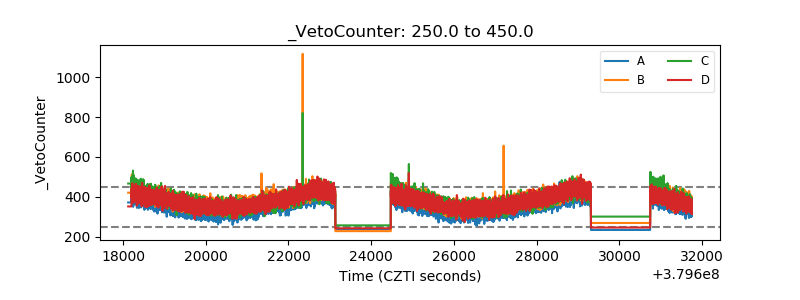 |