| Param | Original file | Final file |
|---|---|---|
| Filename | modeM0/AS1A11_106T03_9000004864_34011cztM0_level2.evt | modeM0/AS1A11_106T03_9000004864_34011cztM0_level2_quad_clean.evt |
| Size (bytes) | 524,779,200 | 81,826,560 |
| Size | 500.5 MB | 78.0 MB |
| Events in quadrant A | 2,616,154 | 532,777 |
| Events in quadrant B | 3,480,384 | 528,575 |
| Events in quadrant C | 3,814,838 | 522,003 |
| Events in quadrant D | 5,595,319 | 495,556 |
| Mode M9 | |||
|---|---|---|---|
| Quadrant | BADHDUFLAG | Total packets | Discarded packets |
| A | 0 | 30 | 0 |
| B | 0 | 30 | 0 |
| C | 0 | 30 | 0 |
| D | 0 | 30 | 0 |
| Mode M0 | |||
|---|---|---|---|
| Quadrant | BADHDUFLAG | Total packets | Discarded packets |
| A | 0 | 11631 | 3 |
| B | 0 | 14268 | 2 |
| C | 0 | 14946 | 2 |
| D | 0 | 20558 | 2 |
| Mode SS | |||
|---|---|---|---|
| Quadrant | BADHDUFLAG | Total packets | Discarded packets |
| A | 0 | 118 | 0 |
| B | 0 | 118 | 0 |
| C | 0 | 118 | 0 |
| D | 0 | 118 | 0 |
| Quadrant | Total seconds | Saturated seconds | Saturation percentage |
|---|---|---|---|
| A | 5702 | 7 | 0.122764% |
| B | 5702 | 209 | 3.665381% |
| C | 5702 | 210 | 3.682918% |
| D | 5702 | 460 | 8.067345% |
Noise dominated data is calculated using 1-second bins in cleaned event files. If a bin has >2000 counts, and if more than 50% of those come from <1% of pixels, then it is considered to be noise-dominated and hence unusable.
| Quadrant | # 1 sec bins | Bins with >0 counts | Bins with >2000 counts | High rate bins dominated by noise | Noise dominated (total time) | Noise dominated (detector-on time) | Marked lightcurve |
|---|---|---|---|---|---|---|---|
| A | 8687 | 5704 | 0 | 0 | 0.00% | 0.00% | 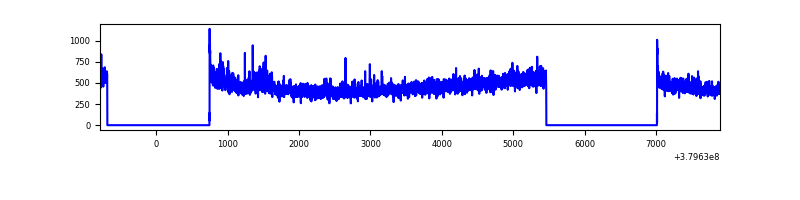 |
| B | 8687 | 5704 | 141 | 141 | 1.62% | 2.47% | 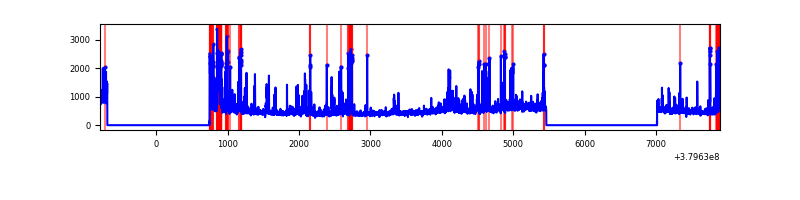 |
| C | 8687 | 5704 | 159 | 159 | 1.83% | 2.79% | 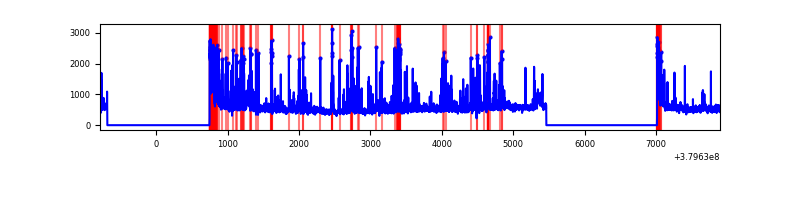 |
| D | 8687 | 5704 | 429 | 429 | 4.94% | 7.52% | 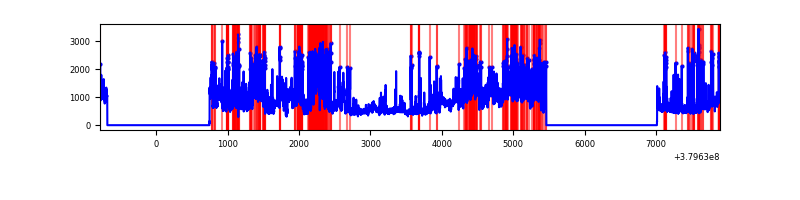 |
Top three noisy pixels from each quadrant. If the there are fewer than three noisy pixels in the level2.evt file, extra rows are filled as -1
| Pixel properties | Quadrant properties | ||||||
|---|---|---|---|---|---|---|---|
| Quadrant | DetID | PixID | Counts | Sigma | Mean | Median | Sigma |
| A | 12 | 16 | 52067 | 391.33 | 652 | 638 | 131.4 |
| A | 10 | 83 | 17177 | 125.85 | 652 | 638 | 131.4 |
| A | 13 | 6 | 15744 | 114.94 | 652 | 638 | 131.4 |
| B | 5 | 172 | 600986 | 4907.18 | 641 | 625 | 122.3 |
| B | 0 | 189 | 89695 | 728.03 | 641 | 625 | 122.3 |
| B | 0 | 190 | 65775 | 532.52 | 641 | 625 | 122.3 |
| C | 4 | 254 | 661769 | 4588.92 | 623 | 629 | 144.1 |
| C | 15 | 214 | 262615 | 1818.43 | 623 | 629 | 144.1 |
| C | 0 | 10 | 217369 | 1504.38 | 623 | 629 | 144.1 |
| D | 8 | 195 | 930359 | 5613.99 | 609 | 595 | 165.6 |
| D | 7 | 223 | 657360 | 3965.6 | 609 | 595 | 165.6 |
| D | 2 | 250 | 556573 | 3357.04 | 609 | 595 | 165.6 |
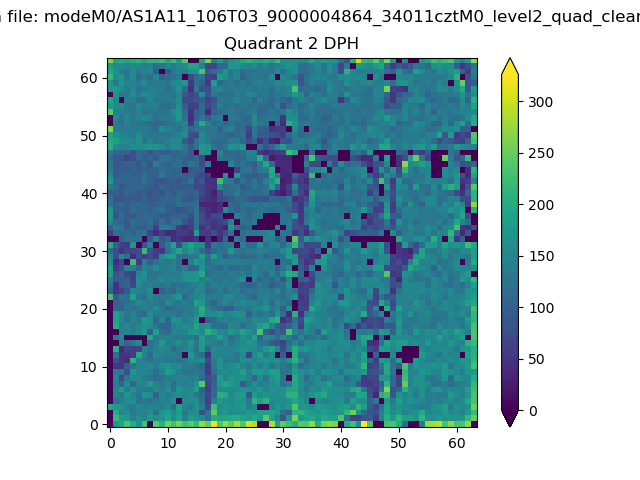
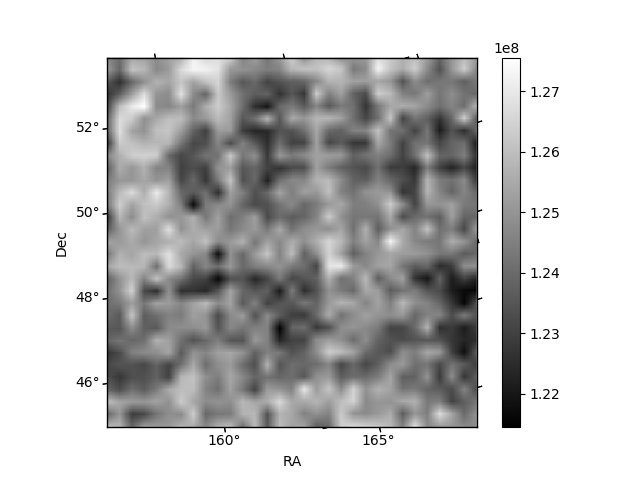
Histogram calculated using DETX and DETY for each event in the final _common_clean file
| Quadrant A |  |
 |
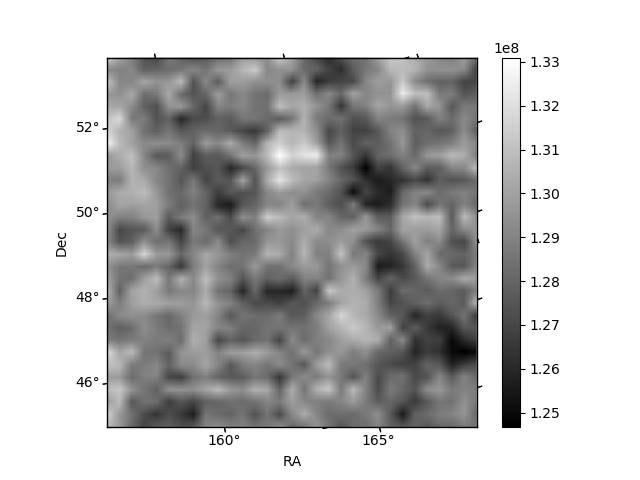
Quadrant B |
|---|---|---|---|
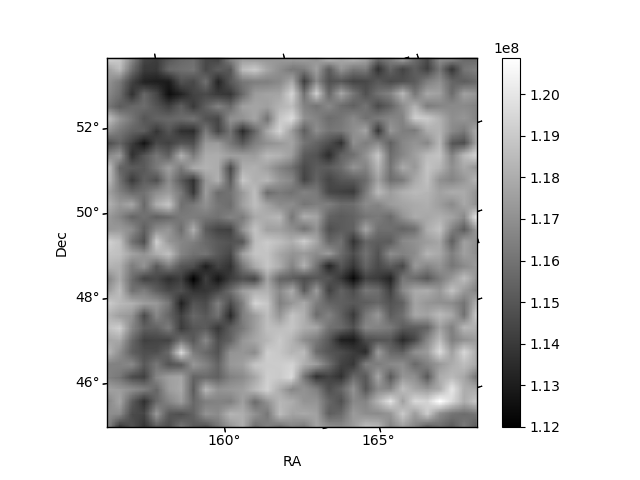
| Quadrant D | 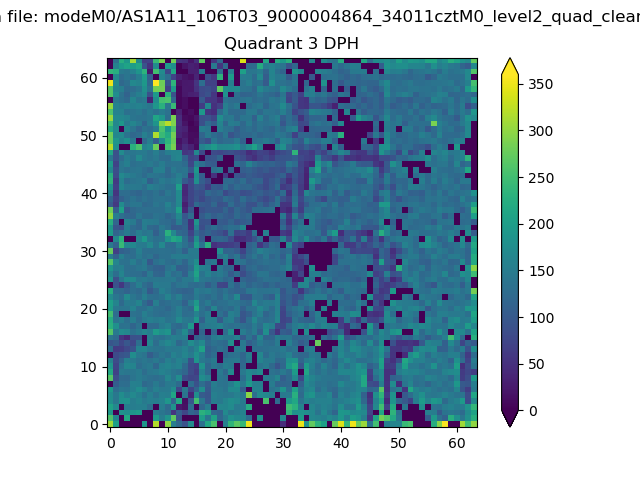 |
 |
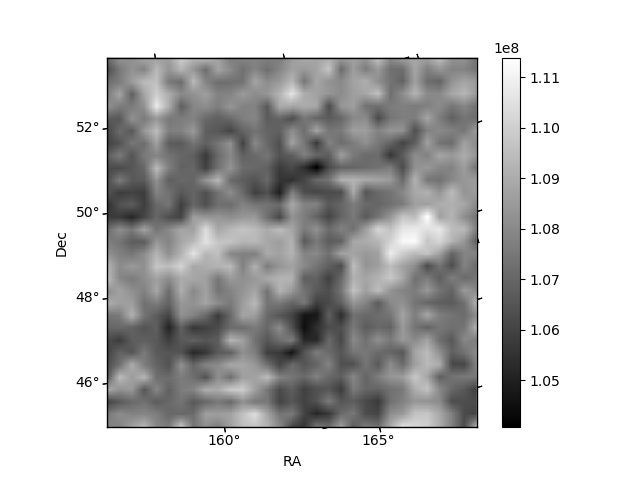
Quadrant C |
| Plot type | Count rate plots | Images |
|---|---|---|
| Comparison with Poisson distribution Blue bars denote a histogram of data divided into 1 sec bins. Red curve is a Poisson curve with rate = median count rate of data. |
 |
 |
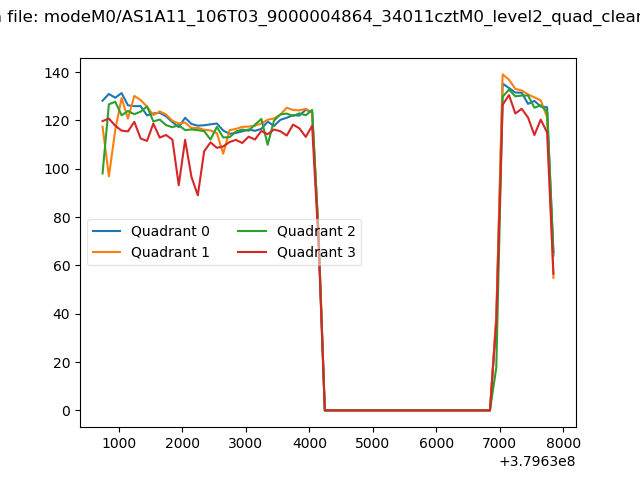
| Quadrant-wise count rates Data is divided into 100 sec bins |
 |
|
| Module-wise count rates for Quadrant A Data is divided into 100 sec bins |
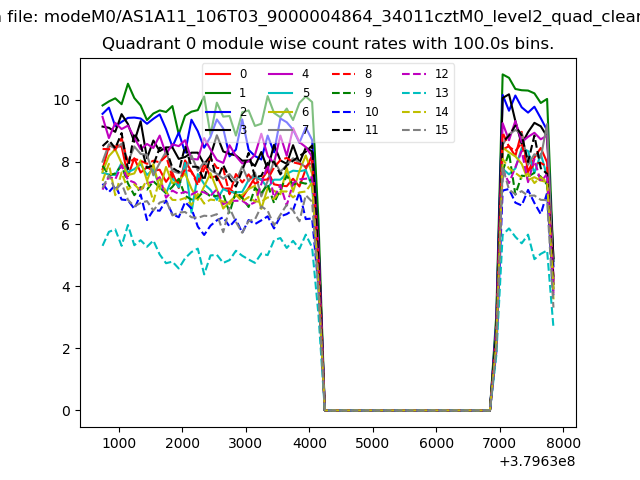 |
 |
| Module-wise count rates for Quadrant B Data is divided into 100 sec bins |
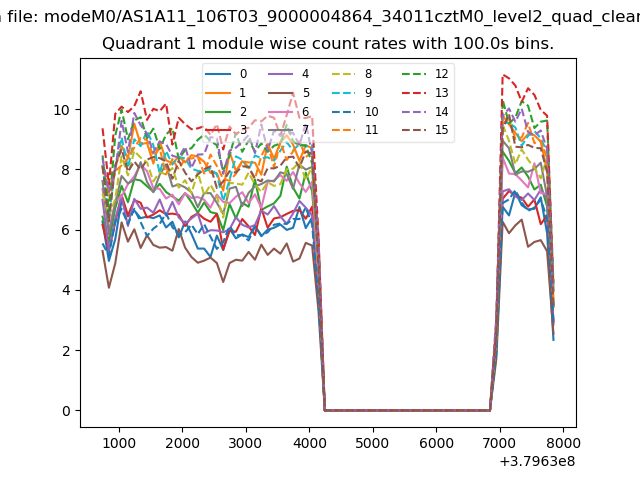 |
 |
| Module-wise count rates for Quadrant C Data is divided into 100 sec bins |
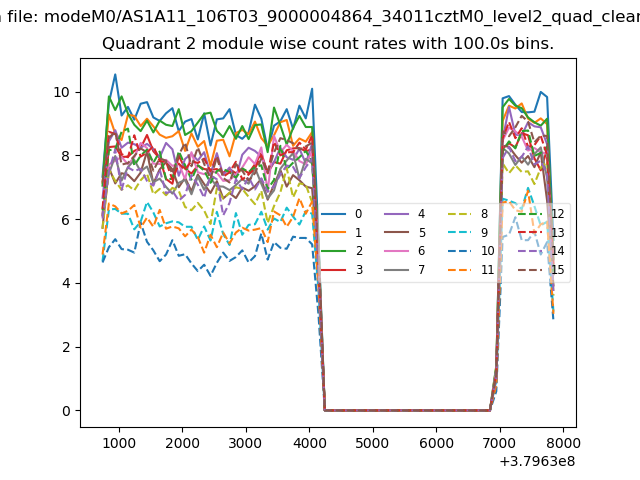 |
 |
| Module-wise count rates for Quadrant D Data is divided into 100 sec bins |
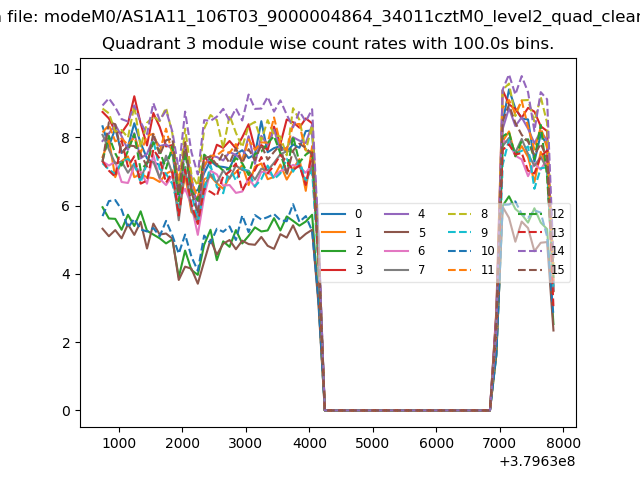 |
 |
| Parameter | Plot |
|---|---|
| CZT HV Monitor | 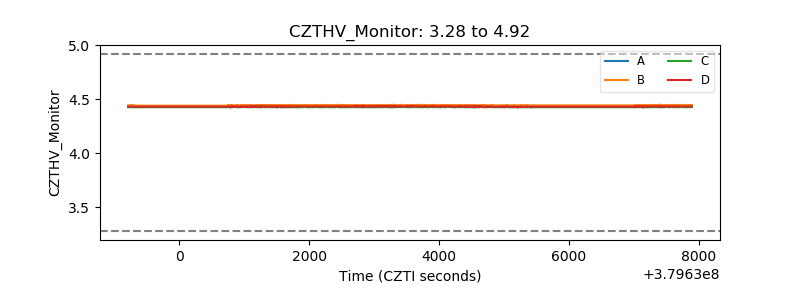 |
| D_VDD | 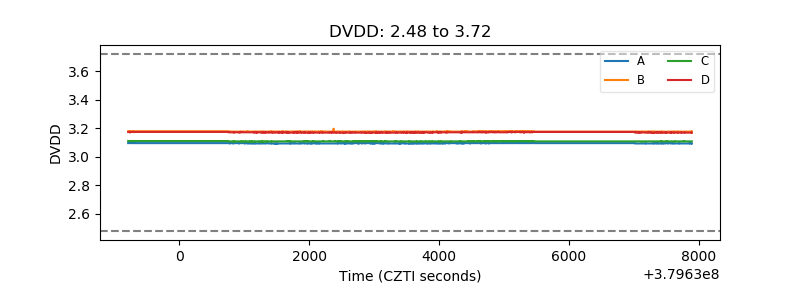 |
| Temperature 1 | 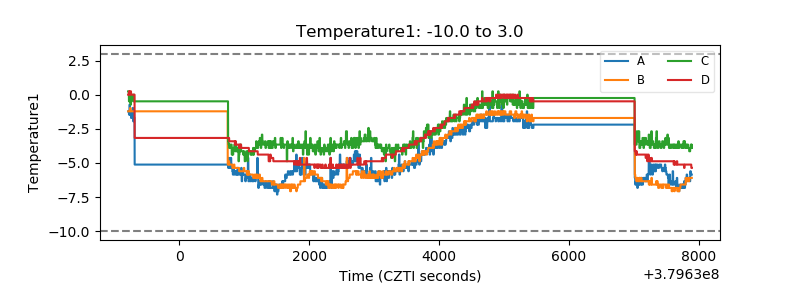 |
| Veto HV Monitor | 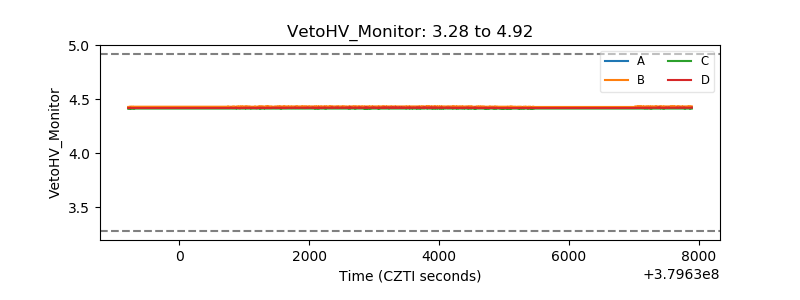 |
| Veto LLD | 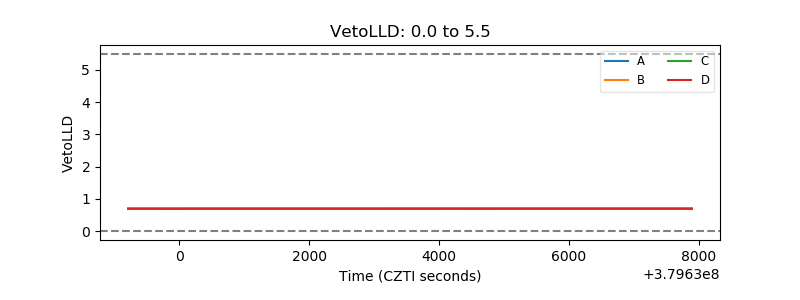 |
| Alpha Counter | 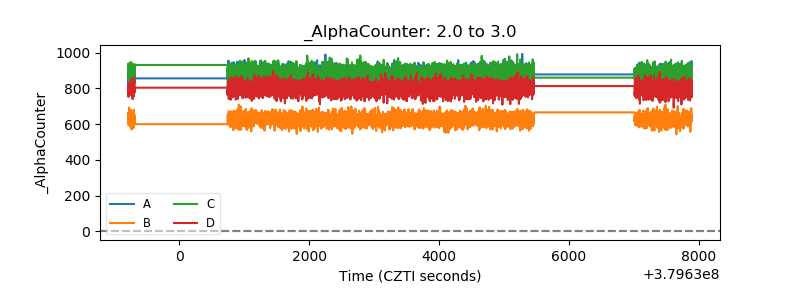 |
| _CPM_Rate | 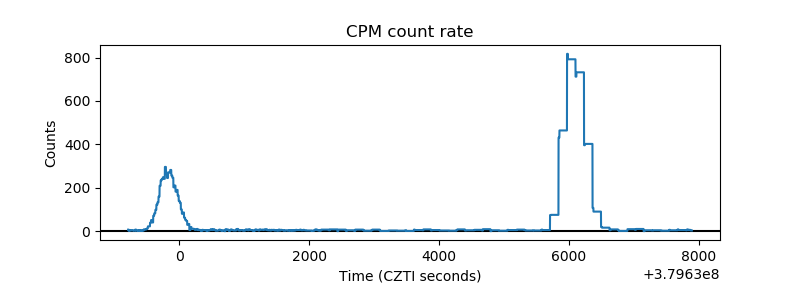 |
| CZT Counter | 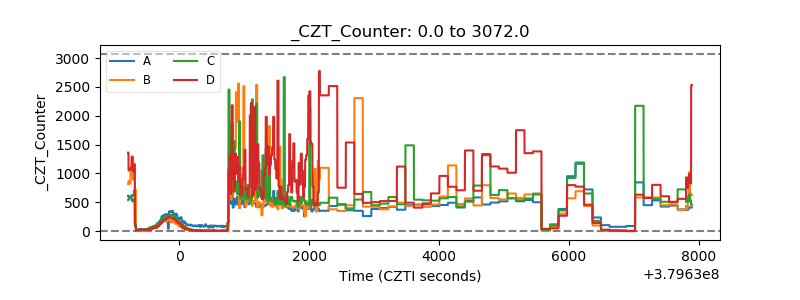 |
| +2.5 Volts monitor |  |
| +5 Volts monitor |  |
| _ROLL_ROT | 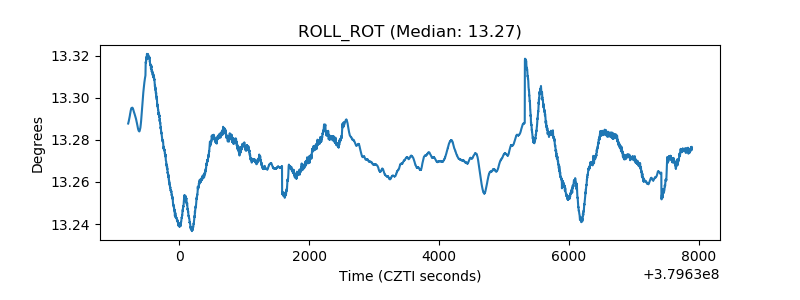 |
| _Roll_DEC | 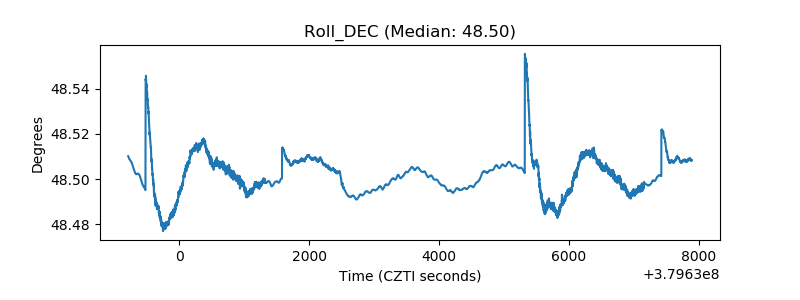 |
| _Roll_RA | 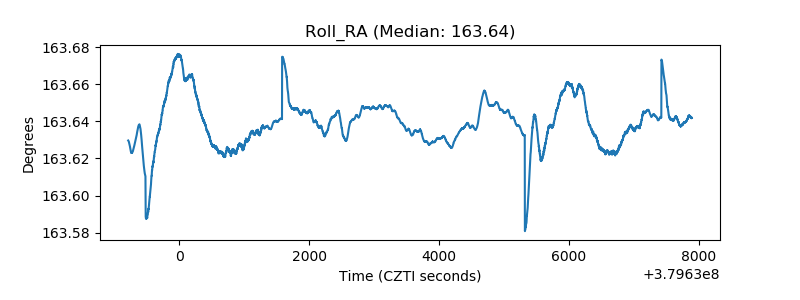 |
| Veto Counter | 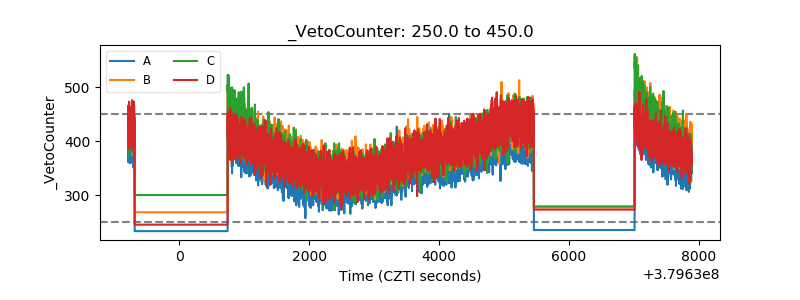 |