| Param | Original file | Final file |
|---|---|---|
| Filename | modeM0/AS1A11_106T03_9000004864_34014cztM0_level2.evt | modeM0/AS1A11_106T03_9000004864_34014cztM0_level2_quad_clean.evt |
| Size (bytes) | 471,476,160 | 75,983,040 |
| Size | 449.6 MB | 72.5 MB |
| Events in quadrant A | 2,644,423 | 487,986 |
| Events in quadrant B | 3,388,062 | 493,076 |
| Events in quadrant C | 2,998,326 | 483,147 |
| Events in quadrant D | 4,875,230 | 452,156 |
| Mode M9 | |||
|---|---|---|---|
| Quadrant | BADHDUFLAG | Total packets | Discarded packets |
| A | 0 | 30 | 0 |
| B | 0 | 30 | 0 |
| C | 0 | 30 | 0 |
| D | 0 | 31 | 0 |
| Mode M0 | |||
|---|---|---|---|
| Quadrant | BADHDUFLAG | Total packets | Discarded packets |
| A | 0 | 11445 | 3 |
| B | 0 | 13614 | 2 |
| C | 0 | 12175 | 2 |
| D | 0 | 18514 | 2 |
| Mode SS | |||
|---|---|---|---|
| Quadrant | BADHDUFLAG | Total packets | Discarded packets |
| A | 0 | 112 | 0 |
| B | 0 | 112 | 0 |
| C | 0 | 112 | 0 |
| D | 0 | 112 | 0 |
| Quadrant | Total seconds | Saturated seconds | Saturation percentage |
|---|---|---|---|
| A | 5494 | 8 | 0.145613% |
| B | 5494 | 127 | 2.311613% |
| C | 5494 | 71 | 1.292319% |
| D | 5494 | 220 | 4.004368% |
Noise dominated data is calculated using 1-second bins in cleaned event files. If a bin has >2000 counts, and if more than 50% of those come from <1% of pixels, then it is considered to be noise-dominated and hence unusable.
| Quadrant | # 1 sec bins | Bins with >0 counts | Bins with >2000 counts | High rate bins dominated by noise | Noise dominated (total time) | Noise dominated (detector-on time) | Marked lightcurve |
|---|---|---|---|---|---|---|---|
| A | 7317 | 5495 | 4 | 4 | 0.05% | 0.07% | 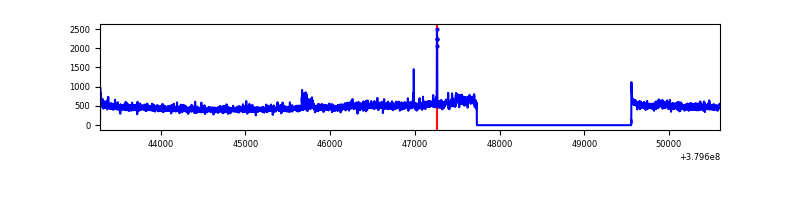 |
| B | 7317 | 5495 | 100 | 100 | 1.37% | 1.82% | 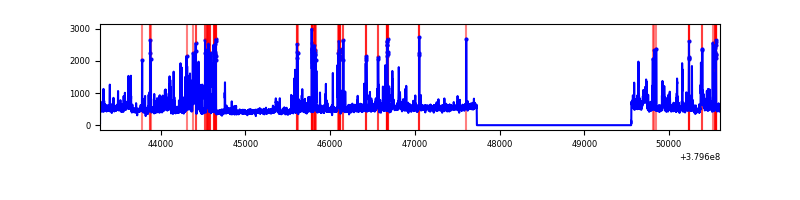 |
| C | 7317 | 5495 | 57 | 57 | 0.78% | 1.04% | 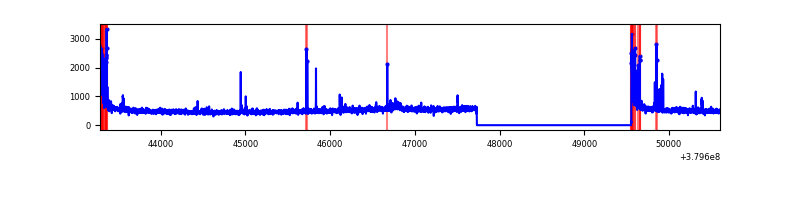 |
| D | 7317 | 5495 | 197 | 197 | 2.69% | 3.59% | 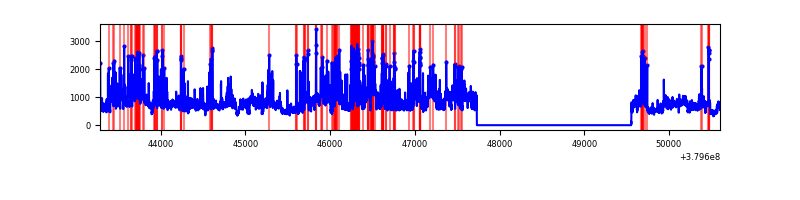 |
Top three noisy pixels from each quadrant. If the there are fewer than three noisy pixels in the level2.evt file, extra rows are filled as -1
| Pixel properties | Quadrant properties | ||||||
|---|---|---|---|---|---|---|---|
| Quadrant | DetID | PixID | Counts | Sigma | Mean | Median | Sigma |
| A | 15 | 169 | 115576 | 903.13 | 642 | 631 | 127.3 |
| A | 13 | 6 | 19621 | 149.21 | 642 | 631 | 127.3 |
| A | 10 | 83 | 17403 | 131.78 | 642 | 631 | 127.3 |
| B | 5 | 172 | 494660 | 4099.99 | 635 | 619 | 120.5 |
| B | 0 | 190 | 157864 | 1304.96 | 635 | 619 | 120.5 |
| B | 0 | 189 | 89103 | 734.32 | 635 | 619 | 120.5 |
| C | 15 | 214 | 254284 | 1786.85 | 615 | 618 | 142.0 |
| C | 0 | 10 | 211268 | 1483.84 | 615 | 618 | 142.0 |
| C | 3 | 233 | 81898 | 572.54 | 615 | 618 | 142.0 |
| D | 8 | 195 | 1433301 | 8972.88 | 605 | 591 | 159.7 |
| D | 2 | 249 | 316267 | 1977.04 | 605 | 591 | 159.7 |
| D | 2 | 250 | 215348 | 1345.0 | 605 | 591 | 159.7 |
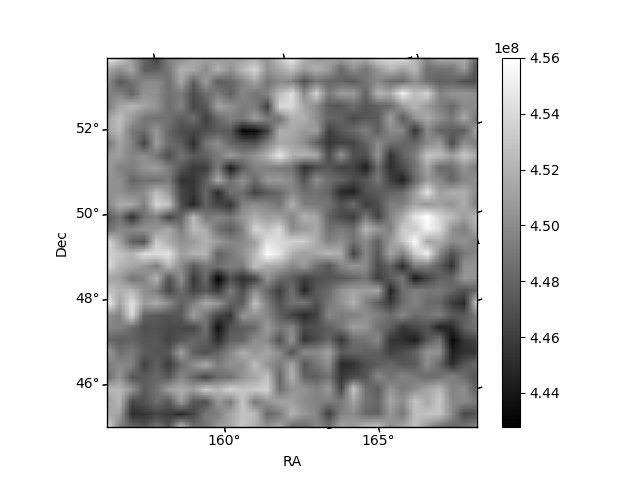
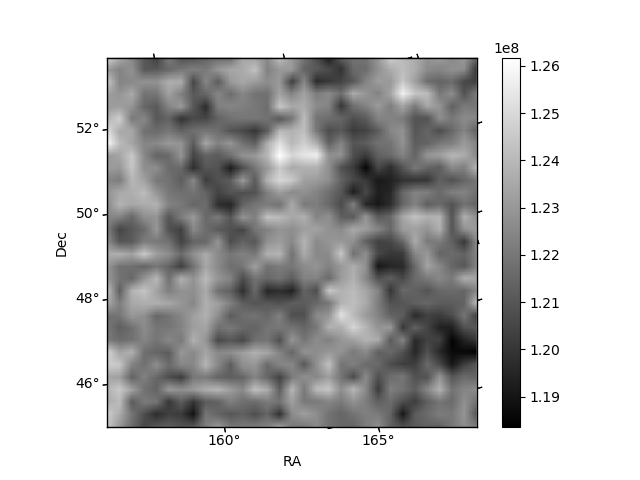
Histogram calculated using DETX and DETY for each event in the final _common_clean file
| Quadrant A | 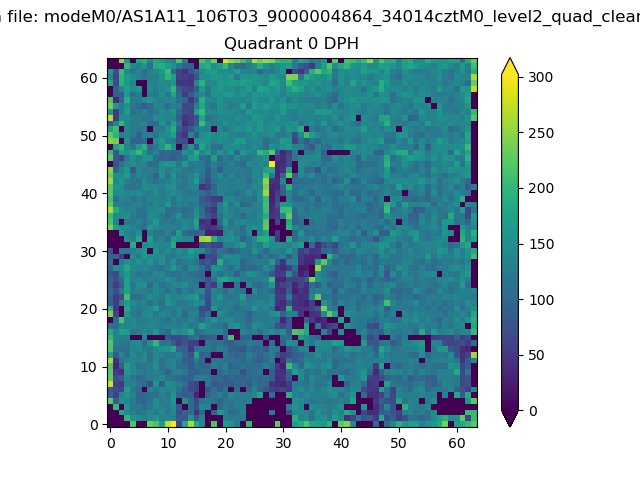 |
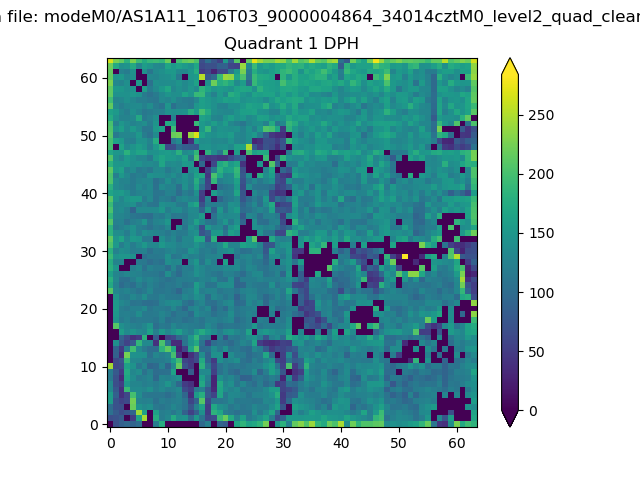 |
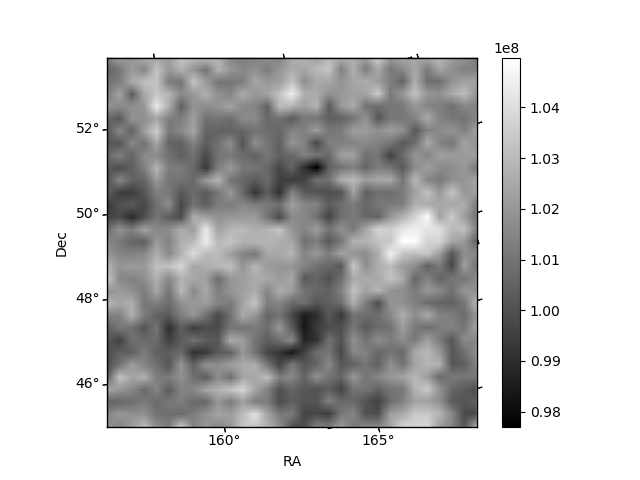
Quadrant B |
|---|---|---|---|
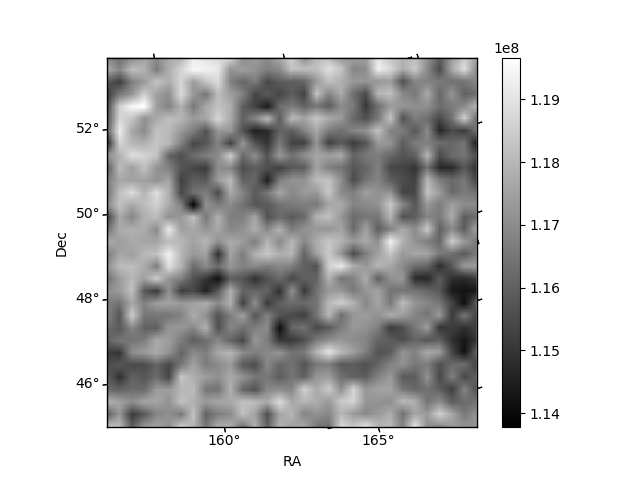
| Quadrant D | 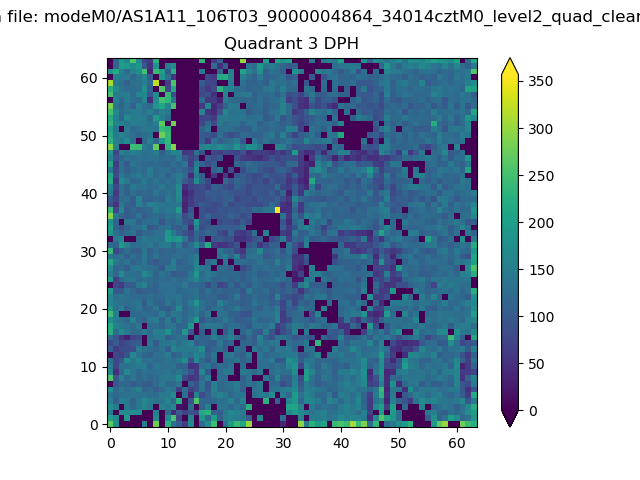 |
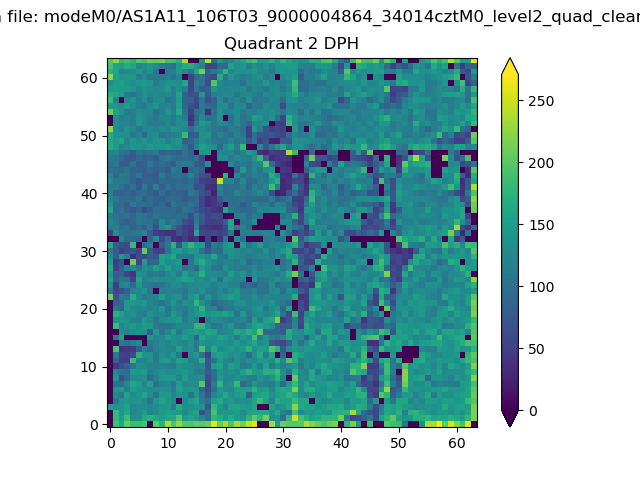 |
Quadrant C |
| Plot type | Count rate plots | Images |
|---|---|---|
| Comparison with Poisson distribution Blue bars denote a histogram of data divided into 1 sec bins. Red curve is a Poisson curve with rate = median count rate of data. |
 |
 |
| Quadrant-wise count rates Data is divided into 100 sec bins |
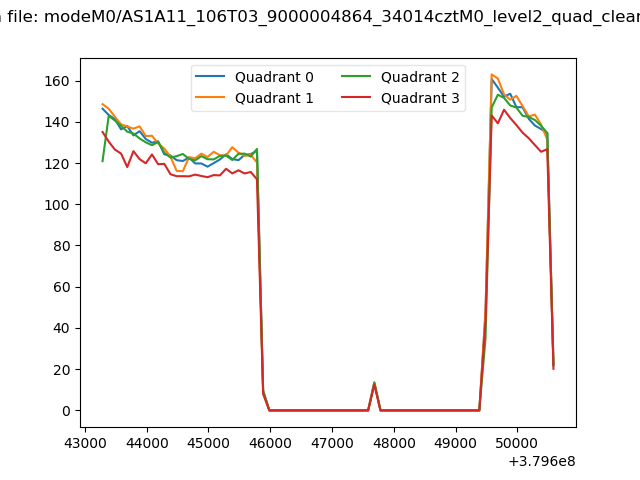 |
|
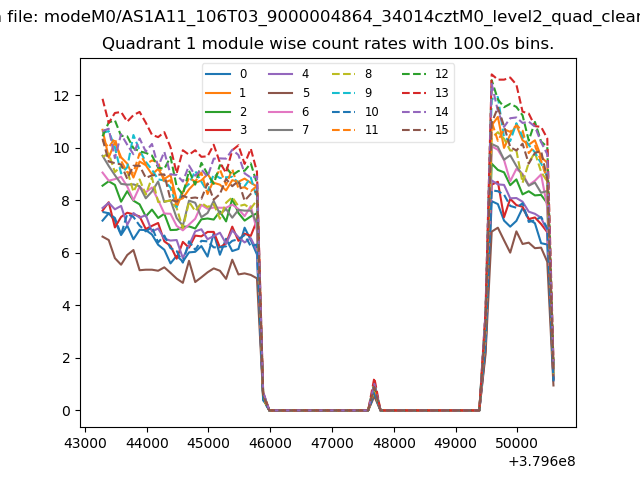
| Module-wise count rates for Quadrant A Data is divided into 100 sec bins |
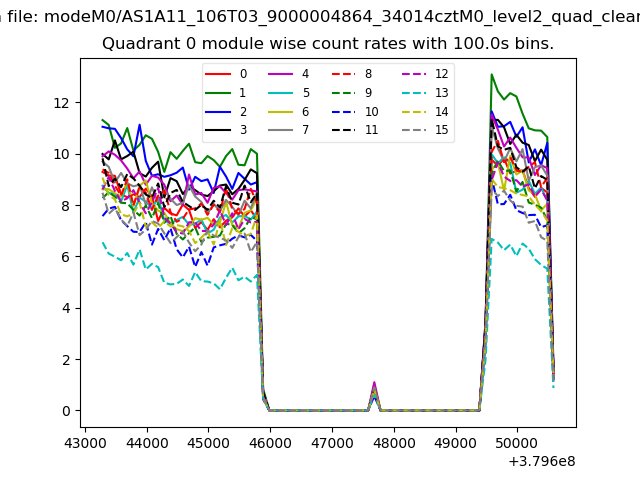 |
 |
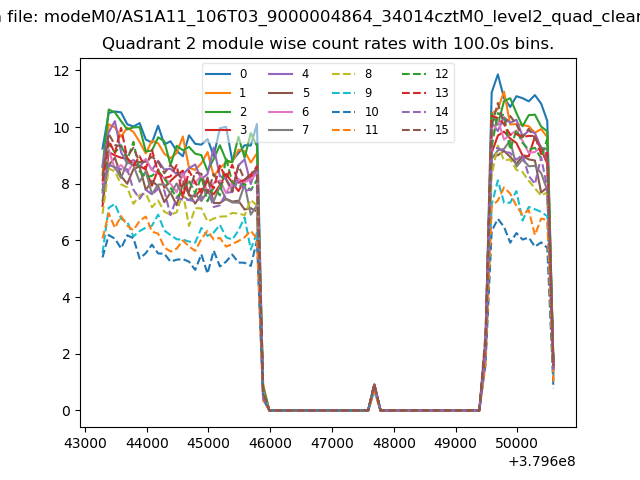
| Module-wise count rates for Quadrant B Data is divided into 100 sec bins |
 |
 |
| Module-wise count rates for Quadrant C Data is divided into 100 sec bins |
 |
 |
| Module-wise count rates for Quadrant D Data is divided into 100 sec bins |
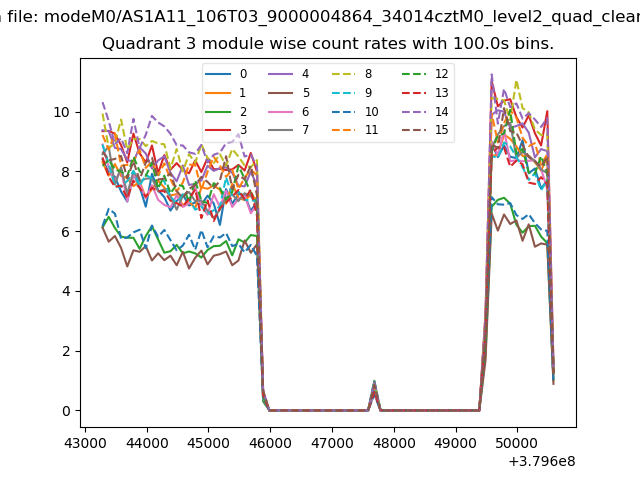 |
 |
| Parameter | Plot |
|---|---|
| CZT HV Monitor | 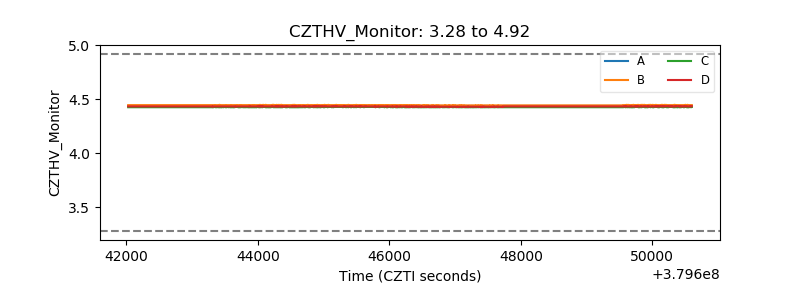 |
| D_VDD | 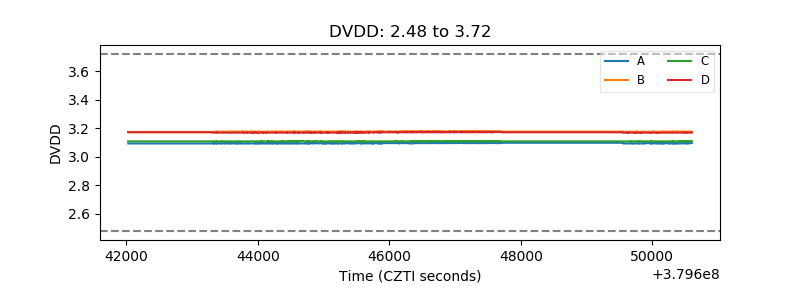 |
| Temperature 1 |  |
| Veto HV Monitor | 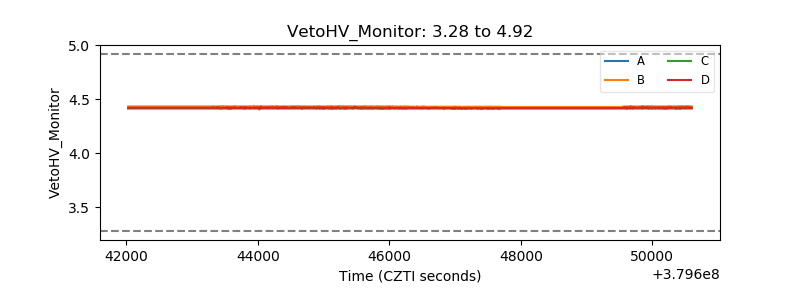 |
| Veto LLD | 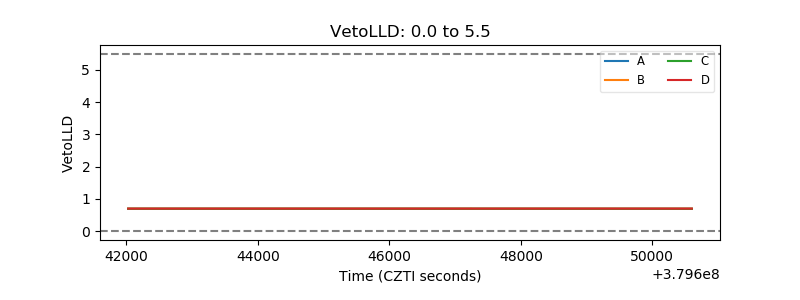 |
| Alpha Counter | 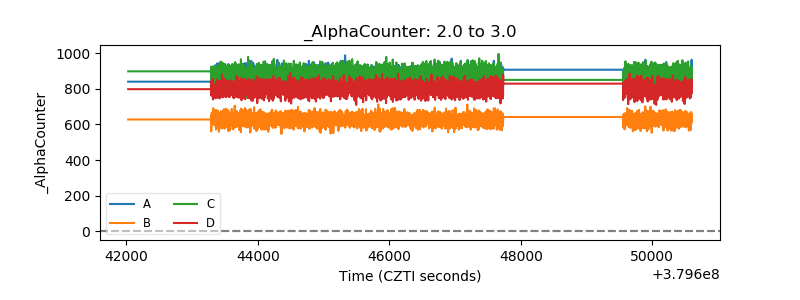 |
| _CPM_Rate | 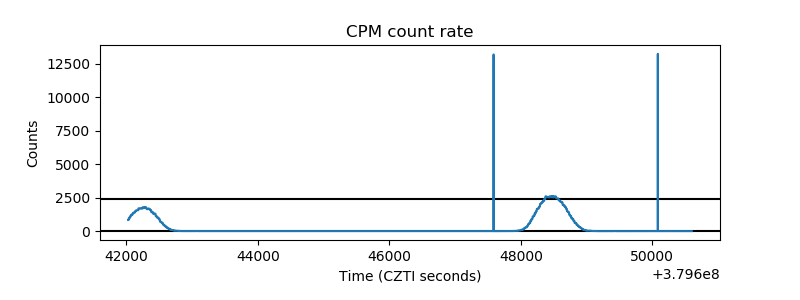 |
| CZT Counter | 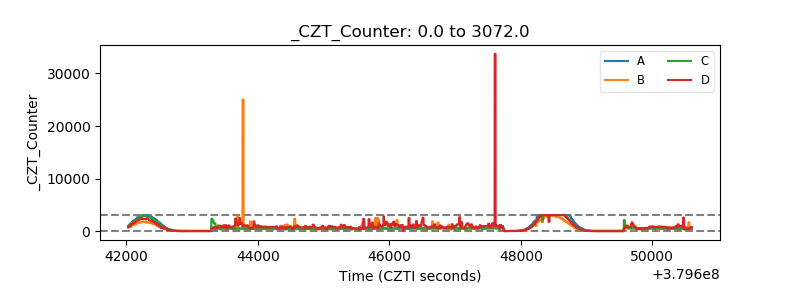 |
| +2.5 Volts monitor |  |
| +5 Volts monitor |  |
| _ROLL_ROT | 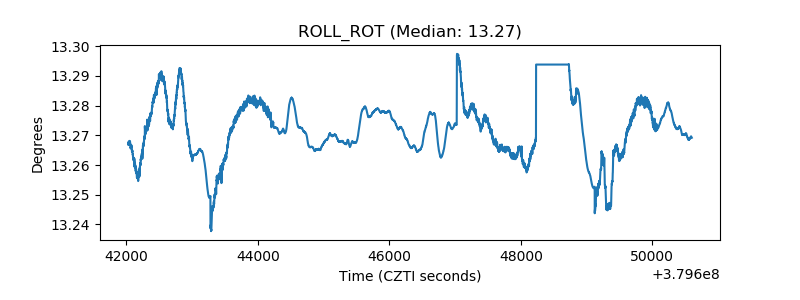 |
| _Roll_DEC |  |
| _Roll_RA | 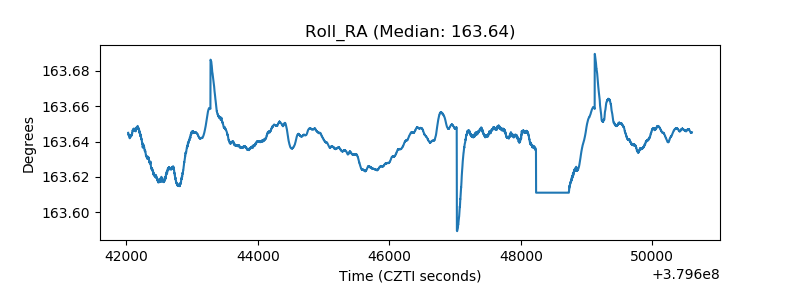 |
| Veto Counter | 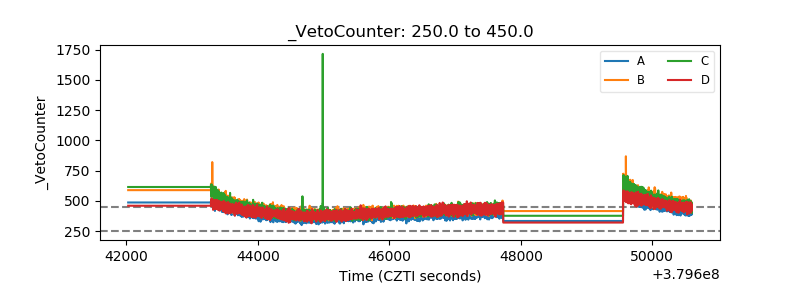 |