| Param | Original file | Final file |
|---|---|---|
| Filename | modeM0/AS1A11_106T03_9000004864_34017cztM0_level2.evt | modeM0/AS1A11_106T03_9000004864_34017cztM0_level2_quad_clean.evt |
| Size (bytes) | 460,183,680 | 67,777,920 |
| Size | 438.9 MB | 64.6 MB |
| Events in quadrant A | 2,600,817 | 451,672 |
| Events in quadrant B | 4,064,864 | 417,970 |
| Events in quadrant C | 2,945,606 | 433,883 |
| Events in quadrant D | 4,003,402 | 415,128 |
| Mode M9 | |||
|---|---|---|---|
| Quadrant | BADHDUFLAG | Total packets | Discarded packets |
| A | 0 | 21 | 0 |
| B | 0 | 21 | 0 |
| C | 0 | 21 | 0 |
| D | 0 | 21 | 0 |
| Mode M0 | |||
|---|---|---|---|
| Quadrant | BADHDUFLAG | Total packets | Discarded packets |
| A | 0 | 10373 | 2 |
| B | 0 | 14939 | 1 |
| C | 0 | 11673 | 1 |
| D | 0 | 15157 | 1 |
| Mode SS | |||
|---|---|---|---|
| Quadrant | BADHDUFLAG | Total packets | Discarded packets |
| A | 0 | 98 | 0 |
| B | 0 | 98 | 0 |
| C | 0 | 98 | 0 |
| D | 0 | 98 | 0 |
| Quadrant | Total seconds | Saturated seconds | Saturation percentage |
|---|---|---|---|
| A | 4744 | 4 | 0.084317% |
| B | 4744 | 626 | 13.195616% |
| C | 4744 | 40 | 0.843170% |
| D | 4744 | 199 | 4.194772% |
Noise dominated data is calculated using 1-second bins in cleaned event files. If a bin has >2000 counts, and if more than 50% of those come from <1% of pixels, then it is considered to be noise-dominated and hence unusable.
| Quadrant | # 1 sec bins | Bins with >0 counts | Bins with >2000 counts | High rate bins dominated by noise | Noise dominated (total time) | Noise dominated (detector-on time) | Marked lightcurve |
|---|---|---|---|---|---|---|---|
| A | 6867 | 4745 | 0 | 0 | 0.00% | 0.00% | 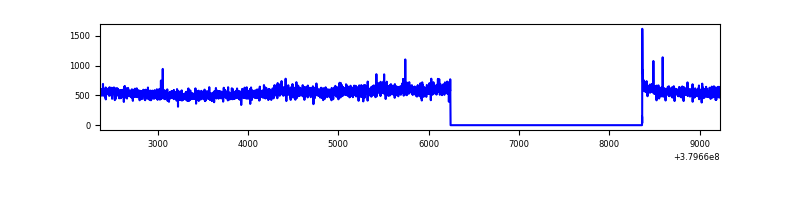 |
| B | 6867 | 4745 | 528 | 528 | 7.69% | 11.13% | 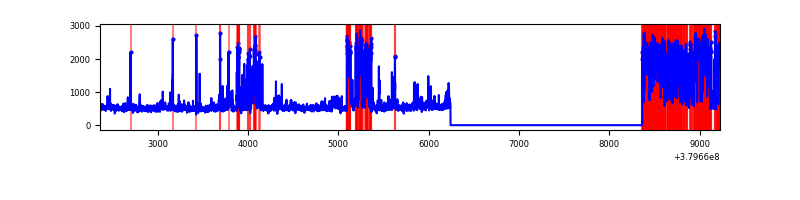 |
| C | 6867 | 4745 | 38 | 38 | 0.55% | 0.80% | 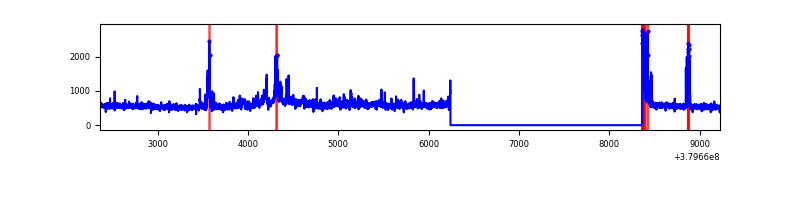 |
| D | 6867 | 4745 | 178 | 178 | 2.59% | 3.75% | 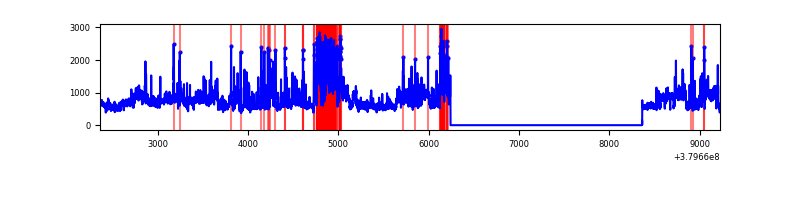 |
Top three noisy pixels from each quadrant. If the there are fewer than three noisy pixels in the level2.evt file, extra rows are filled as -1
| Pixel properties | Quadrant properties | ||||||
|---|---|---|---|---|---|---|---|
| Quadrant | DetID | PixID | Counts | Sigma | Mean | Median | Sigma |
| A | 15 | 169 | 186309 | 1514.55 | 619 | 610 | 122.6 |
| A | 10 | 83 | 10541 | 80.99 | 619 | 610 | 122.6 |
| A | 13 | 6 | 9681 | 73.98 | 619 | 610 | 122.6 |
| B | 5 | 172 | 1497032 | 14040.25 | 575 | 564 | 106.6 |
| B | 5 | 31 | 96022 | 895.61 | 575 | 564 | 106.6 |
| B | 0 | 189 | 86541 | 806.66 | 575 | 564 | 106.6 |
| C | 3 | 233 | 305054 | 2305.48 | 581 | 585 | 132.1 |
| C | 15 | 214 | 218738 | 1651.89 | 581 | 585 | 132.1 |
| C | 0 | 10 | 84931 | 638.68 | 581 | 585 | 132.1 |
| D | 8 | 195 | 898548 | 6210.5 | 587 | 569 | 144.6 |
| D | 12 | 233 | 408838 | 2823.63 | 587 | 569 | 144.6 |
| D | 2 | 250 | 110987 | 763.66 | 587 | 569 | 144.6 |
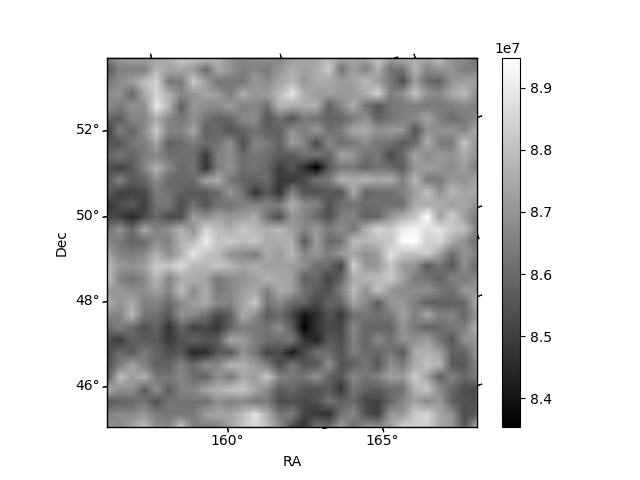
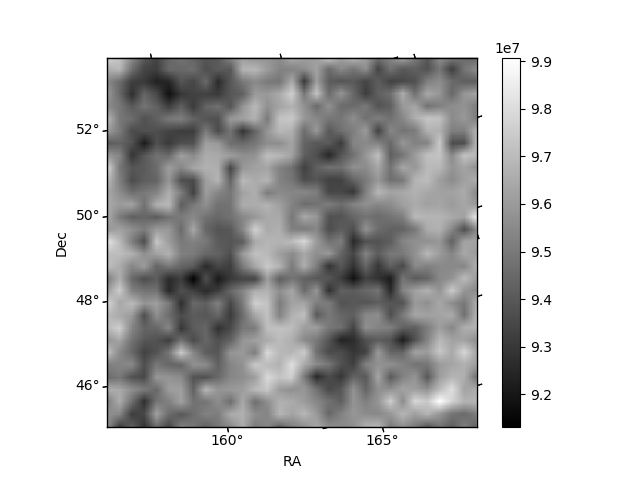
Histogram calculated using DETX and DETY for each event in the final _common_clean file
| Quadrant A |  |
 |
Quadrant B |
|---|---|---|---|
| Quadrant D |  |
 |
Quadrant C |
| Plot type | Count rate plots | Images |
|---|---|---|
| Comparison with Poisson distribution Blue bars denote a histogram of data divided into 1 sec bins. Red curve is a Poisson curve with rate = median count rate of data. |
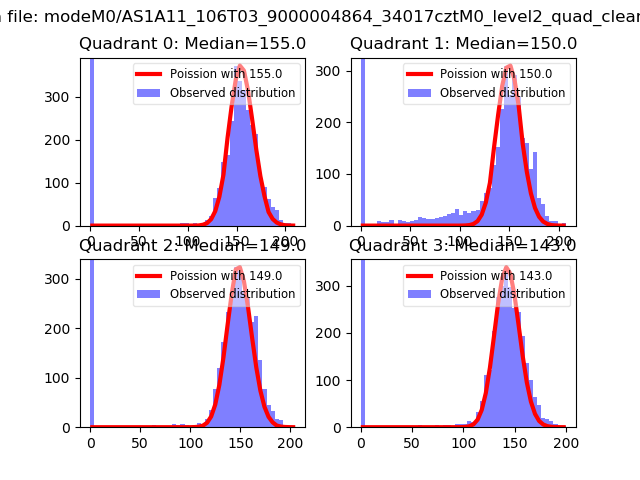 |
 |
| Quadrant-wise count rates Data is divided into 100 sec bins |
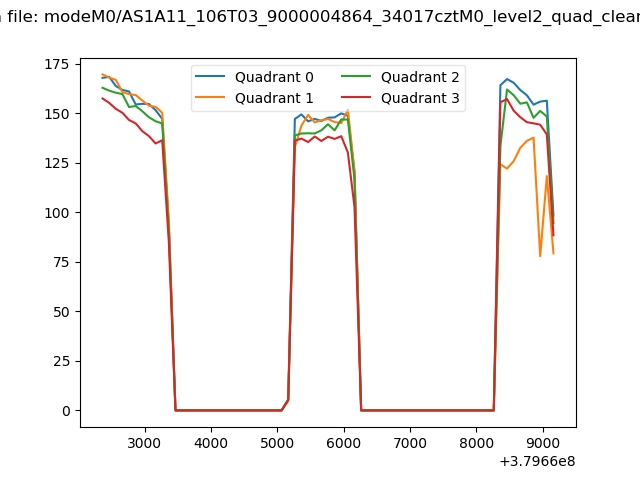 |
|
| Module-wise count rates for Quadrant A Data is divided into 100 sec bins |
 |
 |
| Module-wise count rates for Quadrant B Data is divided into 100 sec bins |
 |
 |
| Module-wise count rates for Quadrant C Data is divided into 100 sec bins |
 |
 |
| Module-wise count rates for Quadrant D Data is divided into 100 sec bins |
 |
 |
| Parameter | Plot |
|---|---|
| CZT HV Monitor |  |
| D_VDD |  |
| Temperature 1 |  |
| Veto HV Monitor |  |
| Veto LLD |  |
| Alpha Counter | 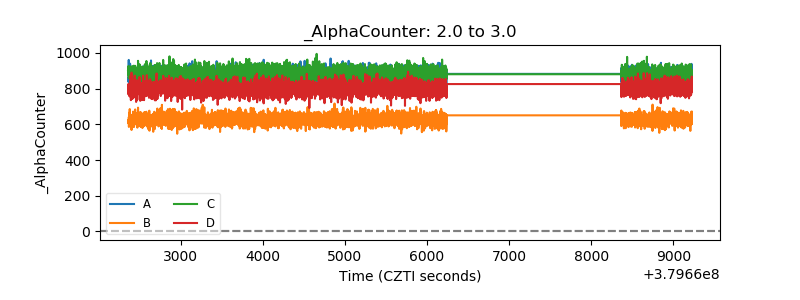 |
| _CPM_Rate | 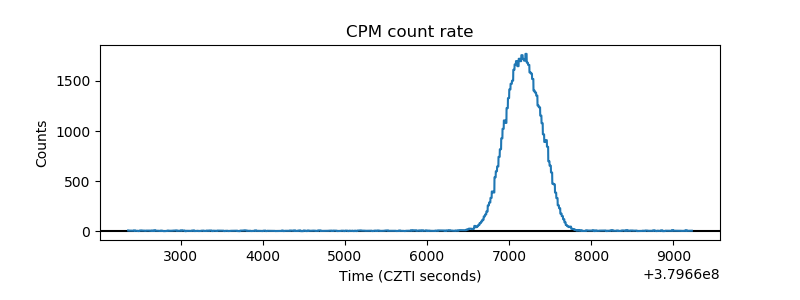 |
| CZT Counter |  |
| +2.5 Volts monitor |  |
| +5 Volts monitor |  |
| _ROLL_ROT |  |
| _Roll_DEC |  |
| _Roll_RA |  |
| Veto Counter |  |