| Param | Original file | Final file |
|---|---|---|
| Filename | modeM0/AS1A11_106T03_9000004864_34018cztM0_level2.evt | modeM0/AS1A11_106T03_9000004864_34018cztM0_level2_quad_clean.evt |
| Size (bytes) | 488,485,440 | 62,625,600 |
| Size | 465.9 MB | 59.7 MB |
| Events in quadrant A | 2,517,505 | 417,954 |
| Events in quadrant B | 4,899,870 | 361,682 |
| Events in quadrant C | 2,964,108 | 397,609 |
| Events in quadrant D | 4,089,497 | 384,112 |
| Mode M9 | |||
|---|---|---|---|
| Quadrant | BADHDUFLAG | Total packets | Discarded packets |
| A | 0 | 25 | 0 |
| B | 0 | 25 | 0 |
| C | 0 | 25 | 0 |
| D | 0 | 26 | 0 |
| Mode M0 | |||
|---|---|---|---|
| Quadrant | BADHDUFLAG | Total packets | Discarded packets |
| A | 0 | 10025 | 3 |
| B | 0 | 17623 | 2 |
| C | 0 | 11593 | 2 |
| D | 0 | 15414 | 2 |
| Mode SS | |||
|---|---|---|---|
| Quadrant | BADHDUFLAG | Total packets | Discarded packets |
| A | 0 | 96 | 0 |
| B | 0 | 96 | 0 |
| C | 0 | 96 | 0 |
| D | 0 | 96 | 0 |
| Quadrant | Total seconds | Saturated seconds | Saturation percentage |
|---|---|---|---|
| A | 4767 | 6 | 0.125865% |
| B | 4767 | 885 | 18.565135% |
| C | 4767 | 80 | 1.678204% |
| D | 4767 | 175 | 3.671072% |
Noise dominated data is calculated using 1-second bins in cleaned event files. If a bin has >2000 counts, and if more than 50% of those come from <1% of pixels, then it is considered to be noise-dominated and hence unusable.
| Quadrant | # 1 sec bins | Bins with >0 counts | Bins with >2000 counts | High rate bins dominated by noise | Noise dominated (total time) | Noise dominated (detector-on time) | Marked lightcurve |
|---|---|---|---|---|---|---|---|
| A | 6918 | 4768 | 1 | 1 | 0.01% | 0.02% | 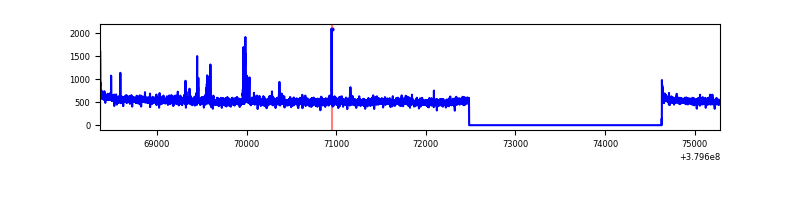 |
| B | 6918 | 4768 | 750 | 750 | 10.84% | 15.73% | 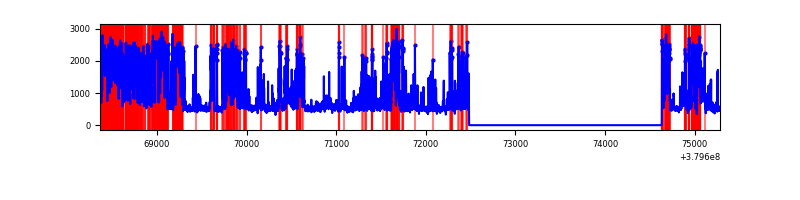 |
| C | 6918 | 4768 | 80 | 80 | 1.16% | 1.68% | 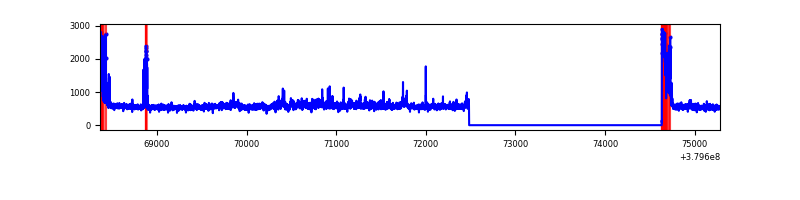 |
| D | 6918 | 4768 | 161 | 161 | 2.33% | 3.38% | 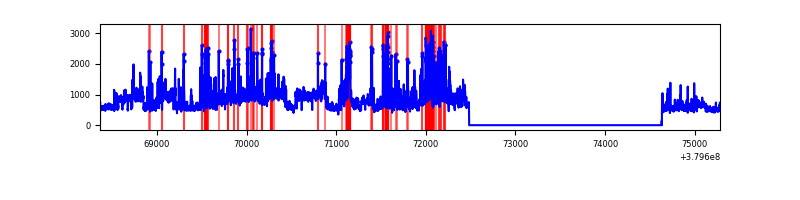 |
Top three noisy pixels from each quadrant. If the there are fewer than three noisy pixels in the level2.evt file, extra rows are filled as -1
| Pixel properties | Quadrant properties | ||||||
|---|---|---|---|---|---|---|---|
| Quadrant | DetID | PixID | Counts | Sigma | Mean | Median | Sigma |
| A | 15 | 169 | 88038 | 727.47 | 611 | 602 | 120.2 |
| A | 0 | 31 | 40262 | 329.97 | 611 | 602 | 120.2 |
| A | 10 | 83 | 17244 | 138.46 | 611 | 602 | 120.2 |
| B | 5 | 172 | 2407604 | 23078.31 | 556 | 545 | 104.3 |
| B | 5 | 31 | 66706 | 634.34 | 556 | 545 | 104.3 |
| B | 0 | 189 | 61404 | 583.5 | 556 | 545 | 104.3 |
| C | 0 | 10 | 243766 | 1857.85 | 575 | 578 | 130.9 |
| C | 15 | 214 | 226261 | 1724.12 | 575 | 578 | 130.9 |
| C | 3 | 233 | 177712 | 1353.22 | 575 | 578 | 130.9 |
| D | 8 | 195 | 961605 | 6099.35 | 578 | 568 | 157.6 |
| D | 2 | 250 | 161168 | 1019.27 | 578 | 568 | 157.6 |
| D | 12 | 233 | 159607 | 1009.36 | 578 | 568 | 157.6 |
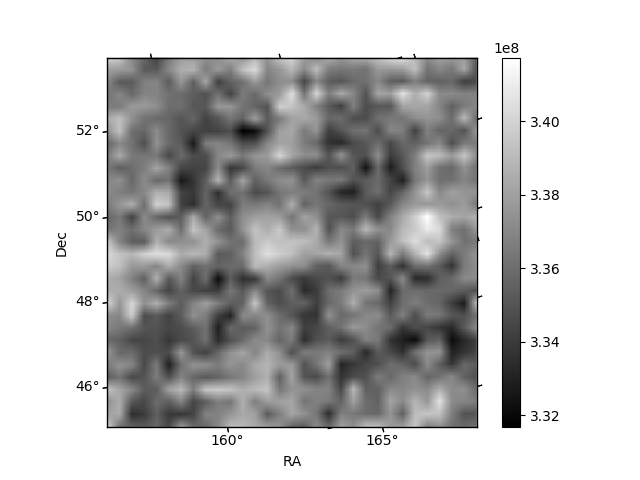
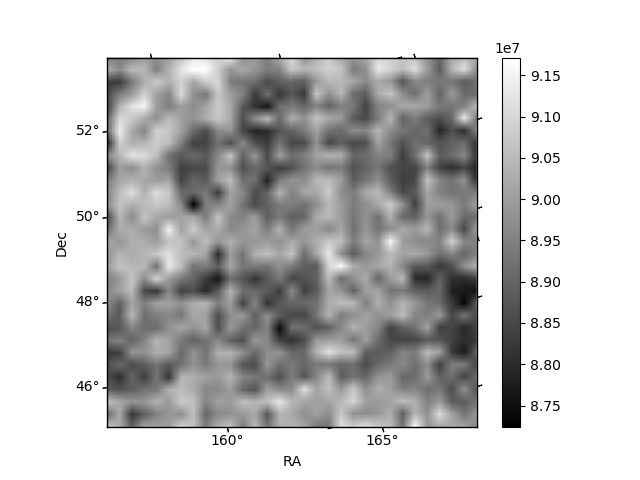
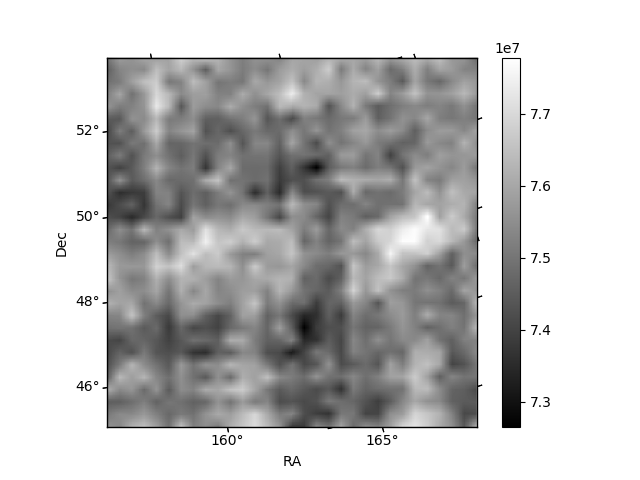
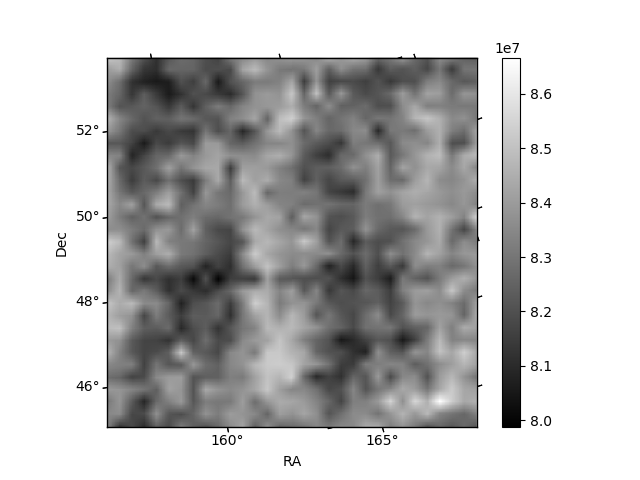
Histogram calculated using DETX and DETY for each event in the final _common_clean file
| Quadrant A | 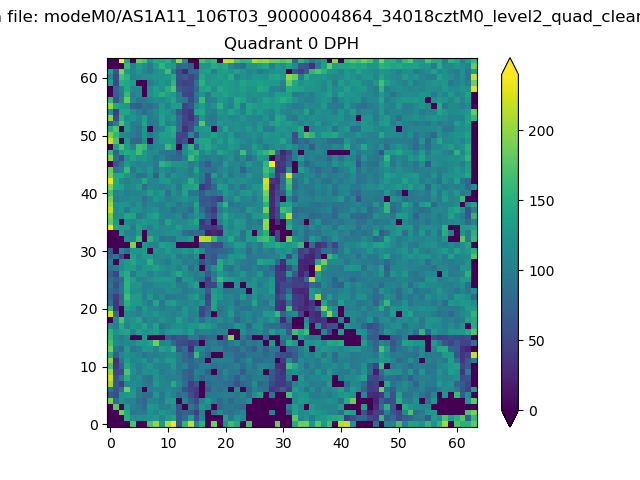 |
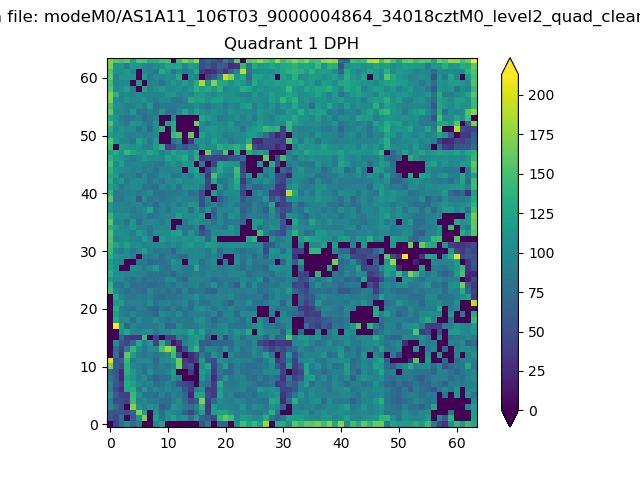 |
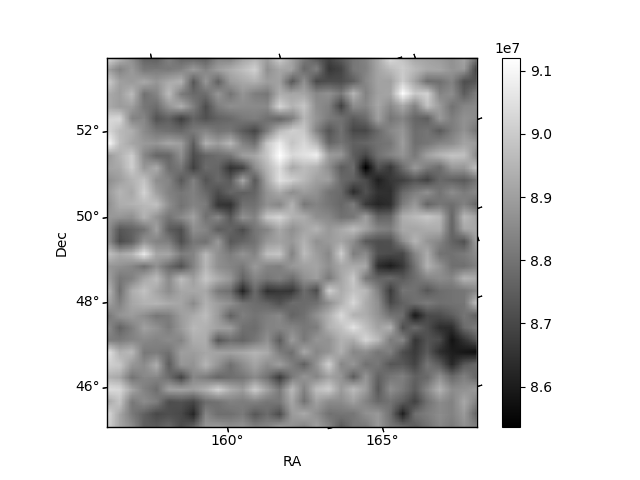
Quadrant B |
|---|---|---|---|
| Quadrant D | 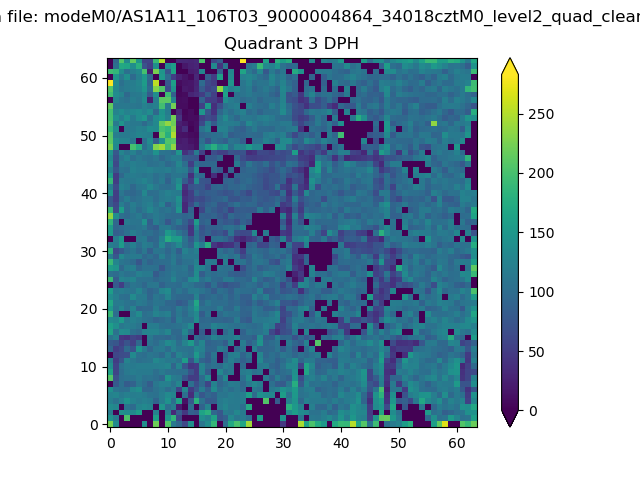 |
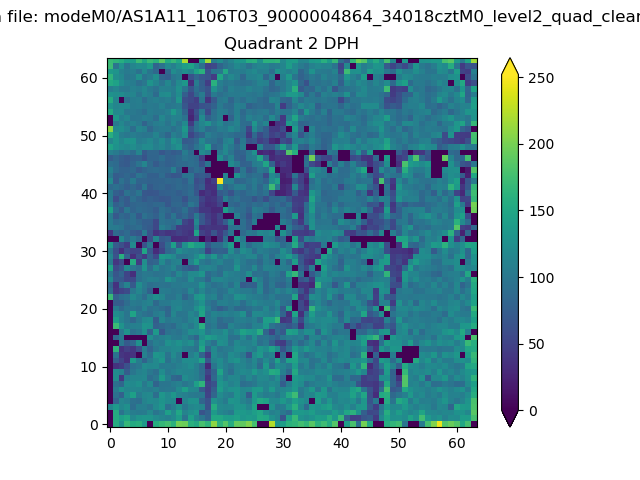 |
Quadrant C |
| Plot type | Count rate plots | Images |
|---|---|---|
| Comparison with Poisson distribution Blue bars denote a histogram of data divided into 1 sec bins. Red curve is a Poisson curve with rate = median count rate of data. |
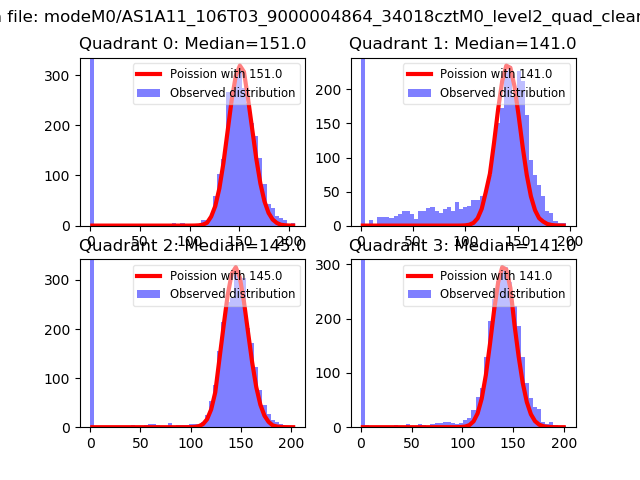 |
 |
| Quadrant-wise count rates Data is divided into 100 sec bins |
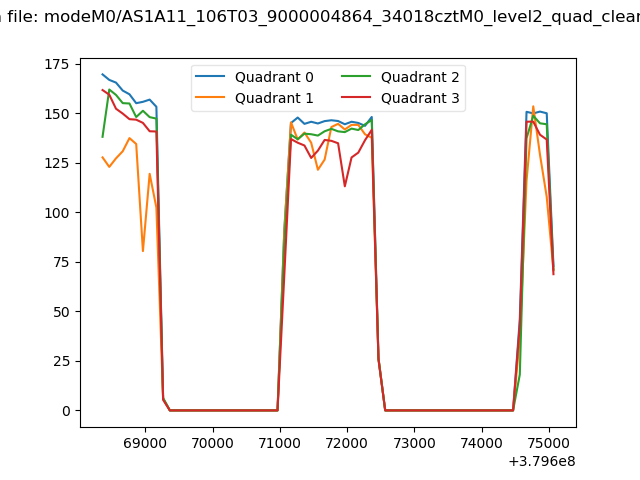 |
|
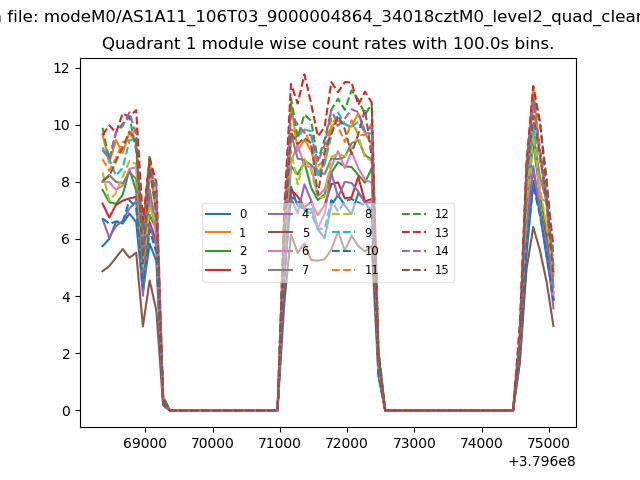
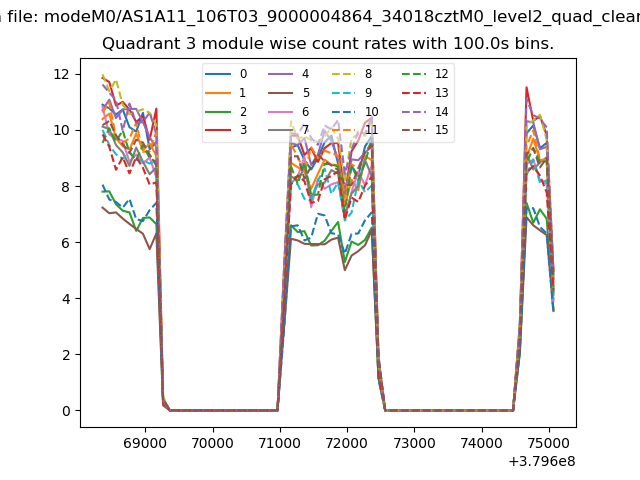
| Module-wise count rates for Quadrant A Data is divided into 100 sec bins |
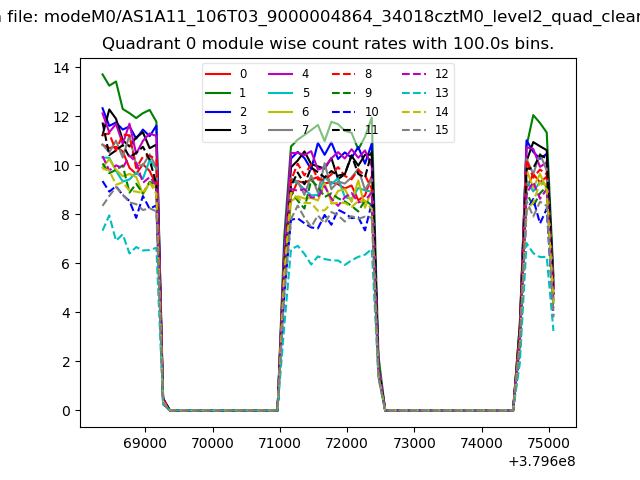 |
 |
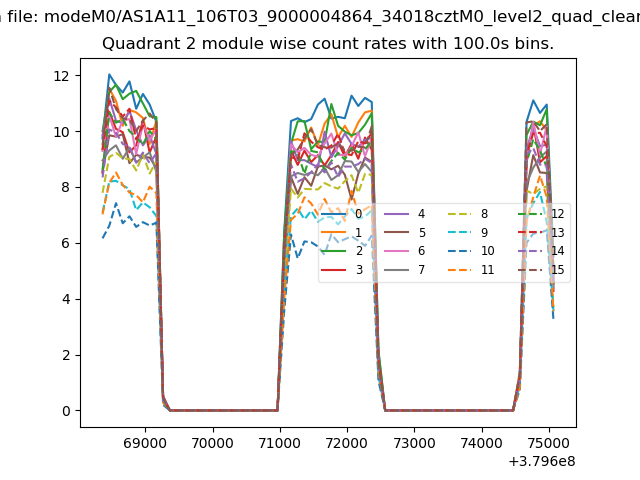
| Module-wise count rates for Quadrant B Data is divided into 100 sec bins |
 |
 |
| Module-wise count rates for Quadrant C Data is divided into 100 sec bins |
 |
 |
| Module-wise count rates for Quadrant D Data is divided into 100 sec bins |
 |
 |
| Parameter | Plot |
|---|---|
| CZT HV Monitor | 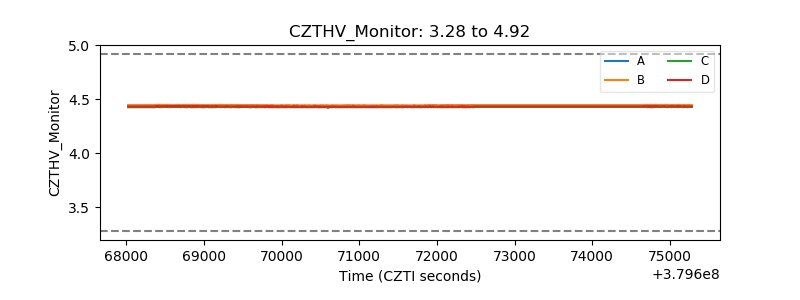 |
| D_VDD | 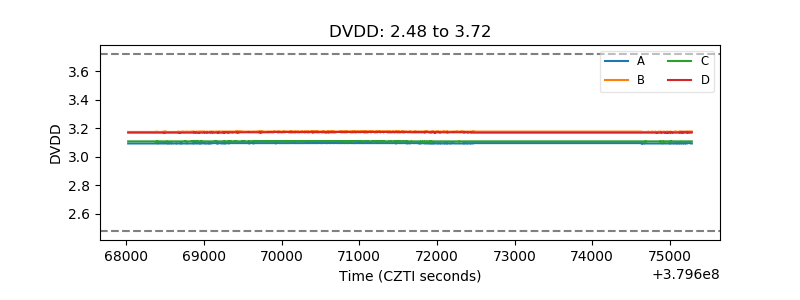 |
| Temperature 1 | 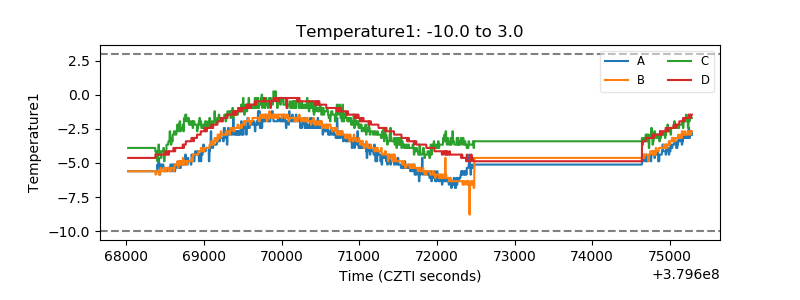 |
| Veto HV Monitor | 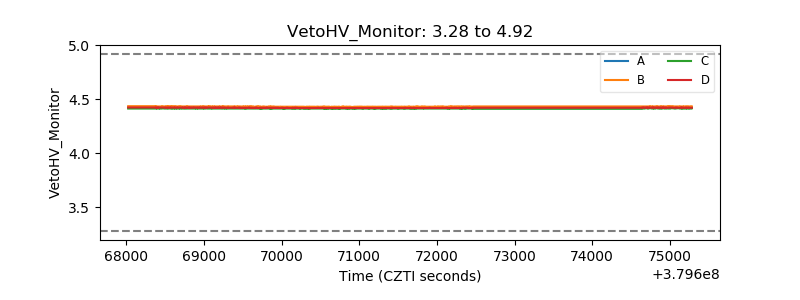 |
| Veto LLD | 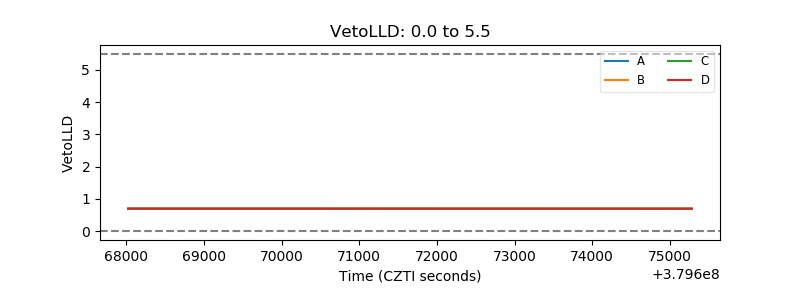 |
| Alpha Counter | 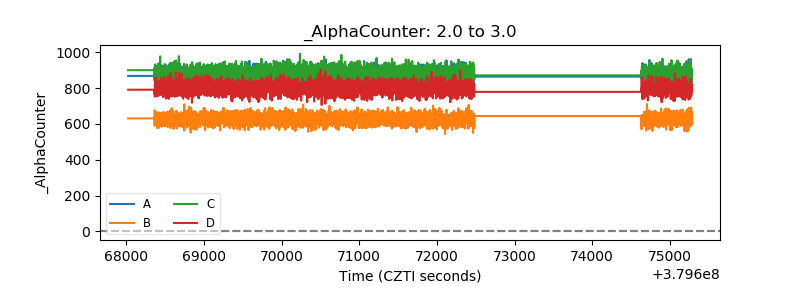 |
| _CPM_Rate | 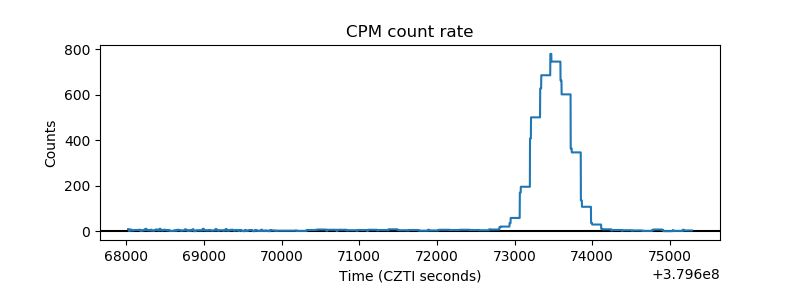 |
| CZT Counter | 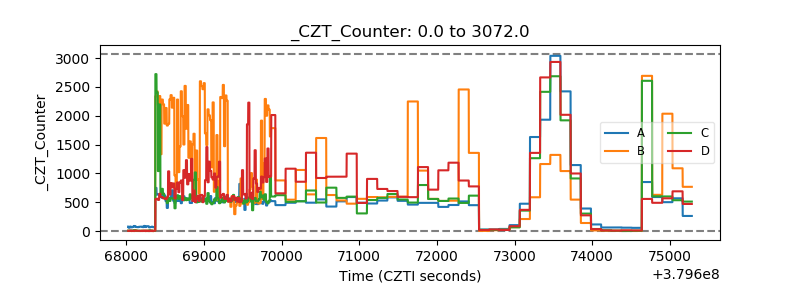 |
| +2.5 Volts monitor |  |
| +5 Volts monitor |  |
| _ROLL_ROT | 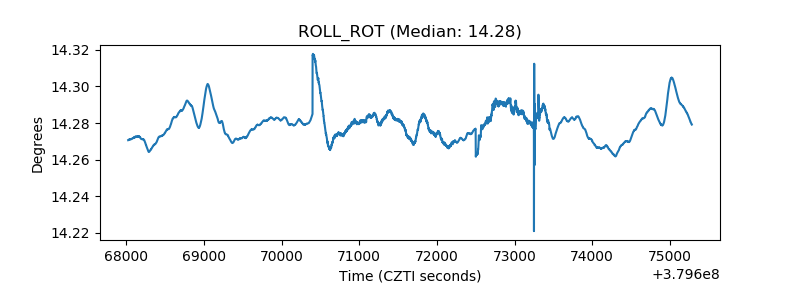 |
| _Roll_DEC | 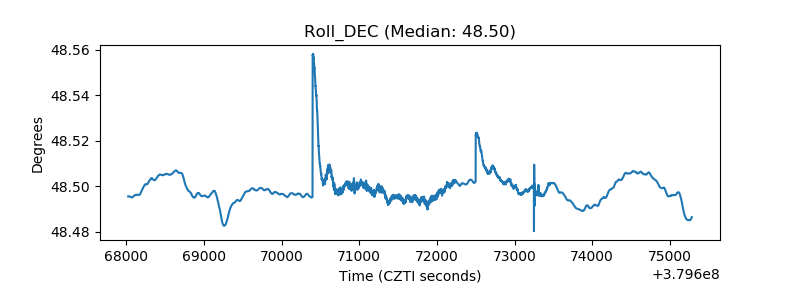 |
| _Roll_RA | 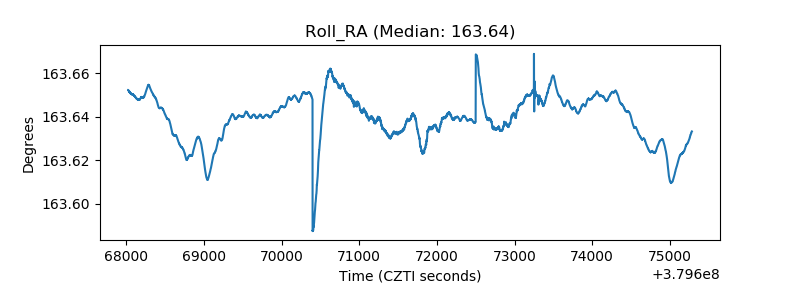 |
| Veto Counter | 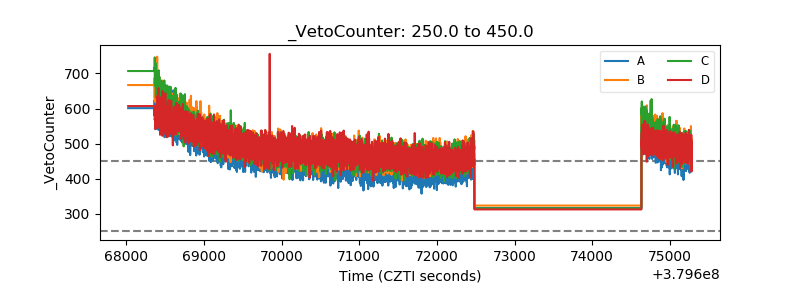 |