| Param | Original file | Final file |
|---|---|---|
| Filename | modeM0/AS1A11_106T03_9000004864_34019cztM0_level2.evt | modeM0/AS1A11_106T03_9000004864_34019cztM0_level2_quad_clean.evt |
| Size (bytes) | 290,390,400 | 29,819,520 |
| Size | 276.9 MB | 28.4 MB |
| Events in quadrant A | 1,528,655 | 181,089 |
| Events in quadrant B | 2,792,115 | 160,415 |
| Events in quadrant C | 1,822,822 | 170,852 |
| Events in quadrant D | 2,439,207 | 169,257 |
| Mode M9 | |||
|---|---|---|---|
| Quadrant | BADHDUFLAG | Total packets | Discarded packets |
| A | 0 | 10 | 0 |
| B | 0 | 10 | 0 |
| C | 0 | 10 | 0 |
| D | 0 | 11 | 0 |
| Mode M0 | |||
|---|---|---|---|
| Quadrant | BADHDUFLAG | Total packets | Discarded packets |
| A | 0 | 6274 | 1 |
| B | 0 | 10270 | 1 |
| C | 0 | 7095 | 1 |
| D | 0 | 9314 | 1 |
| Mode SS | |||
|---|---|---|---|
| Quadrant | BADHDUFLAG | Total packets | Discarded packets |
| A | 0 | 62 | 0 |
| B | 0 | 62 | 0 |
| C | 0 | 62 | 0 |
| D | 0 | 62 | 0 |
| Quadrant | Total seconds | Saturated seconds | Saturation percentage |
|---|---|---|---|
| A | 3100 | 3 | 0.096774% |
| B | 3100 | 402 | 12.967742% |
| C | 3100 | 47 | 1.516129% |
| D | 3100 | 98 | 3.161290% |
Noise dominated data is calculated using 1-second bins in cleaned event files. If a bin has >2000 counts, and if more than 50% of those come from <1% of pixels, then it is considered to be noise-dominated and hence unusable.
| Quadrant | # 1 sec bins | Bins with >0 counts | Bins with >2000 counts | High rate bins dominated by noise | Noise dominated (total time) | Noise dominated (detector-on time) | Marked lightcurve |
|---|---|---|---|---|---|---|---|
| A | 3100 | 3100 | 0 | 0 | 0.00% | 0.00% | 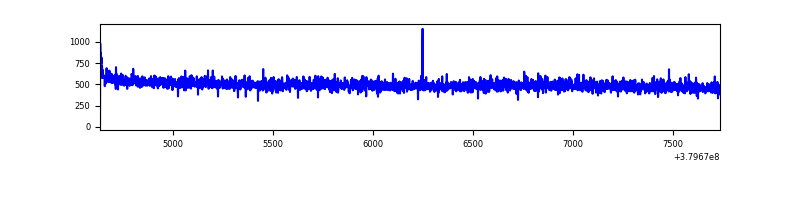 |
| B | 3100 | 3100 | 356 | 356 | 11.48% | 11.48% | 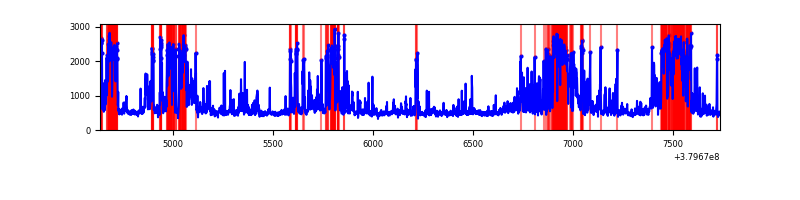 |
| C | 3100 | 3100 | 47 | 47 | 1.52% | 1.52% | 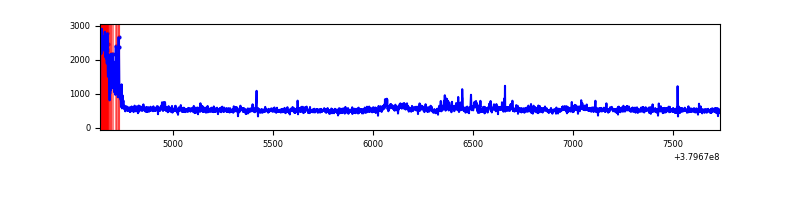 |
| D | 3100 | 3100 | 81 | 81 | 2.61% | 2.61% | 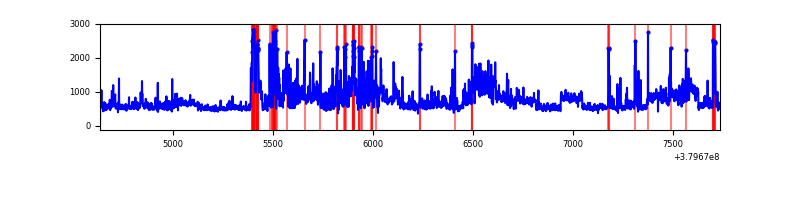 |
Top three noisy pixels from each quadrant. If the there are fewer than three noisy pixels in the level2.evt file, extra rows are filled as -1
| Pixel properties | Quadrant properties | ||||||
|---|---|---|---|---|---|---|---|
| Quadrant | DetID | PixID | Counts | Sigma | Mean | Median | Sigma |
| A | 15 | 169 | 21308 | 271.08 | 384 | 377 | 77.2 |
| A | 13 | 6 | 13449 | 169.3 | 384 | 377 | 77.2 |
| A | 10 | 83 | 8871 | 110.01 | 384 | 377 | 77.2 |
| B | 5 | 172 | 725642 | 10780.55 | 356 | 349 | 67.3 |
| B | 0 | 182 | 254012 | 3770.37 | 356 | 349 | 67.3 |
| B | 5 | 31 | 167094 | 2478.45 | 356 | 349 | 67.3 |
| C | 0 | 10 | 163552 | 1971.96 | 361 | 364 | 82.8 |
| C | 15 | 214 | 144451 | 1741.14 | 361 | 364 | 82.8 |
| C | 3 | 233 | 96779 | 1165.07 | 361 | 364 | 82.8 |
| D | 8 | 195 | 372580 | 3850.66 | 367 | 358 | 96.7 |
| D | 13 | 249 | 132479 | 1366.8 | 367 | 358 | 96.7 |
| D | 7 | 223 | 86024 | 886.22 | 367 | 358 | 96.7 |
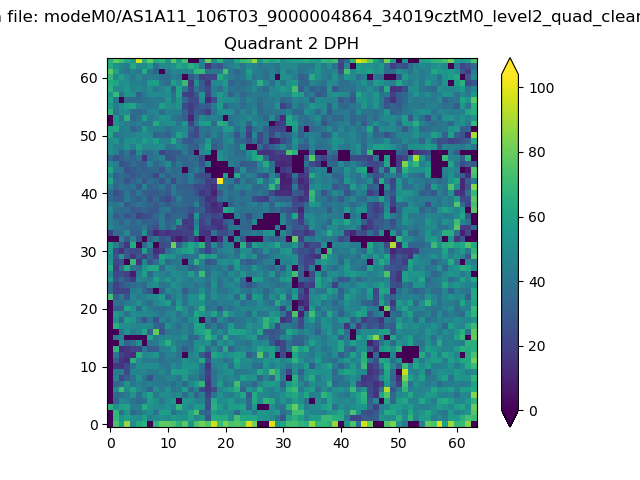
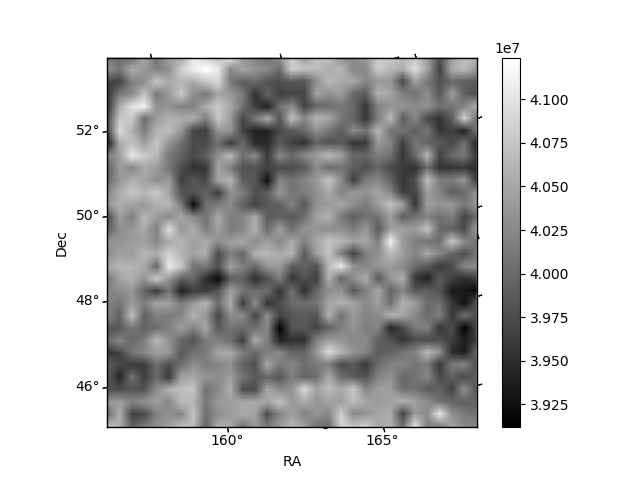
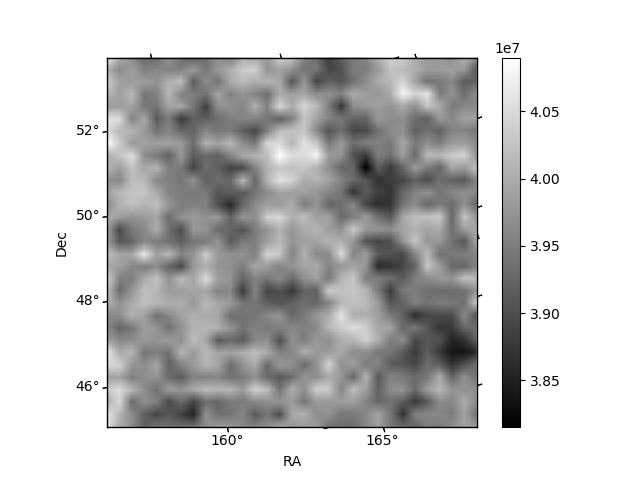
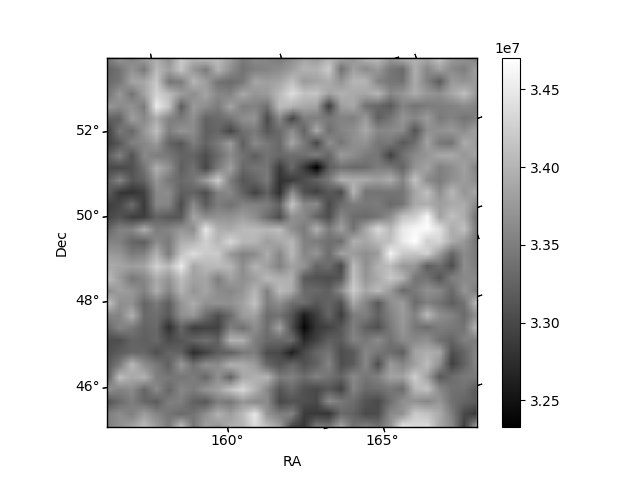
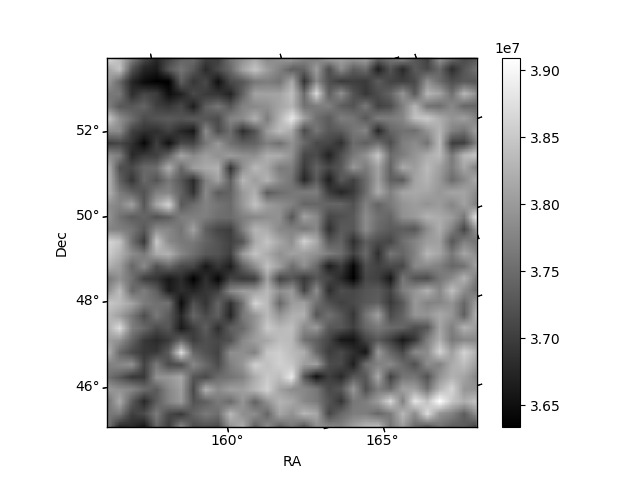
Histogram calculated using DETX and DETY for each event in the final _common_clean file
| Quadrant A |  |
 |
Quadrant B |
|---|---|---|---|
| Quadrant D |  |
 |
Quadrant C |
| Plot type | Count rate plots | Images |
|---|---|---|
| Comparison with Poisson distribution Blue bars denote a histogram of data divided into 1 sec bins. Red curve is a Poisson curve with rate = median count rate of data. |
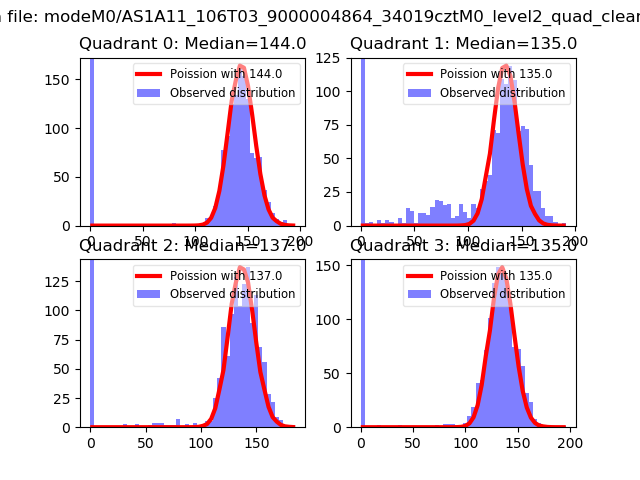 |
 |
| Quadrant-wise count rates Data is divided into 100 sec bins |
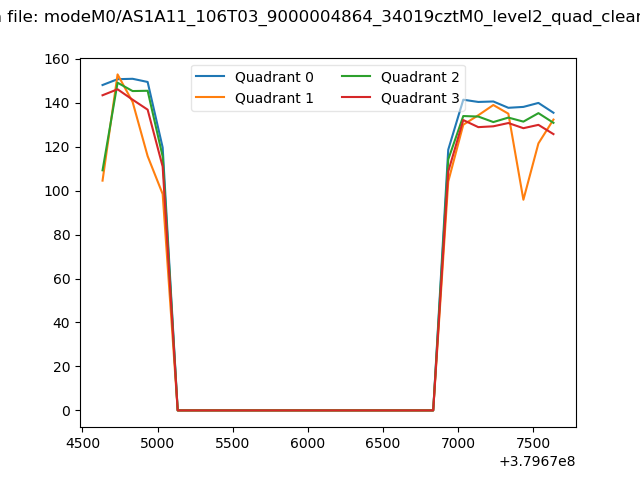 |
|
| Module-wise count rates for Quadrant A Data is divided into 100 sec bins |
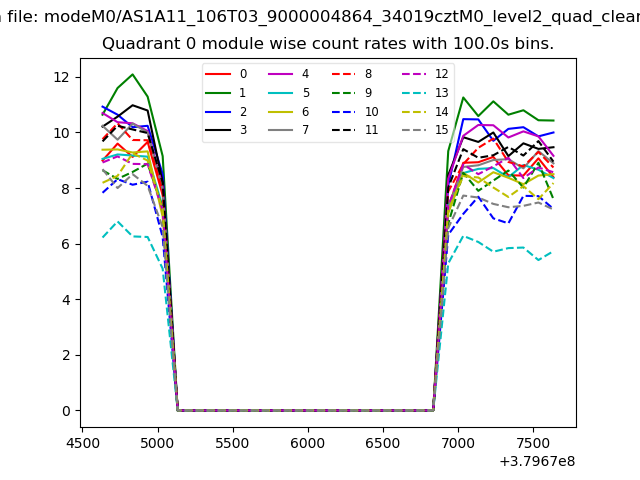 |
 |
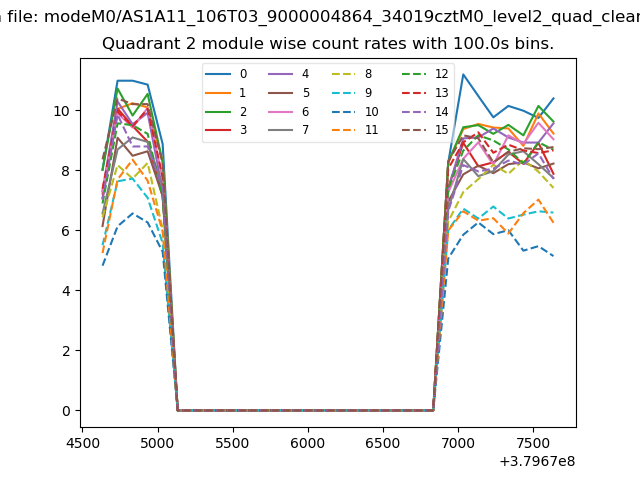
| Module-wise count rates for Quadrant B Data is divided into 100 sec bins |
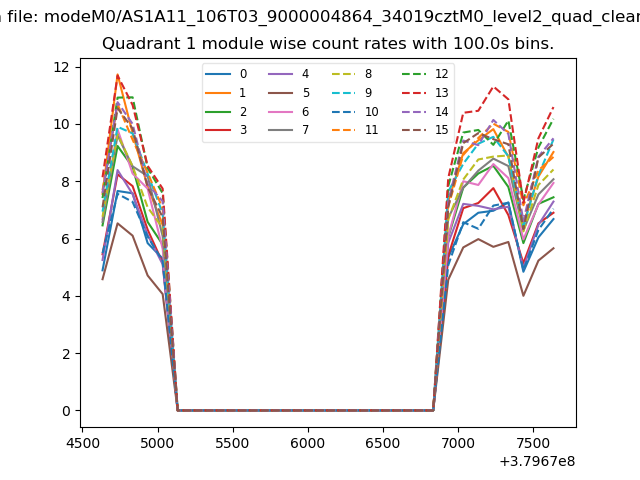 |
 |
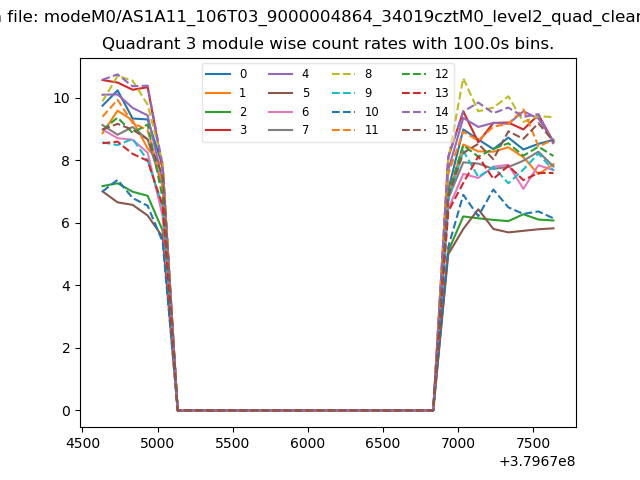
| Module-wise count rates for Quadrant C Data is divided into 100 sec bins |
 |
 |
| Module-wise count rates for Quadrant D Data is divided into 100 sec bins |
 |
 |
| Parameter | Plot |
|---|---|
| CZT HV Monitor |  |
| D_VDD | 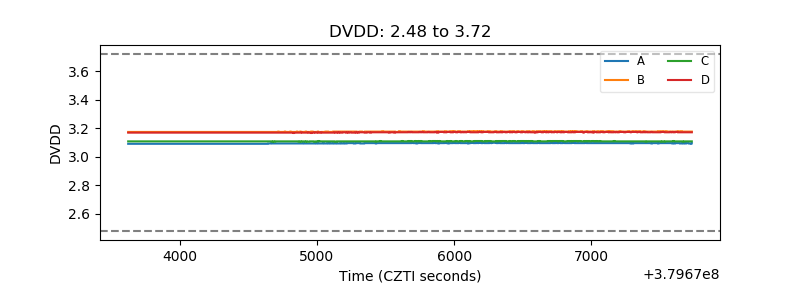 |
| Temperature 1 |  |
| Veto HV Monitor | 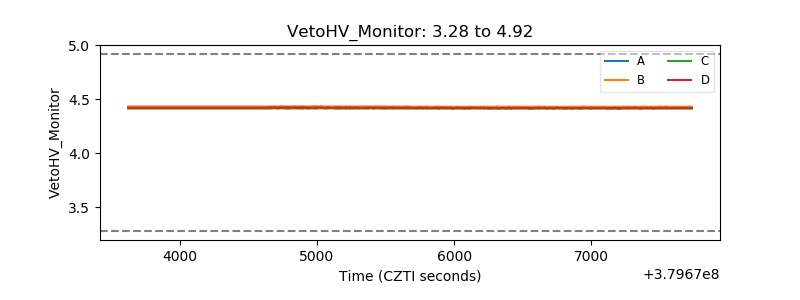 |
| Veto LLD | 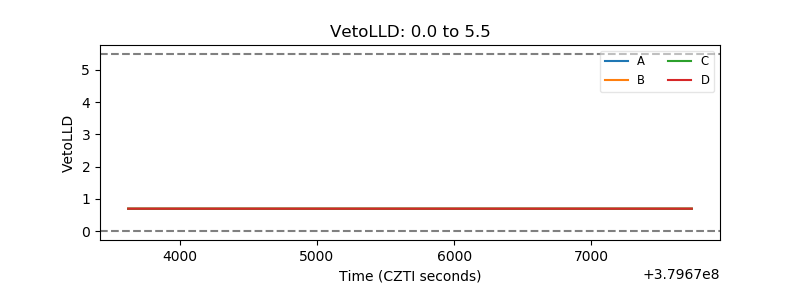 |
| Alpha Counter | 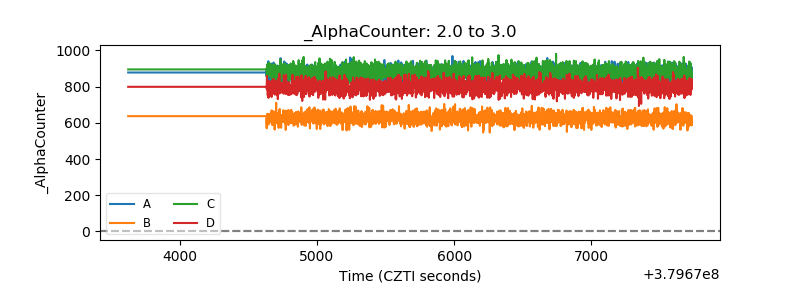 |
| _CPM_Rate | 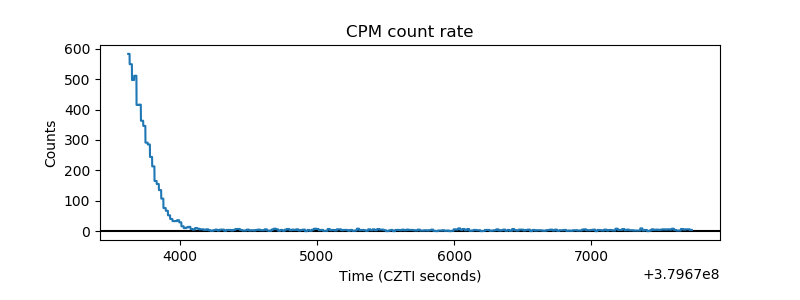 |
| CZT Counter | 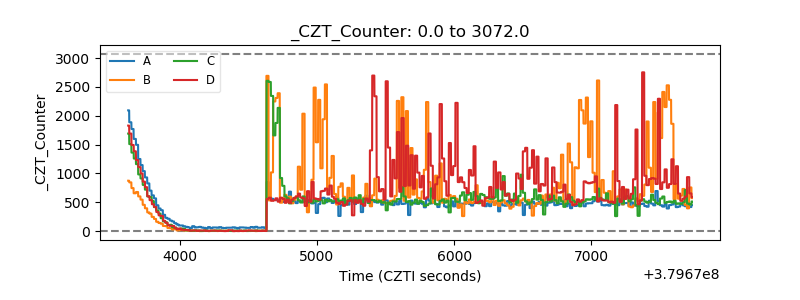 |
| +2.5 Volts monitor |  |
| +5 Volts monitor | 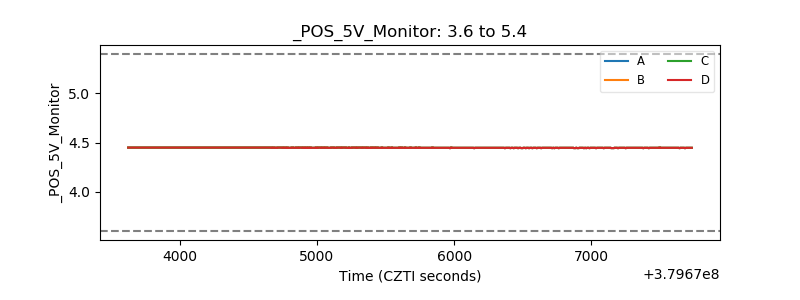 |
| _ROLL_ROT | 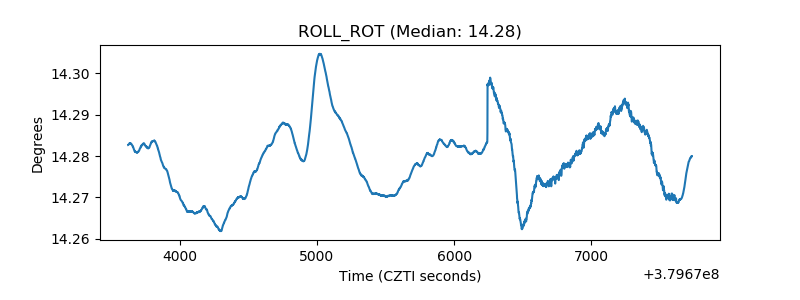 |
| _Roll_DEC | 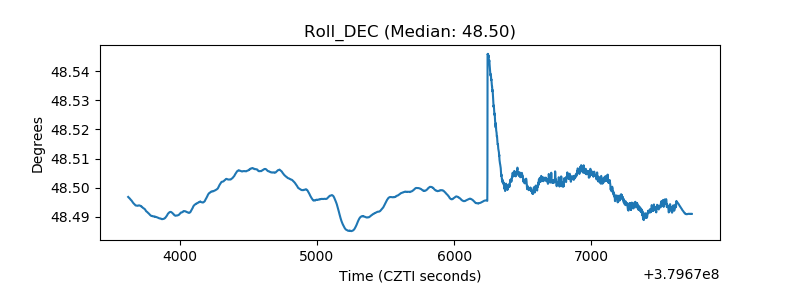 |
| _Roll_RA | 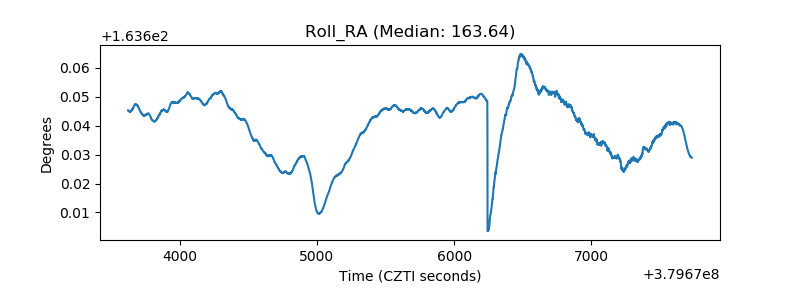 |
| Veto Counter | 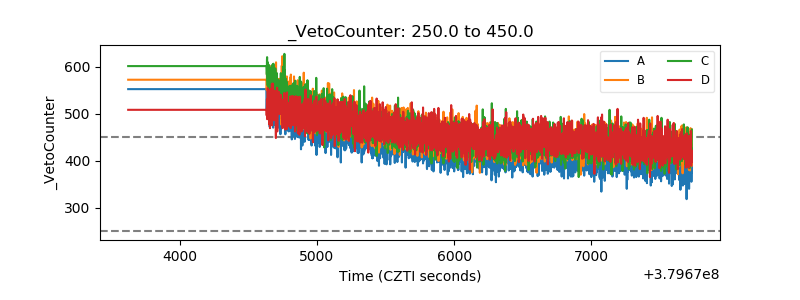 |