| Param | Original file | Final file |
|---|---|---|
| Filename | modeM0/AS1A06_003T04_9000004866_34020cztM0_level2.evt | modeM0/AS1A06_003T04_9000004866_34020cztM0_level2_quad_clean.evt |
| Size (bytes) | 615,150,720 | 83,033,280 |
| Size | 586.7 MB | 79.2 MB |
| Events in quadrant A | 2,496,433 | 578,661 |
| Events in quadrant B | 6,469,638 | 521,361 |
| Events in quadrant C | 3,258,852 | 555,137 |
| Events in quadrant D | 6,043,389 | 484,359 |
| Mode M9 | |||
|---|---|---|---|
| Quadrant | BADHDUFLAG | Total packets | Discarded packets |
| A | 0 | 31 | 0 |
| B | 0 | 31 | 0 |
| C | 0 | 31 | 0 |
| D | 0 | 32 | 0 |
| Mode M0 | |||
|---|---|---|---|
| Quadrant | BADHDUFLAG | Total packets | Discarded packets |
| A | 0 | 10778 | 3 |
| B | 0 | 22787 | 2 |
| C | 0 | 12859 | 2 |
| D | 0 | 21612 | 2 |
| Mode SS | |||
|---|---|---|---|
| Quadrant | BADHDUFLAG | Total packets | Discarded packets |
| A | 0 | 108 | 0 |
| B | 0 | 108 | 0 |
| C | 0 | 108 | 0 |
| D | 0 | 108 | 0 |
| Quadrant | Total seconds | Saturated seconds | Saturation percentage |
|---|---|---|---|
| A | 5349 | 6 | 0.112170% |
| B | 5349 | 1309 | 24.471864% |
| C | 5349 | 93 | 1.738643% |
| D | 5349 | 914 | 17.087306% |
Noise dominated data is calculated using 1-second bins in cleaned event files. If a bin has >2000 counts, and if more than 50% of those come from <1% of pixels, then it is considered to be noise-dominated and hence unusable.
| Quadrant | # 1 sec bins | Bins with >0 counts | Bins with >2000 counts | High rate bins dominated by noise | Noise dominated (total time) | Noise dominated (detector-on time) | Marked lightcurve |
|---|---|---|---|---|---|---|---|
| A | 7112 | 5350 | 0 | 0 | 0.00% | 0.00% | 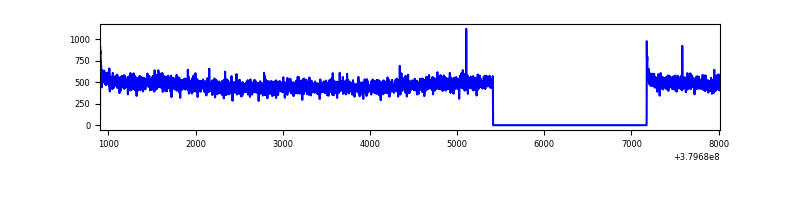 |
| B | 7112 | 5350 | 1089 | 1089 | 15.31% | 20.36% | 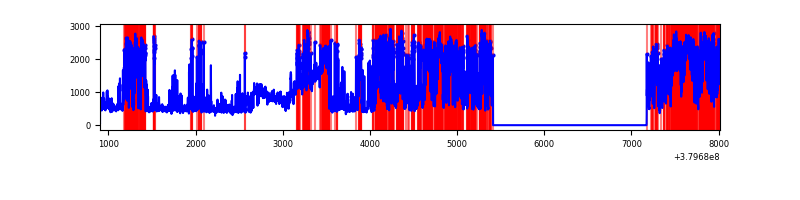 |
| C | 7112 | 5350 | 64 | 64 | 0.90% | 1.20% | 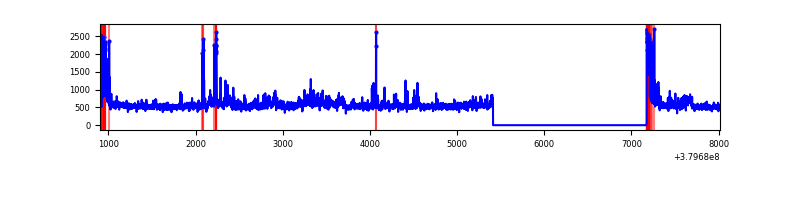 |
| D | 7112 | 5350 | 925 | 925 | 13.01% | 17.29% | 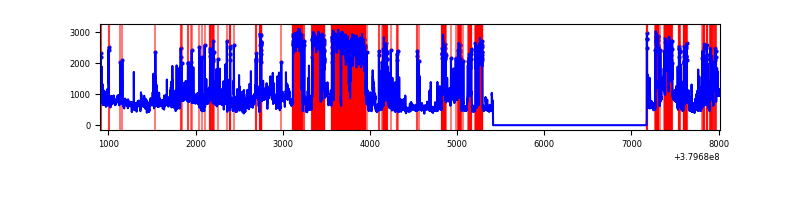 |
Top three noisy pixels from each quadrant. If the there are fewer than three noisy pixels in the level2.evt file, extra rows are filled as -1
| Pixel properties | Quadrant properties | ||||||
|---|---|---|---|---|---|---|---|
| Quadrant | DetID | PixID | Counts | Sigma | Mean | Median | Sigma |
| A | 10 | 83 | 17503 | 132.07 | 635 | 623 | 127.8 |
| A | 13 | 6 | 13718 | 102.46 | 635 | 623 | 127.8 |
| A | 13 | 254 | 10295 | 75.68 | 635 | 623 | 127.8 |
| B | 5 | 31 | 1425026 | 12931.63 | 574 | 560 | 110.2 |
| B | 5 | 172 | 1222064 | 11089.09 | 574 | 560 | 110.2 |
| B | 5 | 15 | 600446 | 5445.9 | 574 | 560 | 110.2 |
| C | 3 | 233 | 338701 | 2417.71 | 604 | 608 | 139.8 |
| C | 15 | 214 | 253226 | 1806.48 | 604 | 608 | 139.8 |
| C | 0 | 10 | 240565 | 1715.94 | 604 | 608 | 139.8 |
| D | 8 | 230 | 1754223 | 11457.39 | 562 | 553 | 153.1 |
| D | 8 | 195 | 1041860 | 6803.25 | 562 | 553 | 153.1 |
| D | 13 | 249 | 332614 | 2169.48 | 562 | 553 | 153.1 |
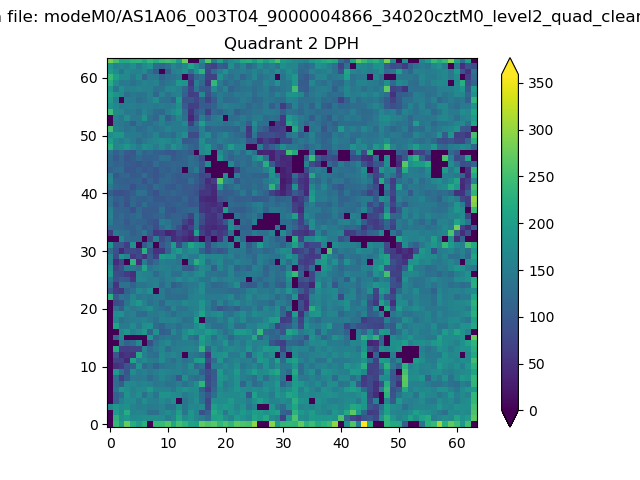
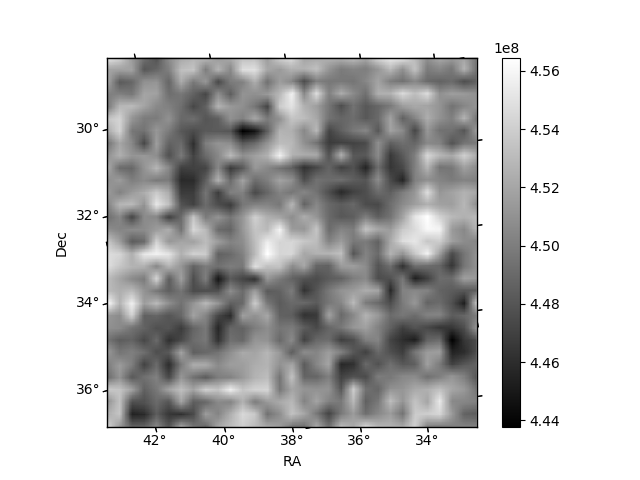
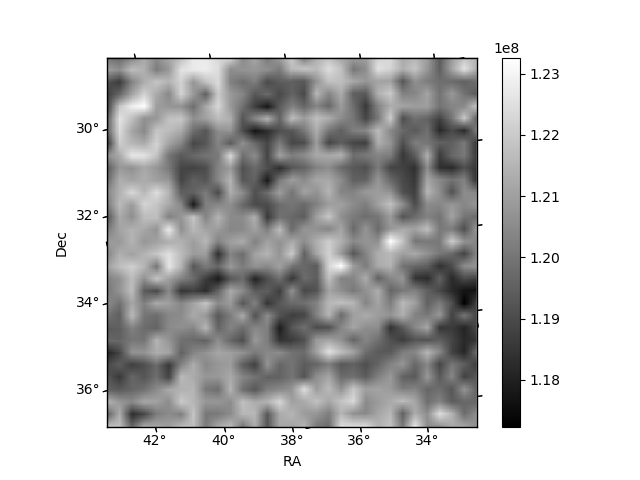
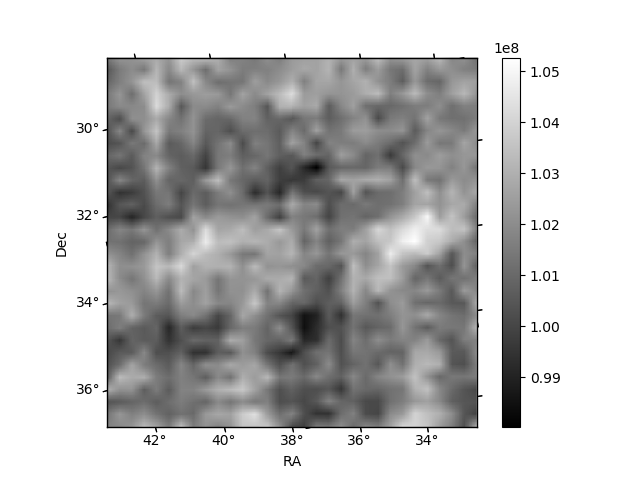
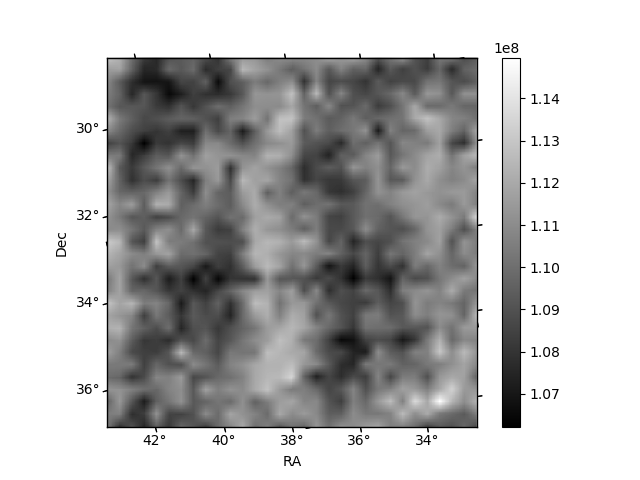
Histogram calculated using DETX and DETY for each event in the final _common_clean file
| Quadrant A | 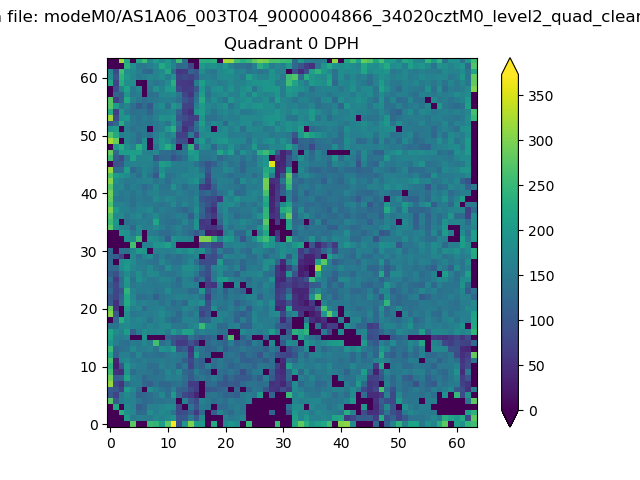 |
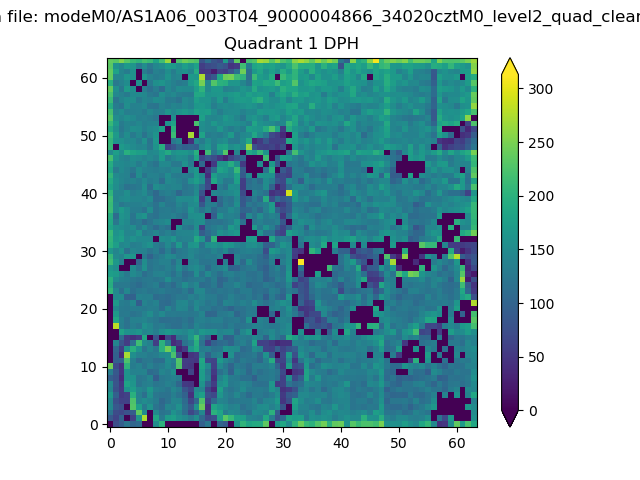 |
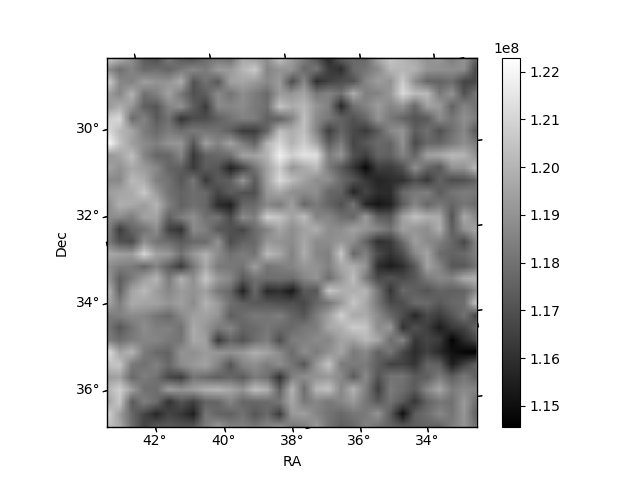
Quadrant B |
|---|---|---|---|
| Quadrant D | 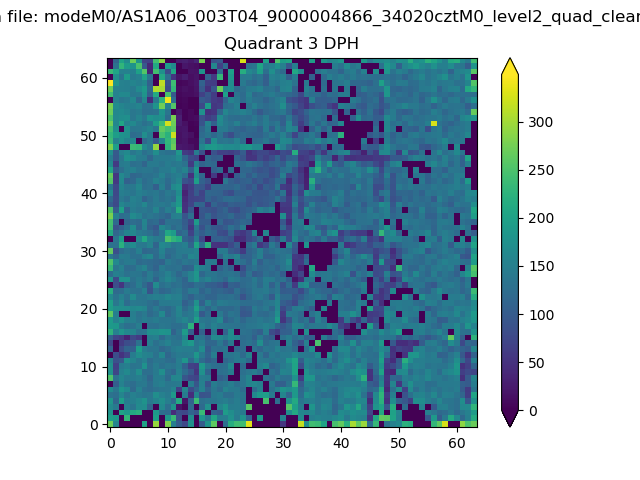 |
 |
Quadrant C |
| Plot type | Count rate plots | Images |
|---|---|---|
| Comparison with Poisson distribution Blue bars denote a histogram of data divided into 1 sec bins. Red curve is a Poisson curve with rate = median count rate of data. |
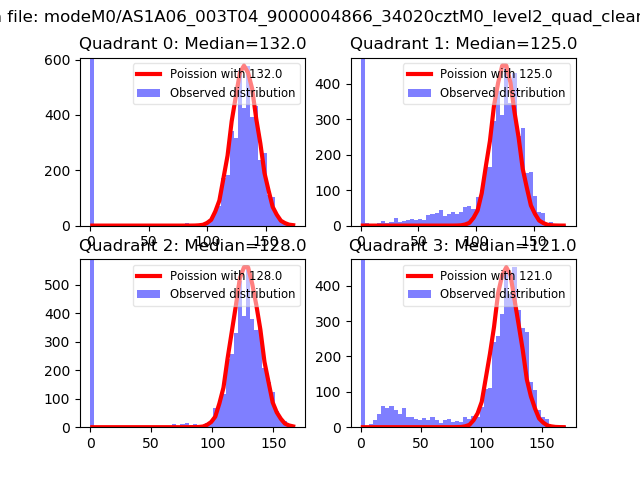 |
 |
| Quadrant-wise count rates Data is divided into 100 sec bins |
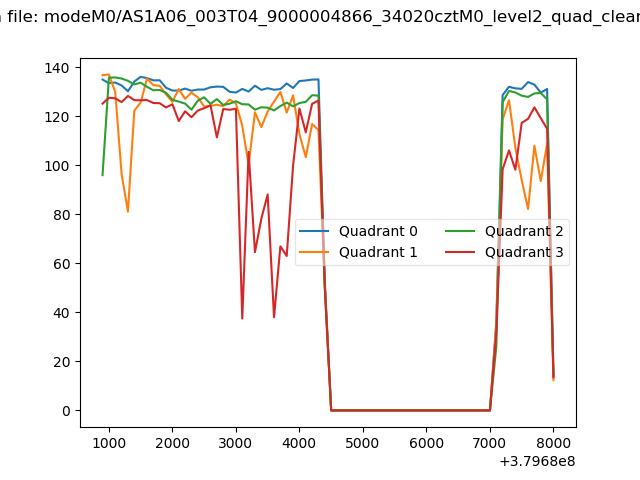 |
|
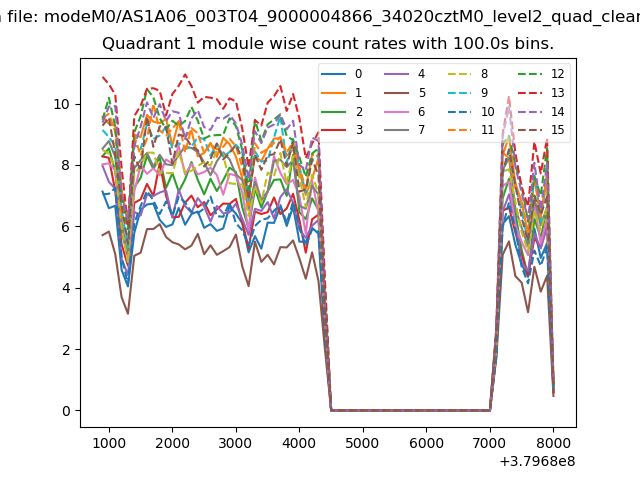
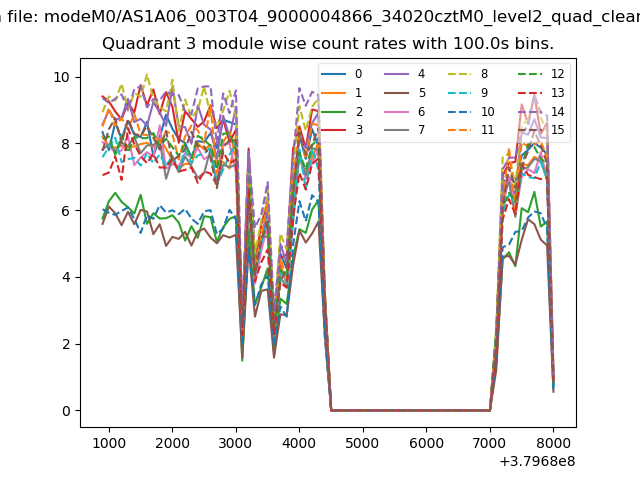
| Module-wise count rates for Quadrant A Data is divided into 100 sec bins |
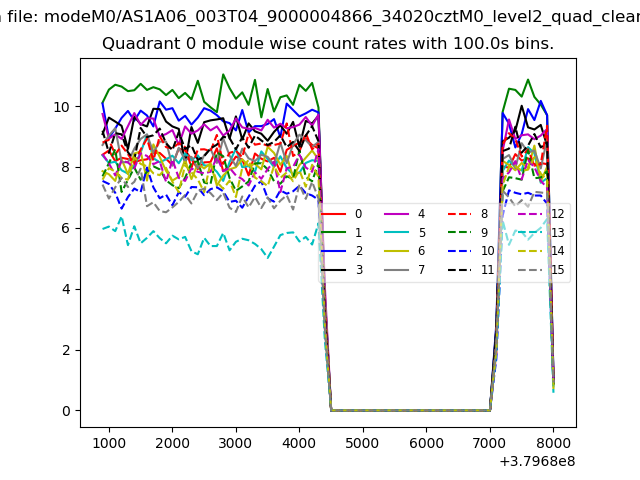 |
 |
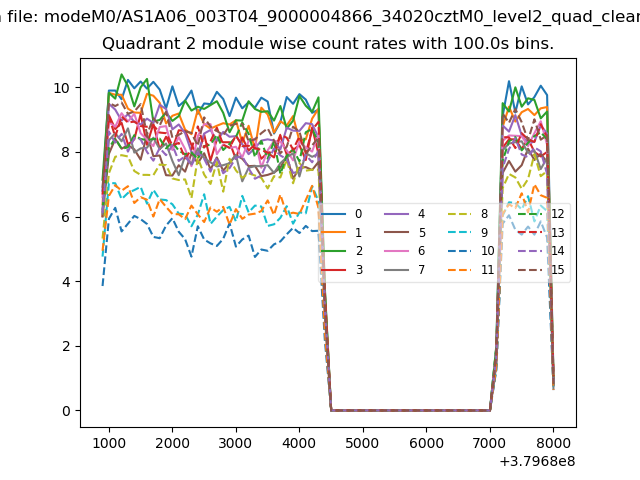
| Module-wise count rates for Quadrant B Data is divided into 100 sec bins |
 |
 |
| Module-wise count rates for Quadrant C Data is divided into 100 sec bins |
 |
 |
| Module-wise count rates for Quadrant D Data is divided into 100 sec bins |
 |
 |
| Parameter | Plot |
|---|---|
| CZT HV Monitor | 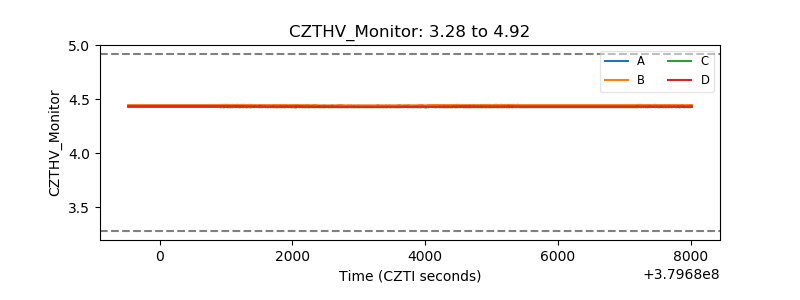 |
| D_VDD | 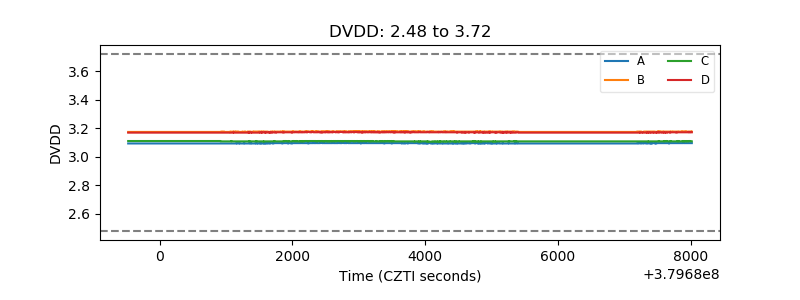 |
| Temperature 1 | 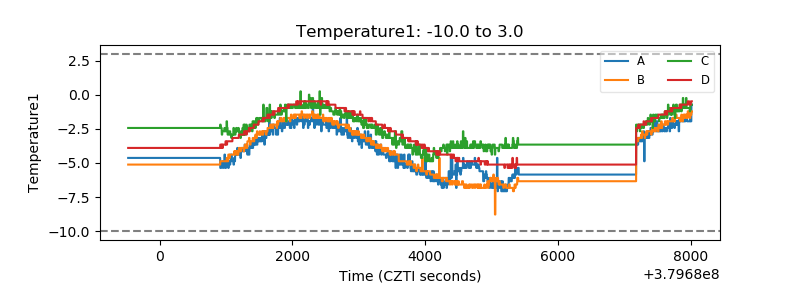 |
| Veto HV Monitor | 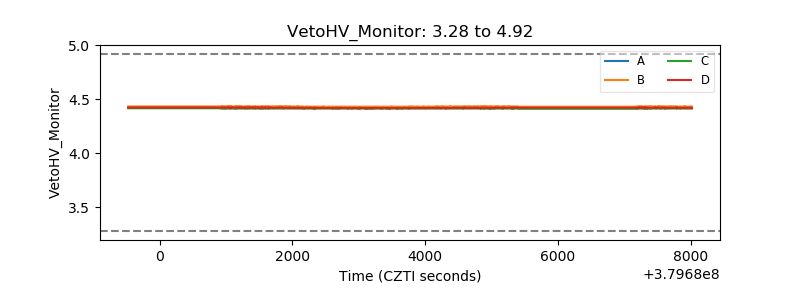 |
| Veto LLD | 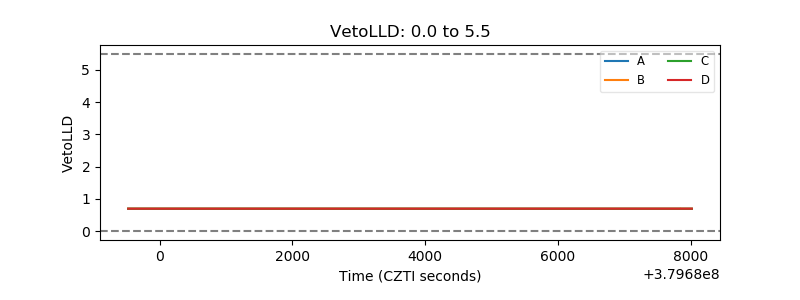 |
| Alpha Counter | 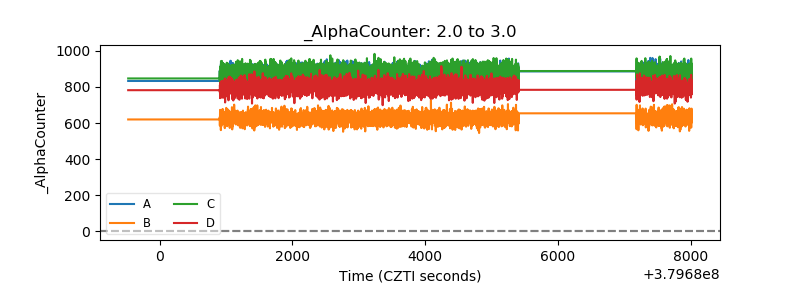 |
| _CPM_Rate | 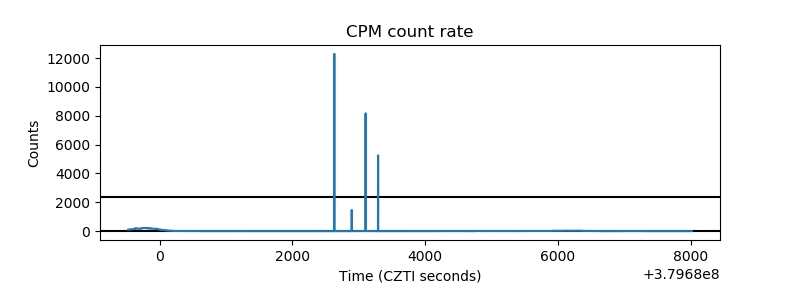 |
| CZT Counter | 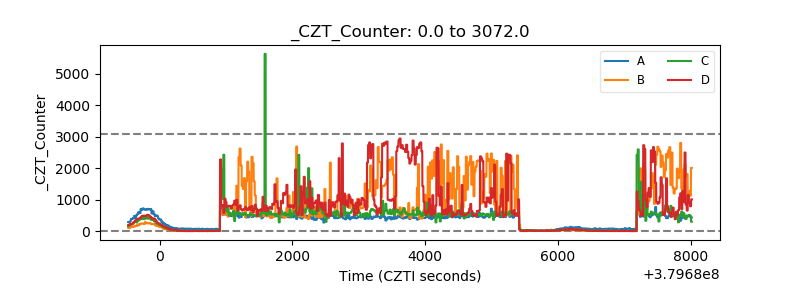 |
| +2.5 Volts monitor |  |
| +5 Volts monitor |  |
| _ROLL_ROT | 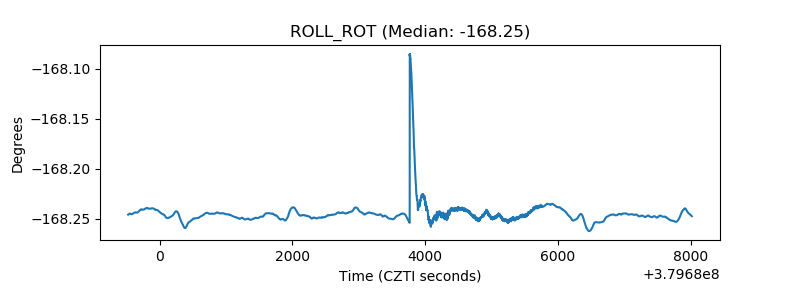 |
| _Roll_DEC | 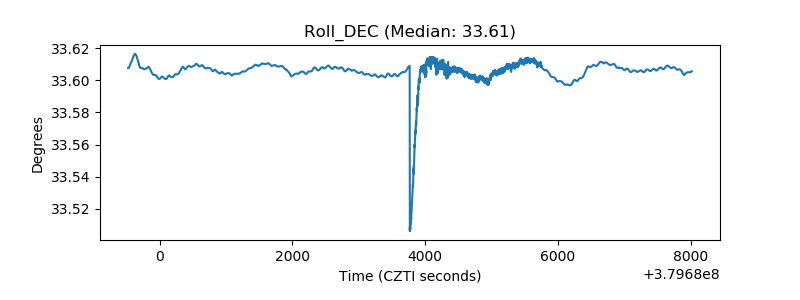 |
| _Roll_RA | 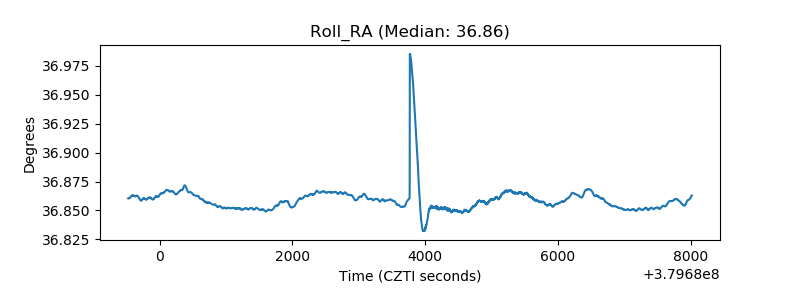 |
| Veto Counter | 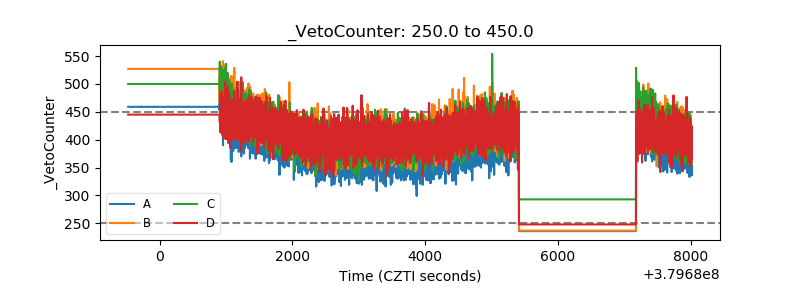 |