| Param | Original file | Final file |
|---|---|---|
| Filename | modeM0/AS1A06_003T04_9000004866_34021cztM0_level2.evt | modeM0/AS1A06_003T04_9000004866_34021cztM0_level2_quad_clean.evt |
| Size (bytes) | 751,178,880 | 72,748,800 |
| Size | 716.4 MB | 69.4 MB |
| Events in quadrant A | 2,635,202 | 510,219 |
| Events in quadrant B | 9,026,960 | 402,748 |
| Events in quadrant C | 3,271,799 | 490,683 |
| Events in quadrant D | 7,431,635 | 400,295 |
| Mode M9 | |||
|---|---|---|---|
| Quadrant | BADHDUFLAG | Total packets | Discarded packets |
| A | 0 | 16 | 0 |
| B | 0 | 16 | 0 |
| C | 0 | 16 | 0 |
| D | 0 | 17 | 0 |
| Mode M0 | |||
|---|---|---|---|
| Quadrant | BADHDUFLAG | Total packets | Discarded packets |
| A | 0 | 11479 | 3 |
| B | 0 | 30708 | 2 |
| C | 0 | 12981 | 2 |
| D | 0 | 25978 | 2 |
| Mode SS | |||
|---|---|---|---|
| Quadrant | BADHDUFLAG | Total packets | Discarded packets |
| A | 0 | 114 | 0 |
| B | 0 | 114 | 0 |
| C | 0 | 114 | 0 |
| D | 0 | 114 | 0 |
| Quadrant | Total seconds | Saturated seconds | Saturation percentage |
|---|---|---|---|
| A | 5691 | 5 | 0.087858% |
| B | 5691 | 2562 | 45.018450% |
| C | 5691 | 55 | 0.966438% |
| D | 5691 | 1377 | 24.196099% |
Noise dominated data is calculated using 1-second bins in cleaned event files. If a bin has >2000 counts, and if more than 50% of those come from <1% of pixels, then it is considered to be noise-dominated and hence unusable.
| Quadrant | # 1 sec bins | Bins with >0 counts | Bins with >2000 counts | High rate bins dominated by noise | Noise dominated (total time) | Noise dominated (detector-on time) | Marked lightcurve |
|---|---|---|---|---|---|---|---|
| A | 7125 | 5693 | 0 | 0 | 0.00% | 0.00% | 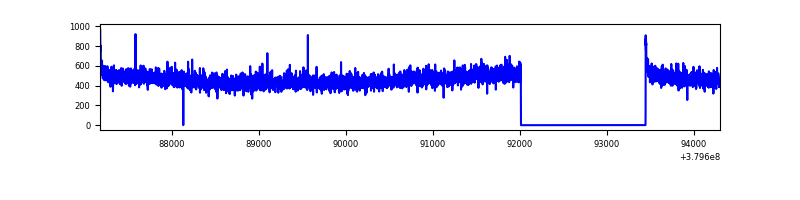 |
| B | 7125 | 5692 | 2313 | 2313 | 32.46% | 40.64% | 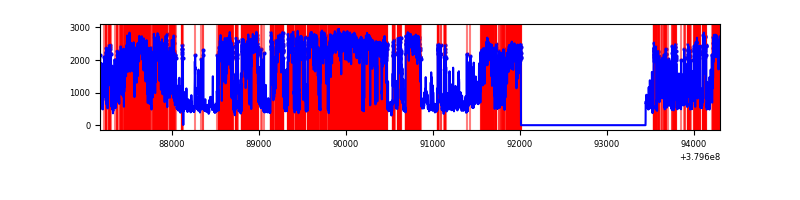 |
| C | 7125 | 5692 | 44 | 44 | 0.62% | 0.77% | 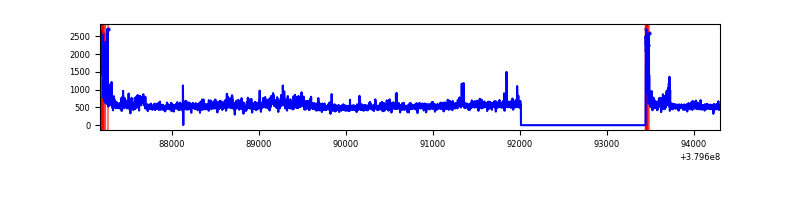 |
| D | 7125 | 5693 | 1373 | 1373 | 19.27% | 24.12% | 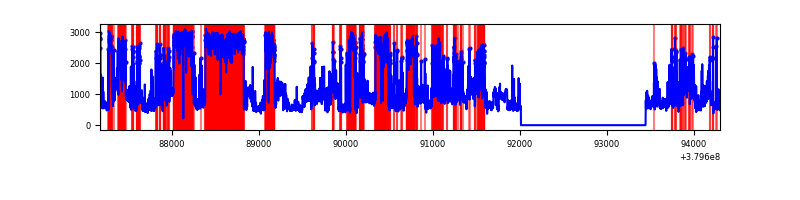 |
Top three noisy pixels from each quadrant. If the there are fewer than three noisy pixels in the level2.evt file, extra rows are filled as -1
| Pixel properties | Quadrant properties | ||||||
|---|---|---|---|---|---|---|---|
| Quadrant | DetID | PixID | Counts | Sigma | Mean | Median | Sigma |
| A | 15 | 169 | 31714 | 233.16 | 665 | 651 | 133.2 |
| A | 10 | 83 | 18332 | 132.72 | 665 | 651 | 133.2 |
| A | 13 | 6 | 11798 | 83.67 | 665 | 651 | 133.2 |
| B | 5 | 31 | 3062672 | 29084.58 | 551 | 537 | 105.3 |
| B | 5 | 15 | 2083810 | 19787.21 | 551 | 537 | 105.3 |
| B | 5 | 14 | 707889 | 6718.53 | 551 | 537 | 105.3 |
| C | 15 | 214 | 268557 | 1797.81 | 642 | 648 | 149.0 |
| C | 0 | 10 | 210061 | 1405.27 | 642 | 648 | 149.0 |
| C | 3 | 233 | 174770 | 1168.45 | 642 | 648 | 149.0 |
| D | 8 | 230 | 2689163 | 17220.27 | 568 | 556 | 156.1 |
| D | 8 | 195 | 1352207 | 8657.19 | 568 | 556 | 156.1 |
| D | 13 | 249 | 361883 | 2314.26 | 568 | 556 | 156.1 |
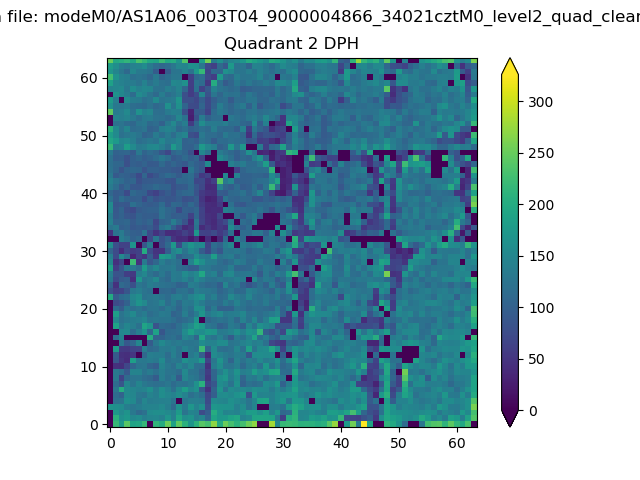
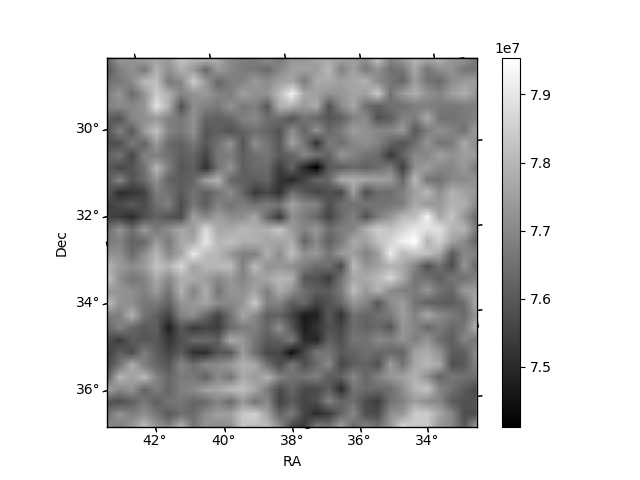
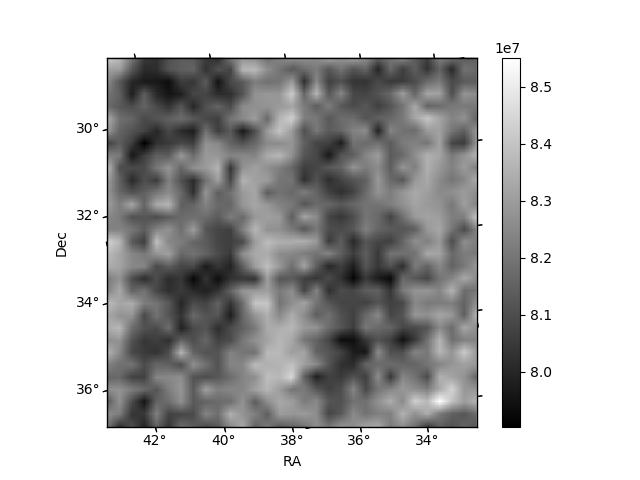
Histogram calculated using DETX and DETY for each event in the final _common_clean file
| Quadrant A |  |
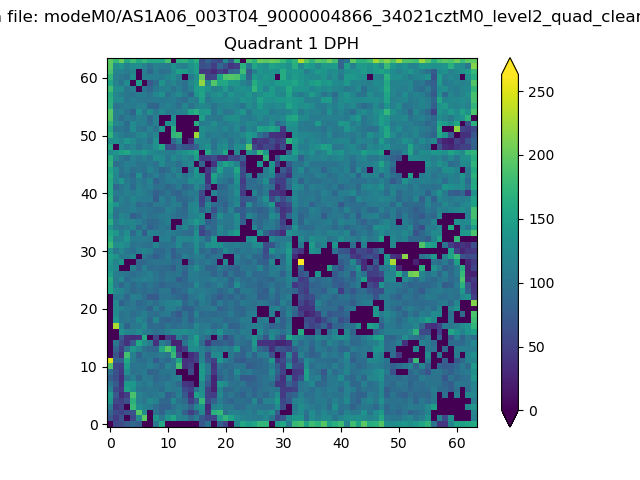 |
Quadrant B |
|---|---|---|---|
| Quadrant D | 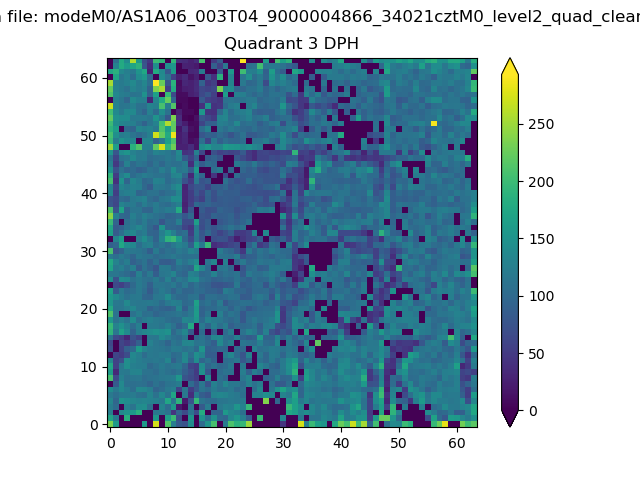 |
 |
Quadrant C |
| Plot type | Count rate plots | Images |
|---|---|---|
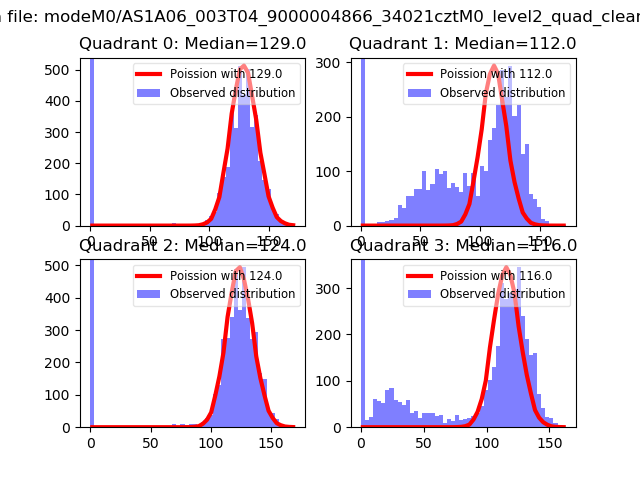
| Comparison with Poisson distribution Blue bars denote a histogram of data divided into 1 sec bins. Red curve is a Poisson curve with rate = median count rate of data. |
 |
 |
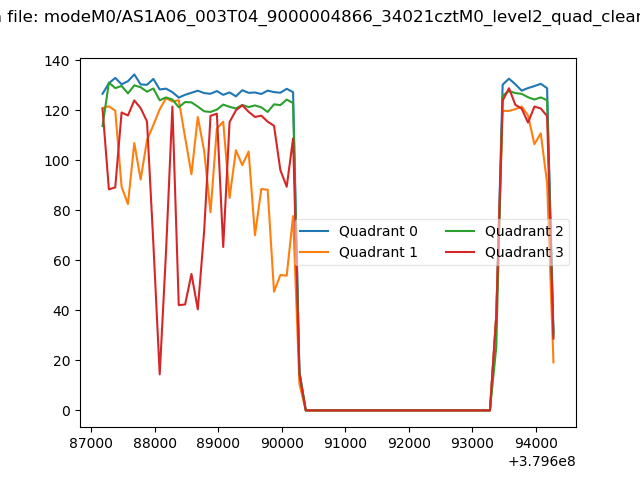
| Quadrant-wise count rates Data is divided into 100 sec bins |
 |
|
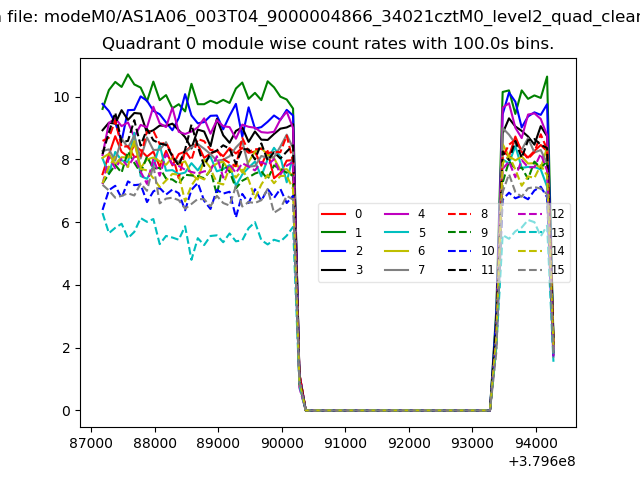
| Module-wise count rates for Quadrant A Data is divided into 100 sec bins |
 |
 |
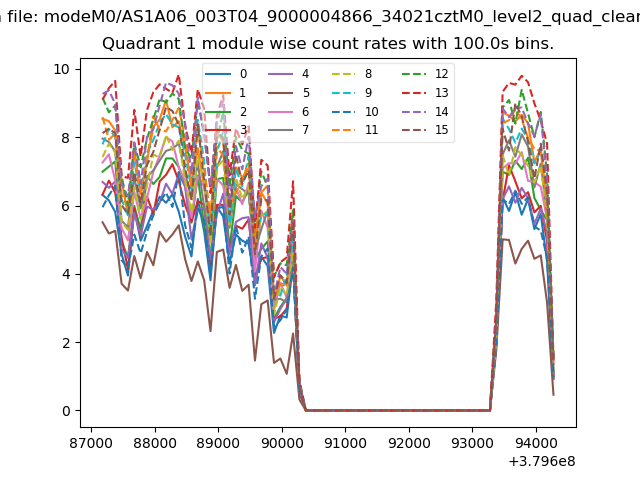
| Module-wise count rates for Quadrant B Data is divided into 100 sec bins |
 |
 |
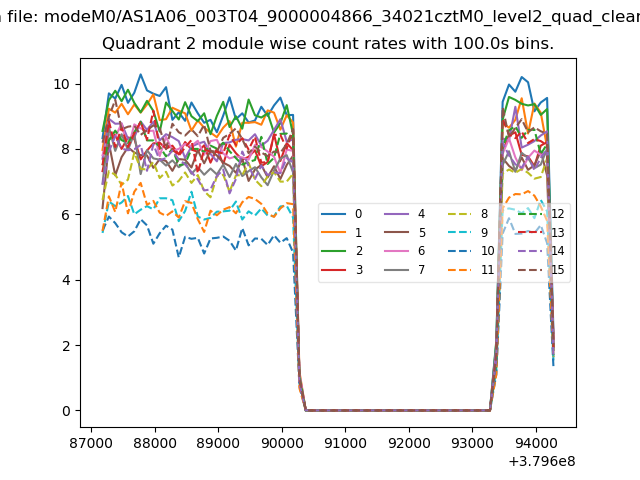
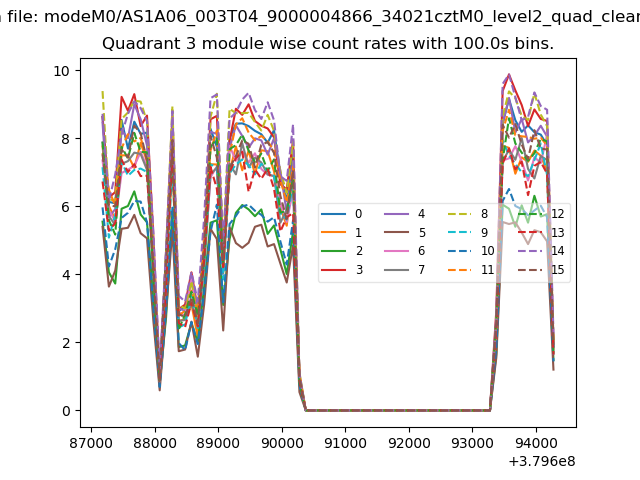
| Module-wise count rates for Quadrant C Data is divided into 100 sec bins |
 |
 |
| Module-wise count rates for Quadrant D Data is divided into 100 sec bins |
 |
 |
| Parameter | Plot |
|---|---|
| CZT HV Monitor | 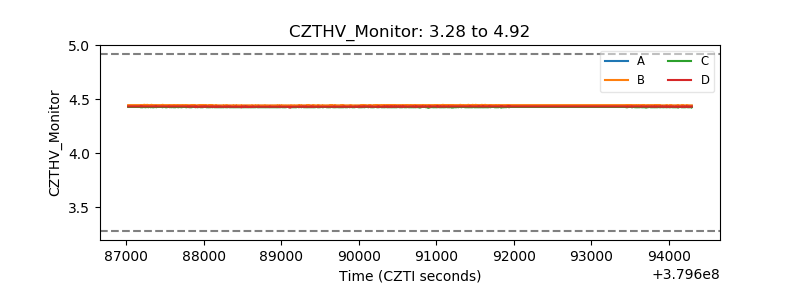 |
| D_VDD | 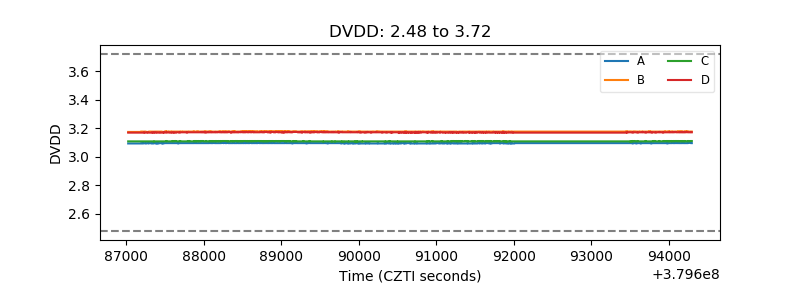 |
| Temperature 1 | 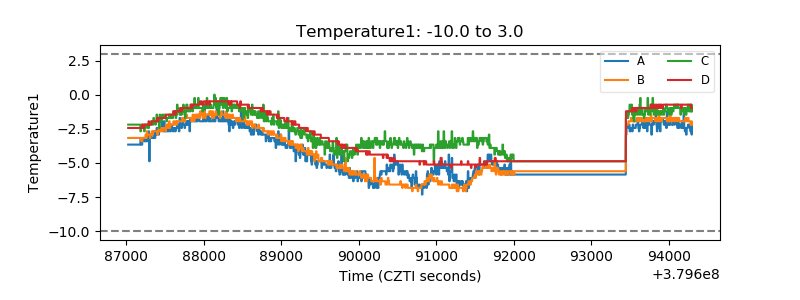 |
| Veto HV Monitor | 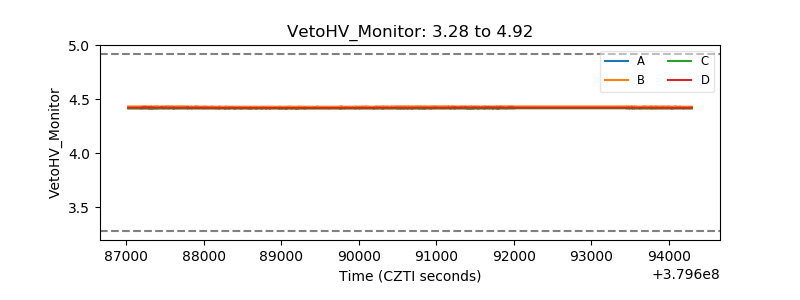 |
| Veto LLD | 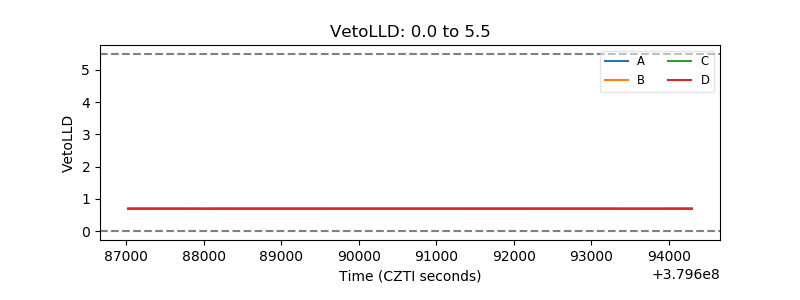 |
| Alpha Counter | 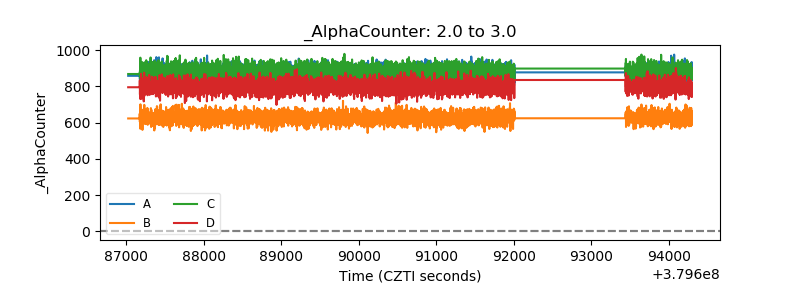 |
| _CPM_Rate | 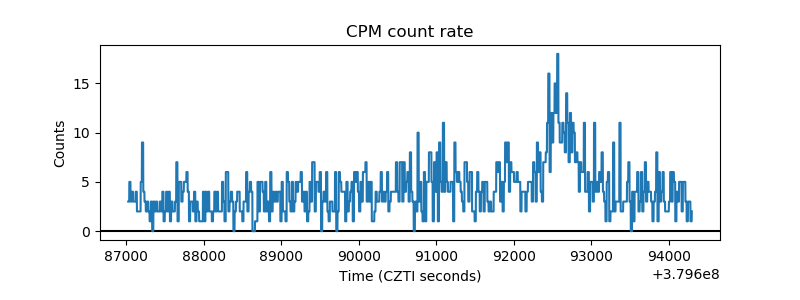 |
| CZT Counter | 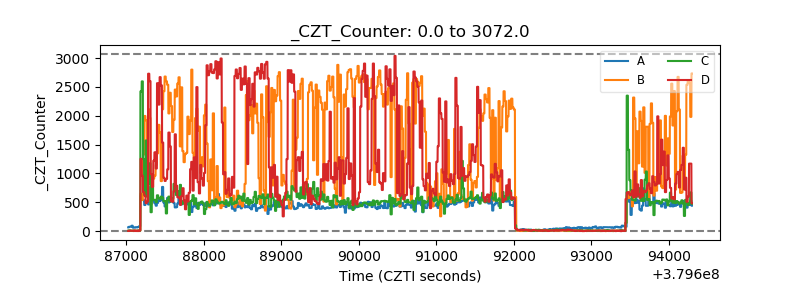 |
| +2.5 Volts monitor |  |
| +5 Volts monitor |  |
| _ROLL_ROT | 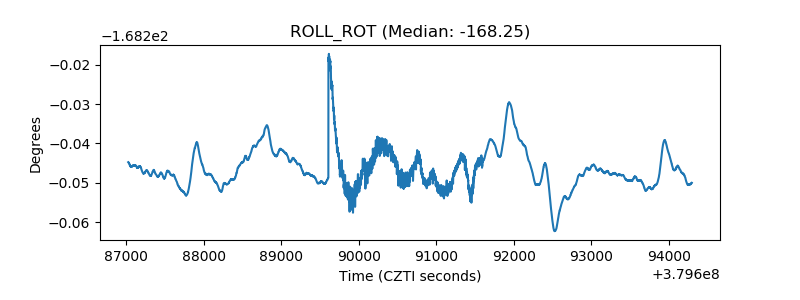 |
| _Roll_DEC | 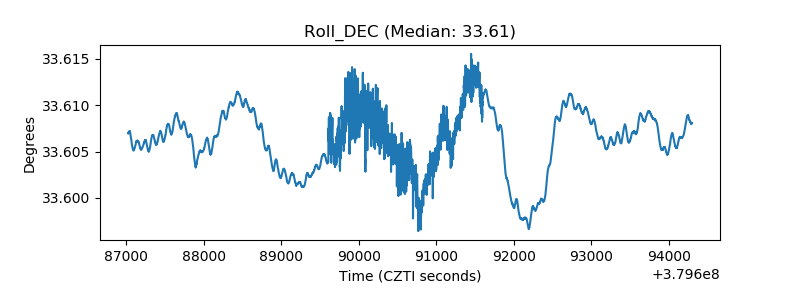 |
| _Roll_RA | 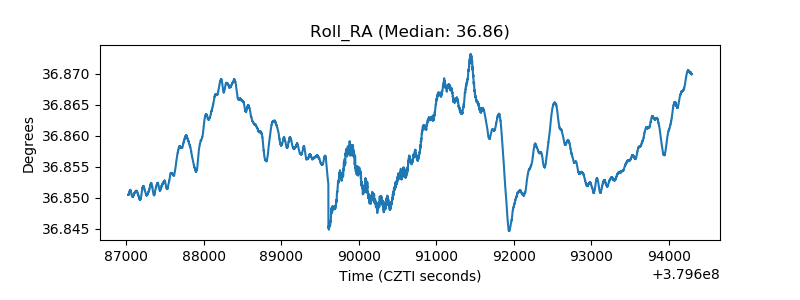 |
| Veto Counter | 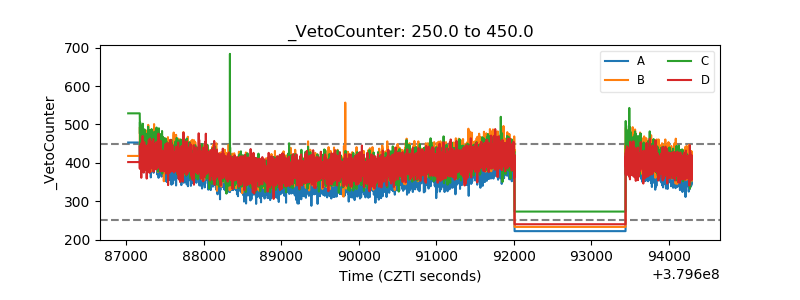 |