| Param | Original file | Final file |
|---|---|---|
| Filename | modeM0/AS1A06_003T04_9000004866_34022cztM0_level2.evt | modeM0/AS1A06_003T04_9000004866_34022cztM0_level2_quad_clean.evt |
| Size (bytes) | 705,136,320 | 70,338,240 |
| Size | 672.5 MB | 67.1 MB |
| Events in quadrant A | 2,756,368 | 480,815 |
| Events in quadrant B | 8,840,575 | 342,392 |
| Events in quadrant C | 3,437,195 | 462,339 |
| Events in quadrant D | 5,920,199 | 428,858 |
| Mode M9 | |||
|---|---|---|---|
| Quadrant | BADHDUFLAG | Total packets | Discarded packets |
| A | 0 | 16 | 0 |
| B | 0 | 16 | 0 |
| C | 0 | 16 | 0 |
| D | 0 | 17 | 0 |
| Mode M0 | |||
|---|---|---|---|
| Quadrant | BADHDUFLAG | Total packets | Discarded packets |
| A | 0 | 12017 | 3 |
| B | 0 | 30305 | 2 |
| C | 0 | 13653 | 2 |
| D | 0 | 21786 | 2 |
| Mode SS | |||
|---|---|---|---|
| Quadrant | BADHDUFLAG | Total packets | Discarded packets |
| A | 0 | 120 | 0 |
| B | 0 | 120 | 0 |
| C | 0 | 120 | 0 |
| D | 0 | 120 | 0 |
| Quadrant | Total seconds | Saturated seconds | Saturation percentage |
|---|---|---|---|
| A | 5931 | 9 | 0.151745% |
| B | 5931 | 2469 | 41.628730% |
| C | 5931 | 49 | 0.826168% |
| D | 5931 | 815 | 13.741359% |
Noise dominated data is calculated using 1-second bins in cleaned event files. If a bin has >2000 counts, and if more than 50% of those come from <1% of pixels, then it is considered to be noise-dominated and hence unusable.
| Quadrant | # 1 sec bins | Bins with >0 counts | Bins with >2000 counts | High rate bins dominated by noise | Noise dominated (total time) | Noise dominated (detector-on time) | Marked lightcurve |
|---|---|---|---|---|---|---|---|
| A | 7243 | 5931 | 0 | 0 | 0.00% | 0.00% |  |
| B | 7242 | 5930 | 2333 | 2333 | 32.21% | 39.34% | 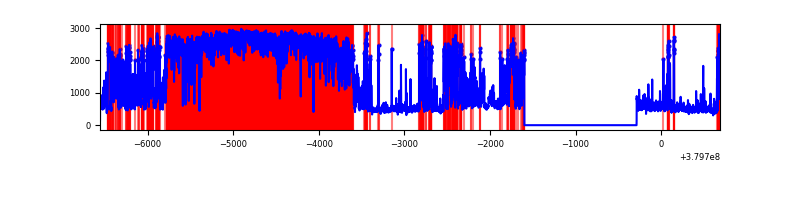 |
| C | 7242 | 5930 | 38 | 38 | 0.52% | 0.64% | 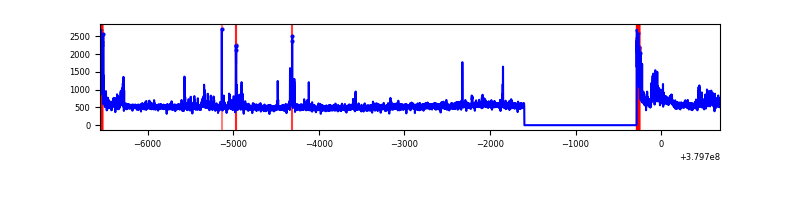 |
| D | 7243 | 5931 | 766 | 766 | 10.58% | 12.92% | 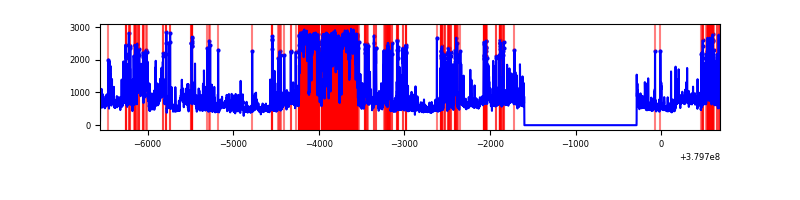 |
Top three noisy pixels from each quadrant. If the there are fewer than three noisy pixels in the level2.evt file, extra rows are filled as -1
| Pixel properties | Quadrant properties | ||||||
|---|---|---|---|---|---|---|---|
| Quadrant | DetID | PixID | Counts | Sigma | Mean | Median | Sigma |
| A | 15 | 169 | 56862 | 408.33 | 689 | 677 | 137.6 |
| A | 10 | 83 | 18710 | 131.06 | 689 | 677 | 137.6 |
| A | 13 | 6 | 12758 | 87.8 | 689 | 677 | 137.6 |
| B | 5 | 31 | 2618549 | 23833.37 | 565 | 550 | 109.8 |
| B | 5 | 15 | 1882008 | 17128.16 | 565 | 550 | 109.8 |
| B | 5 | 172 | 1261310 | 11477.53 | 565 | 550 | 109.8 |
| C | 3 | 233 | 311192 | 2018.11 | 665 | 670 | 153.9 |
| C | 15 | 214 | 276424 | 1792.15 | 665 | 670 | 153.9 |
| C | 0 | 10 | 164859 | 1067.08 | 665 | 670 | 153.9 |
| D | 12 | 233 | 1365446 | 8387.85 | 634 | 616 | 162.7 |
| D | 8 | 195 | 815301 | 5006.82 | 634 | 616 | 162.7 |
| D | 2 | 249 | 504641 | 3097.59 | 634 | 616 | 162.7 |
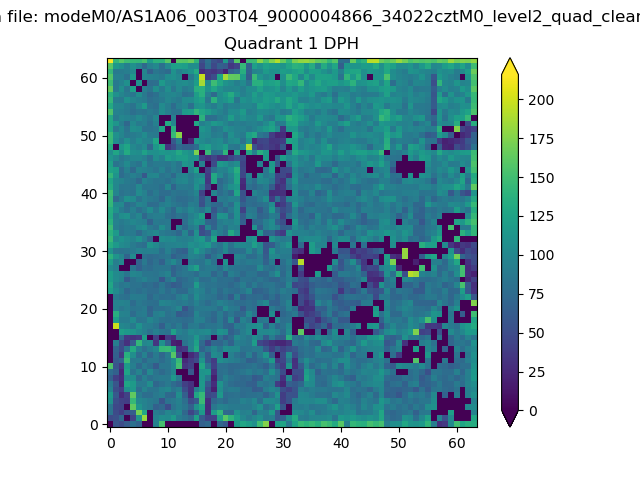
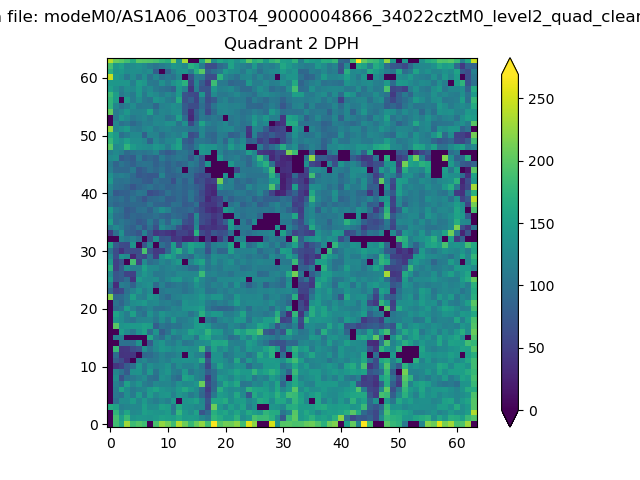
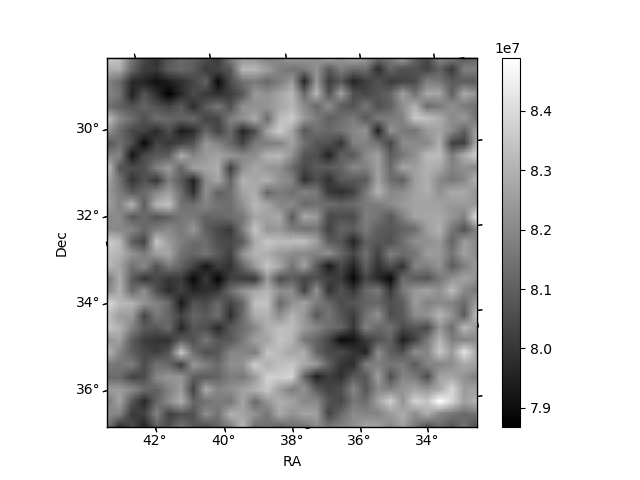
Histogram calculated using DETX and DETY for each event in the final _common_clean file
| Quadrant A | 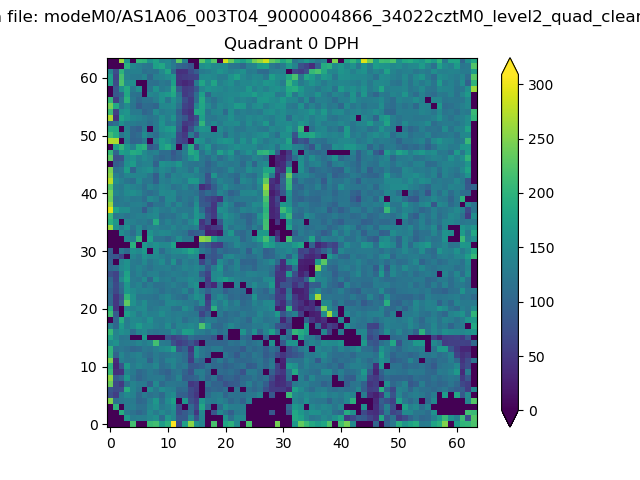 |
 |
Quadrant B |
|---|---|---|---|
| Quadrant D | 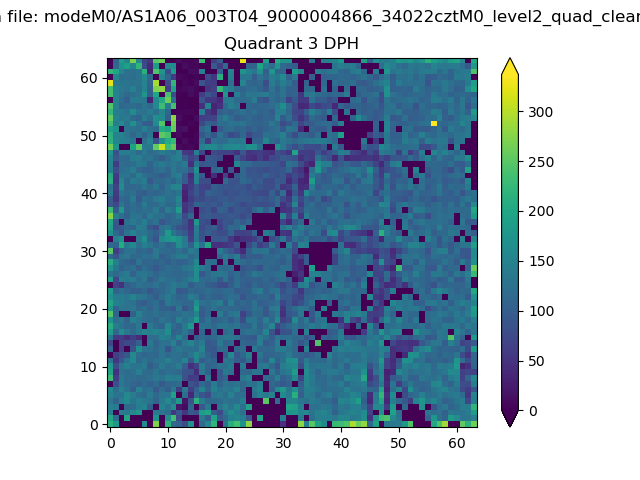 |
 |
Quadrant C |
| Plot type | Count rate plots | Images |
|---|---|---|
| Comparison with Poisson distribution Blue bars denote a histogram of data divided into 1 sec bins. Red curve is a Poisson curve with rate = median count rate of data. |
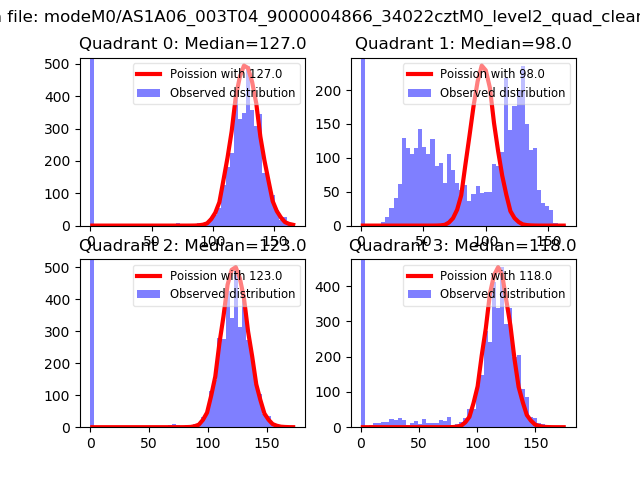 |
 |
| Quadrant-wise count rates Data is divided into 100 sec bins |
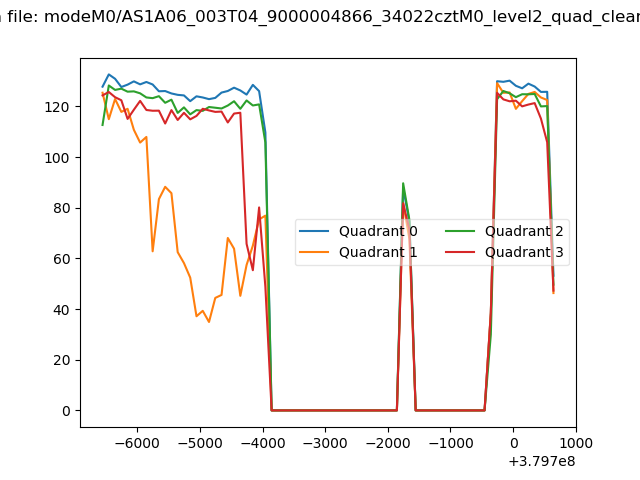 |
|
| Module-wise count rates for Quadrant A Data is divided into 100 sec bins |
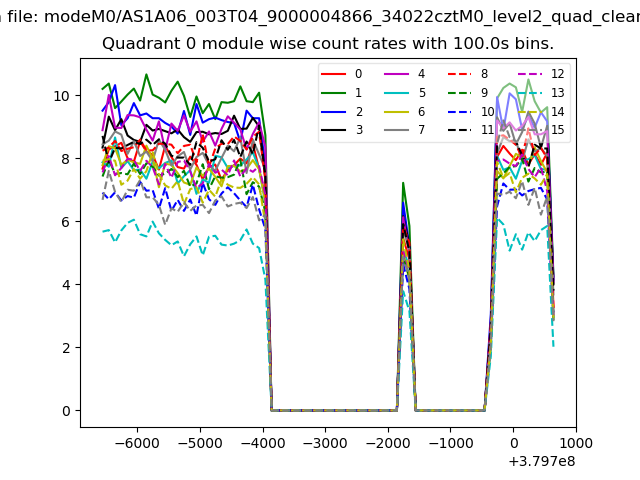 |
 |
| Module-wise count rates for Quadrant B Data is divided into 100 sec bins |
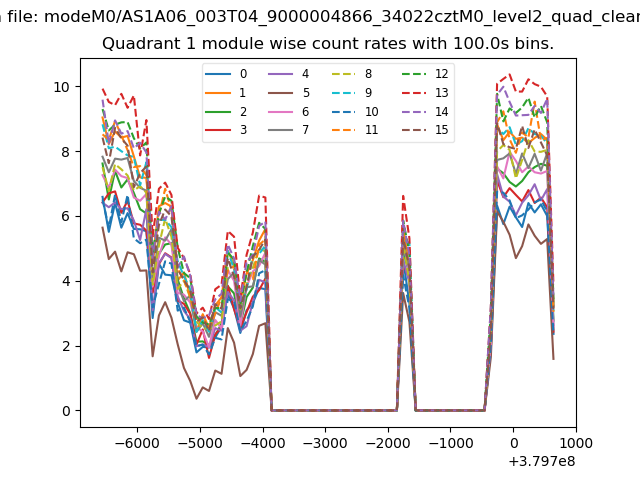 |
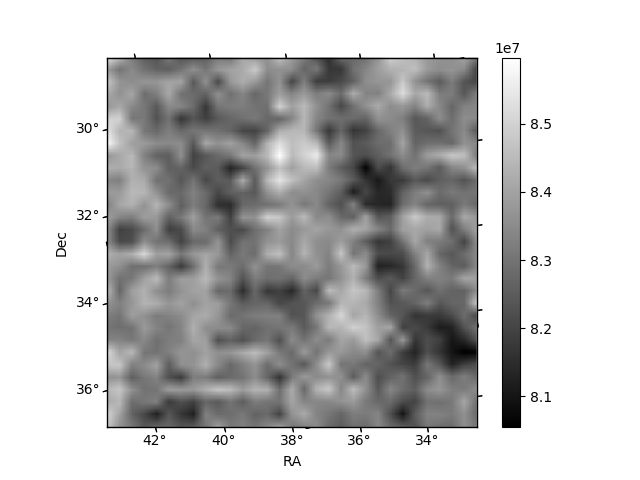 |
| Module-wise count rates for Quadrant C Data is divided into 100 sec bins |
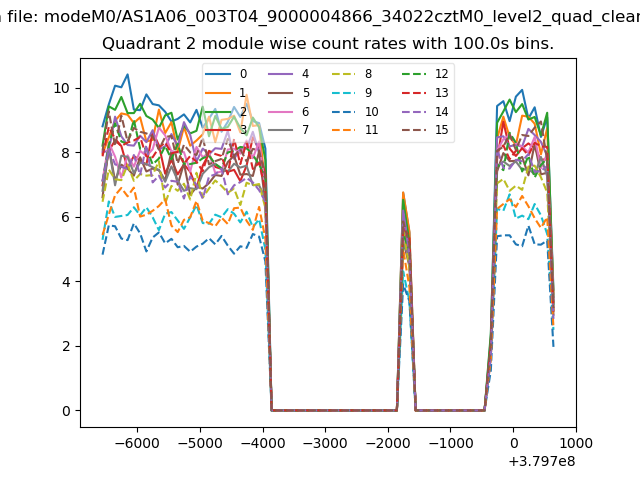 |
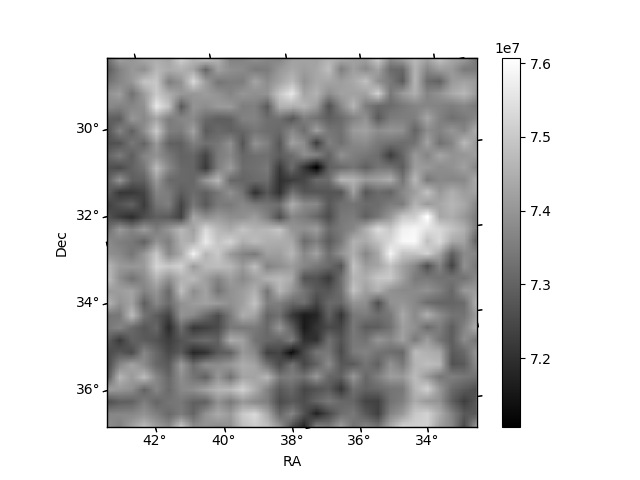 |
| Module-wise count rates for Quadrant D Data is divided into 100 sec bins |
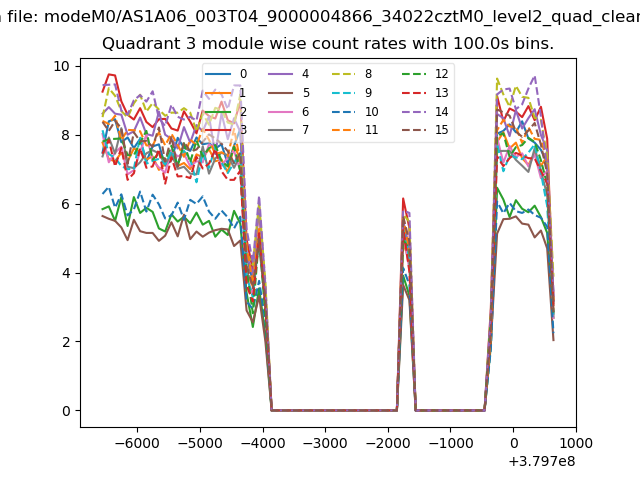 |
 |
| Parameter | Plot |
|---|---|
| CZT HV Monitor |  |
| D_VDD | 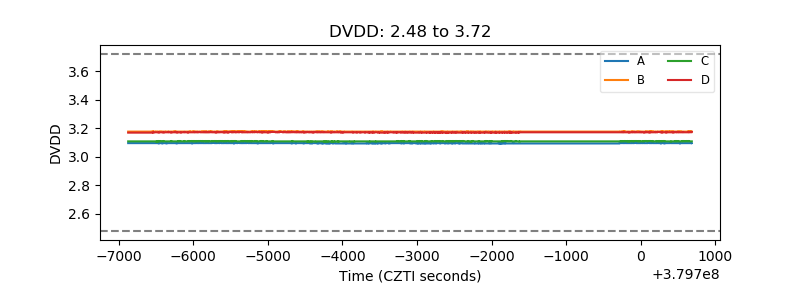 |
| Temperature 1 |  |
| Veto HV Monitor | 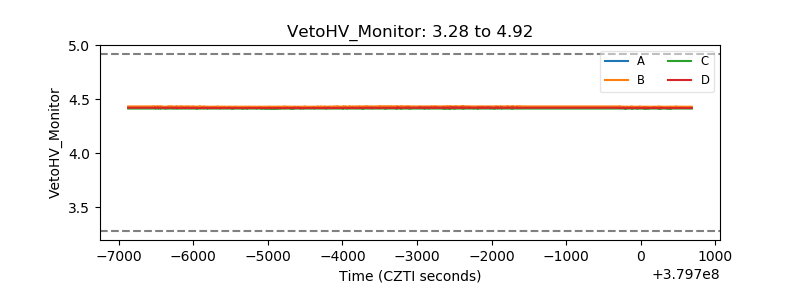 |
| Veto LLD | 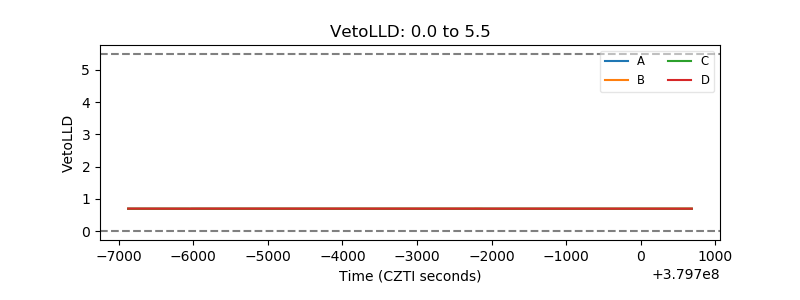 |
| Alpha Counter | 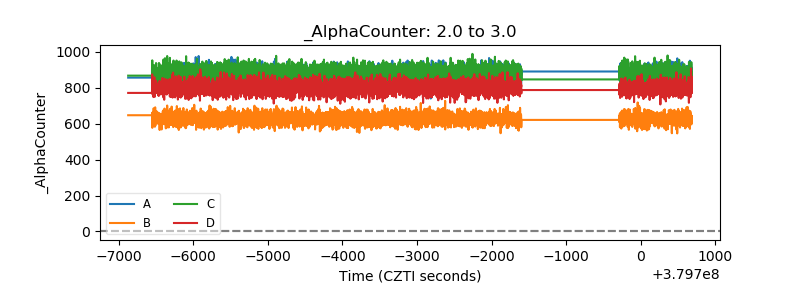 |
| _CPM_Rate | 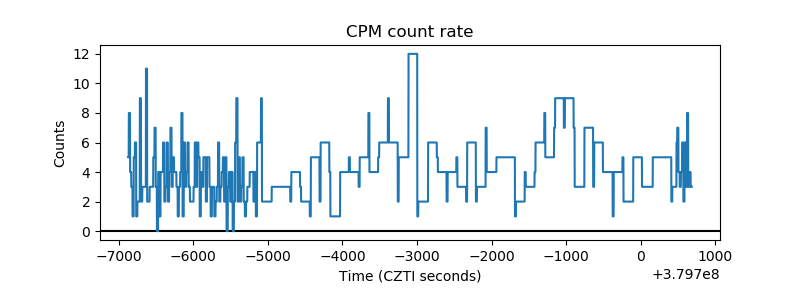 |
| CZT Counter |  |
| +2.5 Volts monitor |  |
| +5 Volts monitor |  |
| _ROLL_ROT | 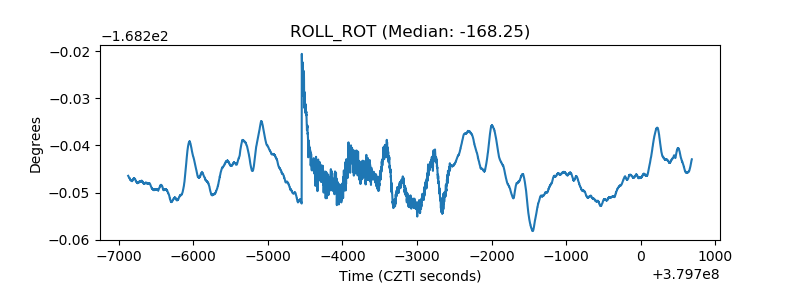 |
| _Roll_DEC | 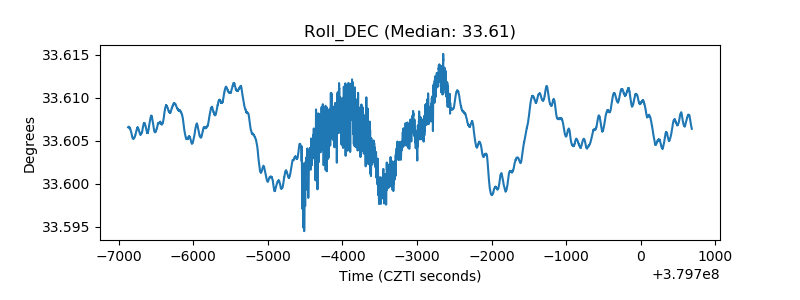 |
| _Roll_RA | 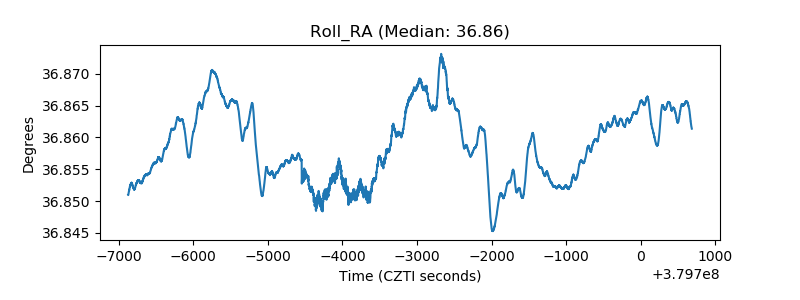 |
| Veto Counter | 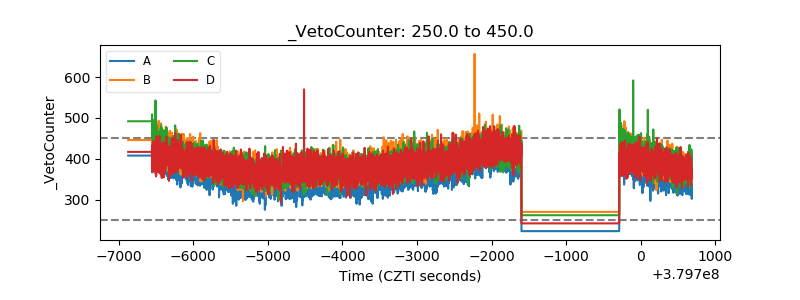 |